Long Gamma-Ray Bursts as standard candles
Abstract
As soon as it was realized that long GRBs lie at cosmological distances, attempts have been made to use them as cosmological probes. Besides their use as lighthouses, a task that presents mainly the technological challenge of a rapid deep high resolution follow-up, researchers attempted to find the Holy Grail: a way to create a standard candle from GRB observables. We discuss here the attempts and the discovery of the Ghirlanda correlation, to date the best method to standardize the GRB candle. Together with discussing the promises of this method, we will underline the open issues, the required calibrations and how to understand them and keep them under control. Even though GRB cosmology is a field in its infancy, ongoing work and studies will clarify soon if and how GRBs will be able to keep up to the promises.
Keywords:
gamma-ray sources; gamma-ray bursts; cosmology; dark energy:
98.70.Rz, 98.80.-k, 95.36.+x1 Introduction
At first glance, gamma-ray bursts (hereafter GRBs), are all but standard candles. We can quantify this statement by computing the isotropic equivalent energy, i.e. their energy output in photons assuming they radiate in every direction with the same properties:
| (1) |
where is the burst bolometric fluence, its redshift and its luminosity distance. This quantity is easy to measure, provided that the burst has been detected and its redshift measured. A basic knowledge of its spectrum is necessary in order to perform a bolometric correction, unless a statistical approach is adopted Bloom01 . Compilation of for burst samples show that this quantity spans, at least, three orders of magnitude Frail01 ; Ghirla04a . The isotropic equivalent energy is therefore all but a good standard candle. Type Ia supernovæ (SNe), as a test bench, have a RMS scatter of 0.075 decades.
Despite this apparent failure, the interest in GRBs as cosmological probes did not wane. Another related research branch was the effort to find a redshift estimate for bursts without optical afterglows. The real requirement of a cosmological test is to measure the source distance without measuring its redshift. Such a measure leads to an estimate of a luminosity distance or angular distance that allows for comparison with cosmological models.
In this paper I will review the attempts made to use GRBs as standard candles (§ 2). I will then discuss the Ghirlanda relation (§ 3), that seem to finally provide us with a candle that is standard enough to be used to test cosmological models (§ 4). I will finally discuss future prospects and developments of this idea (§ 5).
2 Correlations
The first attempt to find a correlation between GRB observables that could eventually lead to a distance measurement independent of redshift was the so-called variability-luminosity correlation Fenimore00 ; Reichart01 (see Fig. 1). It was found, for a small sample of BeppoSAX bursts with measured redshifts, that the intrinsic peak luminosity is correlated with the amount of variability present in the light curve. Therefore, if the light curve of a GRB can be observed with enough accuracy, the amount of variability can be converted into an intrinsic luminosity that, compared to the flux, yields a distance measurement.
Almost simultaneously, a correlation was discovered also between the luminosity and the time lag between light curve features at different frequencies Norris00 (see Fig. 1). The time lag is measured by cross-correlating the light curve of a GRB in two different energy bands (usually BATSE channels 1 and 3). It is found that the longer the lag between the two channels, the smaller the peak luminosity of the event. An attempt to use these correlations for cosmological purposes yielded poor results, due to the large scatter of both relations. Only formal limits to the cosmological parameters could be obtained Schaefer03 .


A different correlation was discovered after the realization that GRBs are most likely beamed in a cone rather than isotropic explosions. Frail et al. Frail01 and Panaitescu and Kumar Panaitescu01 noted independently that the more luminous is the GRB, the earlier is its break time (and therefore the smaller its beaming angle). If the isotropic equivalent energy is corrected for the beaming angle, a remarkable clustering of the “true” energies is obtained. Given the need to know the break time of the afterglow light curve, it is more difficult to obtain all the necessary information for a given GRB. Analogously to the other correlations described above, this correlation is affected by a large scatter that does not allow its use for cosmological tests Bloom03 .

Finally, a new insight into the parameter space was opened by the systematic analysis of spectra of the prompt emission of BeppoSAX GRBs Amati02 . Amati et al. showed that a remarkable correlation is present between the typical photon frequency (measured as the peak of the spectrum in units) and the burst isotropic equivalent energy (see Fig. 2). Again, the scatter of the correlation is too big to allow for any cosmological use. A debate is open on whether there is a selection effect increasing the narrowness of the correlation Nakar05 .
3 The Ghirlanda Correlation
A dramatic improvement over the previous attempts was achieved by merging the standard energy results Frail01 ; Panaitescu01 with the spectral results Amati02 . Ghirlanda and collaborators Ghirla04a noticed that if the Amati plot (Fig. 2) is modified by using the beaming corrected energy rather than the isotropic equivalent one, a very narrow relation between points is obtained. The scatter of points around the correlation is impressively small. A Gaussian fit yielded a dispersion of 0.15 decades, approximatively twice as large as the scatter of Type Ia SNe. To counterbalance the small scatter of the correlation, placing a GRB on the Ghirlanda plot requires a complicated set of observations. The measure of the typical frequency of photons in the prompt GRB emission requires broadband coverage, from X-rays to soft -rays. If such a broad coverage was provided in the past by BATSE and BeppoSAX, most of the Swift bursts do not have an adequately large band, unless observed simultaneously by HETE-2. On the other hand, the measure of the beaming corrected energy requires a knowledge of the opening angle of the GRB. This can be obtained only with continuous sampling of the afterglow light curve, possibly in multiple bands, to unambiguously identify an achromatic break that can be associated to the geometry of the fireball. Finally, a good measure of the opening angle of the GRB requires the knowledge of the density profile of the medium surrounding the GRB. The association of GRBs with the death of massive stars and simultaneous explosion with Type Ic SNe Hjorth03 ; Stanek03 ; Malesani04 suggests a stratified medium surrounding the GRB. On the other hand, external shock fits generally suggest a flat distribution of density. It can be shown Nava06 (see the right panel of Fig. 3) that changing the assumption on the environment profile does not destroy the correlation, but changes its slope. A tighter correlation is found for a wind environment.


4 The Ghirlanda correlation as a cosmology tool
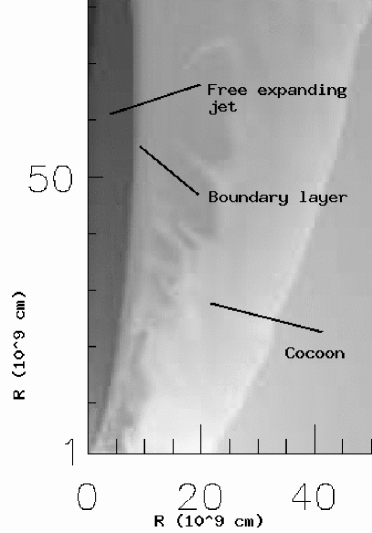
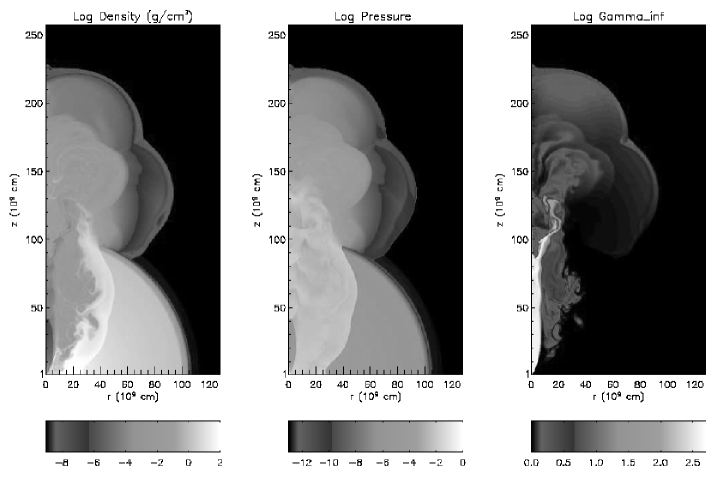
Thanks to the narrowness of the Ghirlanda correlation, a GRB Hubble diagram can be produced yielding promising results Ghirla04b . A deep knowledge of the systematic errors is however necessary before a meaningful constraint on cosmological parameters can be derived Friedman05 . Besides the uncertainty on the environment stratification and the difficulty in the measurement of the peak frequency with a relatively narrow band instrument, a major issue is to understand the relation between the break time in the light curve and the opening angle of the jet. So far toy models for which the jet is uniform inside a well-defined opening angle and absent outside have been used. However, it is expected that this model is not extremely accurate. If the jet is hydrodynamically confined inside the progenitor star Macfadyen99 ; Lazzati05 , the jet reaching th surface of the star is expected to be complex (see Fig. 4). The jet-star interaction creates a high-pressure cocoon that surrounds and confines the jet. The jet structure evolves then toward a stable solution with a freely expanding jet core surrounded by a boundary layer that flows parallel to the jet-cocoon discontinuity and is in pressure equilibrium with the cocoon. The jet that emerges on the surface of the star is therefore complex as can be seen in Fig. 5, where density, pressure and entropy of the jet are shown few seconds after the jet breakout (Morsony et al. in preparation).
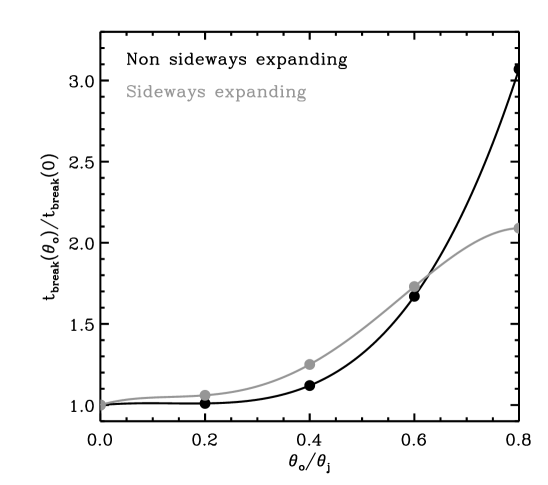
Besides the structure of the jet, another aspect to consider is the viewing angle of the observer with respect to the jet axis. Rossi et al. Rossi04 showed that, in the simplest assumption of a conical jet that does not expand sideways, the viewing angle has a strong influence on the time of the break (Fig. 6). This uncertainty should propagate and affect the dispersion of the points around the Ghirlanda correlation. The observed dispersion is too small and therefore a smaller dependence of the break time from the viewing angle has to be relevant in the real case. One possibility to avoid such a large dependence of the break time on the viewing angle is to assume a so-called structured jet Rossi04 . In this case, all the jets are assumed to be alike, but with an energy distribution in solid angle,
| (2) |
It can be shown that with such an energy configuration the afterglow light curve is similar to that of a uniform jet, with an early-time shallow decay, a late-time fast decay, and a break time that connects the two regimes. The break time, however, is not related to the opening angle of the jet but to the viewing angle. As a consequence, to any break time is associated a single viewing time and a single value of . This configuration mimicks a wide low-energy jet for oservers far from the axis of the beam and mimicks a narrow powerful jet for observers close to the jet axis. This solution explains successfully the small scatter of the Ghirlanda relation. Attempts to unveil the true structure of the jet have so far been inconclusive. Theoretically, the jet structure may be due to the turbulent interaction of the jet with the star or to the spreading of the jet as the star confinement progressively wanes and disappear Lazzati05 .
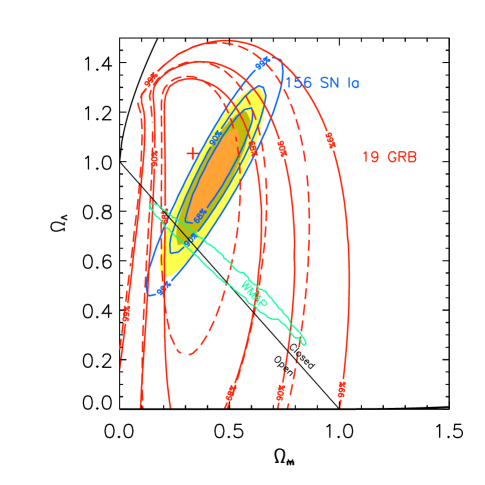
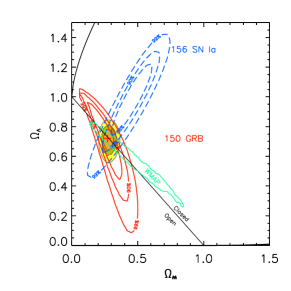
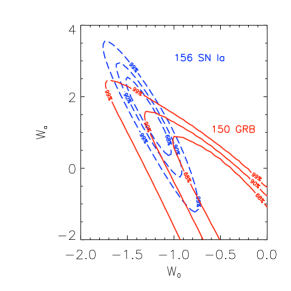
Despite these theoretical and observational uncertainties one can blindly apply the Ghirlanda correlation to derive constraints on the cosmological parameters Ghirla04b ; Ghirla06 . Figure 7 shows the result that can be derived with the present sample of GRBs. The allowed region is still wide, mainly due to the paucity of the sample. A fairer comparison can be obtained by simulating a sample of 150 bursts. Figure 8 shows the result of such an effort. GRBs indeed provide strong constraints on the cosmological parameters and on the Dark Energy evolution.
5 Discussion
The attempt to standardize the GRB candle has a long history. Since it was realized that GRBs explode at large redshifts, it became of great interest to understand whether GRBs could be used as distance indicators. It was soon clear that at first glance GRBs are useless as distance indicators, since their apparent luminosity spans at least three orders of magnitude. Soon after, however, it was realized that correlations between observables exist and that these correlations can lead to a more standard GRB candle. Attempts with the variability-luminosity and lag-luminosity correlations yielded inconclusive results. The large scatter of the Amati relation hampered, in a similar way, all attempts to use it for cosmological purposes.
The recent discovery of the Ghirlanda correlation Ghirla04a opened new possibilities. The scatter of points around that correlation is only approximatively twice as large as that of Type Ia SNe around the stretching-luminosity correlation. With a suitably large sample (comparable in number to that of Ia SNe) GRBs could provide interesting new constraints on cosmological parameters and the evolution (if any) of the Dark Energy. However, more insight in the origin of the correlation and its systematic errors has to be obtained before strong claims can be made. In particular, we still have to understand clearly the structure of the external medium, the jet structure and the relation of the jet break time to the opening angle (or structure) of the jet.
References
- (1) J. S. Bloom, D. A. Frail, and R. Sari, The Astronomical Journal 121, 2879–2888 (2001).
- (2) D. A. Frail, et al, The Astrophysical Journal Letters 562, L55–L58 (2001).
- (3) G. Ghirlanda, G. Ghisellini, and D. Lazzati, The Astrophysical Journal 616, 331–338 (2004).
- (4) E. E. Fenimore and E. Ramirez-Ruiz, astro-ph/0004176 (2000).
- (5) D. E. Reichart, et al., The Astrophysical Journal 552, 57–71 (2001).
- (6) J. P. Norris, G. F. Marani, and T. J. Bonnell, The Astrophysical Journal 534, 248–257 (2000).
- (7) B. E. Shaefer, The Astrophysical Journal Letters 583, L67–L70 (2003).
- (8) D. A. Frail, et al., The Astrophysical Journal Letters 562, L55–L58 (2001).
- (9) A. Panaitescu and P. Kumar, The Astrophysical Journal Letters 560, L49–L53 (2001).
- (10) J. S. Bloom, D. A. Frail, S. R. Kulkarni The Astrophysical Journal 594, 674–683 (2003).
- (11) L. Amati, et al. Astronomy & Astrophysics 390, 81–89 (2002).
- (12) L. Amati, Submitted to MNRAS, astro-ph/0601553 (2006).
- (13) E. Nakar and T. Piran, Monthly Notices of the Royal Astronomical Society 360, L73–L76 (2005).
- (14) L. Nava, G. Ghisellini, G. Ghirlanda, F. Tavecchio, and C. Firmani, Astronomy & Astrophysics in press astro-ph/0511499 (2006).
- (15) J. Hjorth, et al., Nature 423, 847–850 (2003).
- (16) K. Stanek, et al., The Astrophysical Journal Letters 591, L17–L20 (2003).
- (17) D. Malesani, et al., The Astrophysical Journal Letters 609, L5–L8 (2004).
- (18) G. Ghirlanda, G. Ghisellini, D. Lazzati, and C. Firmani, The Astrophysical Journal Letters 613, L13–L16 (2004).
- (19) A. S. Friedman and J. S. Bloom, The Astrophysical Journal 627, 1–25 (2005).
- (20) A. I. MacFadyen and S. E. Woosley, The Astrophysical Journal 524, 262–289 (1999).
- (21) D. Lazzati and M. C. Begelman, The Astrophysical Journal 629, 903–907 (2005)
- (22) E. Rossi, D. Lazzati, J. D. Salmonson, and G. Ghisellini, Monthly Notices of the Royal Astronomical Society 354, 86–100 (2004).
- (23) G. Ghirlanda, G. Ghisellini, C. Firmani, L. Nava, F. Tavecchio, and D. Lazzati, Astronomy & Astrophysics submitted astro-ph/0511559 (2006).