The rate and luminosity function of Short GRBs
Abstract
We compare the luminosity function and rate inferred from the BATSE short hard bursts (SHBs) peak flux distribution with the redshift and luminosity distributions of SHBs observed by Swift/HETE II. The Swift/HETE II SHB sample is incompatible with SHB population that follows the star formation rate. However, it is compatible with a distribution of delay times after the SFR. This would be the case if SHBs are associated with binary neutron star mergers. The implied SHB rates that we find range from to Gpc-3yr-1. This rate is a much higher than what was previously estimated and, when beaming is taken into account, it is comparable to the rate of neutron star mergers estimated from statistics of binary pulsars. If GRBs are produced in mergers the implied rate practically guarantees detection by LIGO II and possibly even by LIGO I, if we are lucky. Our analysis, which is based on observed short hard burst is limited to bursts with luminosities above erg/sec. Weaker bursts may exist but if so they are hardly detected by BATSE or Swift and hence their rate is very weakly constrained by current observations. Thus the rate of mergers that lead to a detection of a gravitational radiation signal might be even higher.
Keywords:
cosmology:observations-gamma rays:bursts-gravitational radiation:
95.55.Ka,98.70.Rz1 Introduction
The luminosity and rate of Gamma-Ray Bursts (GRBs) is one of the key issues in any astrophysical model. Shortly after the discovery that GRBs are cosmological Piran piran92 and Mao and Paczynski mp92 used the observed value of and estimated, assuming that the GRB rate is independent of redshift and that they are standard candles, the rate of GRBs. Already at that time Piran piran92 suggested that if GRBs arise due to neutron star mergers eichler89 their rate will depend on redshift and it will follow the neutron star binary formation rate with a logarithmic distribution of time delays, reflecting the distribution of merger times. In 1993 Koveliotou kouv93 noticed that the GRB distribution can be divided into two subsets of long and short bursts with a dividing duration of 2sec. As short bursts are also harder than long ones dez96 ; kouv96 , they are denoted as Short Hard Bursts (SHBs). Mao et al, mao94 realized that BATSE is less sensitive to short GRBs than to long ones and pointed out that this should be considered when trying to fit the observed peak flux distribution to different models. Shortly afterwards Cohen and Piran carried out the first separate analysis of the luminosity and rates of long and short GRBs finding that the observed SHB population is located , namely they are much nearer than the observed distribution of long ones. Unfortunately a stubborn referee forced these authors to take out the discussion of short GRBs from cp95 and these results were reported only in a conference proceedings piran94 and in Cohen’s Phd thesis c96 . These finding were corroborated shortly later by Katz and Canel kc96 and later by Tavani ta98 who found that of SHBs is significantly higher than the one measured for long bursts. With the discovery in 1997 of GRB afterglow and the subsequent identification of host galaxies and redshift measurements direct estimates of the luminosity and rates were obtained for long bursts. It was discovered that long GRBs follow the SFR and that typical (isotropic equivalent) peak luminosities are about ergs/sec. However, until recently no afterglow was detected from any short burst who remained as mysterious as ever. Last spring Swift and then HETE II detected X-ray afterglow from several short bursts. In some cases optical and radio afterglows were detected as well. This has lead to identification of host galaxies and to redshift measurements. While the current sample is very small several features emerge. First, unlike long GRBs that take place only in star forming spiral galaxies SHBs take place also in elliptical galaxies in which the stellar population is older. In this SHBs behave like type Ia Supernovae. Second, the redshift and peak (isotropic equivalent) luminosity distributions of the five short bursts (see Table 1) confirm earlier expectations piran94 ; c96 ; kc96 ; ta98 ; gp05 that the observed SHB population is significantly nearer than the observed long burst population. We gp05 (denoted hereafter GP05) have estimated, before the launch of Swift the luminosity function and formation rate of SHBs from the BATSE peak flux distribution. We have shown that the distribution is compatible with either a population of sources that follow the SFR (like long bursts) or with a population that lags after the SFR piran92 ; ando04 . If SHBs are linked to binary neutron star mergers eichler89 the SHB rate is given by the convolution of the star formation rate with the distribution of the merging time delays of the binary system. These delays reflect the time it takes to the system to merge due to emission of gravitational radiation.
| GRB | 050509b | 050709 | 050724 | 050813 | 051221 |
|---|---|---|---|---|---|
| z | 0.22 | 0.16 | 0.257 | 0.7 or 1.80 | 0.5465 |
| erg/sec | 0.14 | 1.1 | 0.17 | 1.9 | 3 |
Table 1: The Swift/HETE II current sample of SHBs with a known redshift.
2 The luminosity function of the BATSE SHB sample
As BATSE is less sensitive to short bursts than to long ones mao94 , even an intrinsic SHB distribution that follow the SFR gives rise to an observed distribution that is nearer to us. Still a delayed SFR distribution (that is intrinsically nearer) gives rise to even nearer observed distribution gp05 . Therefore the recent observed redshift distribution of SHBs favors the delayed model and hence the merger scenario. Still the question was posed whether the predicted observed distribution is consistent with the current sample. Gal Yam et al., GalYam05a suggested that the distributions are inconsistent and hence the delayed SFR model is ruled out. We re-examine the situation here and we show that while a delayed distribution with the best fit (maximal likelihood) parameters ia only marginally consistent () with the current sample, a delayed distribution with parameters within from the best fit parameters is compatible (). We discuss the implications of this result to the binary Neutron star merger model and to the detection of gravitational radiation from such mergers. We also discuss the recent suggestion of Nakar et al. n05 that there rate of mergers producing very weak bursts is very high. Our data set and methodology follow gpw05 ; gp05 . We consider all the SHBs detected while the BATSE onboard trigger pa99 was set for 5.5 over background in at least two detectors in the energy range 50-300keV. These constitute a group of 194 bursts. We assume the functional form of the rate of bursts (but not the amplitude). We then search for a best fit luminosity function. Using this luminosity function we calculate the expected distribution of observed redshifts and we compare it with the present data. We consider the following cosmological rates:
-
•
(i) A rate that follows the SFR (We do not expect that this reflects the rate of SHBs but we include this case for comparison.).
-
•
(ii) A rate that follows the NS-NS merger rate. This rate depends on the formation rate of NS binaries, that one can safely assume follows the SFR, and on the distribution of merging time delays, . This, in turn, depends on the distribution of initial orbital separation between the two stars () and on the distribution of initial eccentricities. Both are unknown. From the coalescence time distribution of six double neutron star binaries champ04 it seems that const, implying ,piran92 . Therefore, our best guess scenario is a SBH rate that follows the SFR with a logarithmic time delay distribution.
-
•
(iii) A rate that follows the SFR with a delay distribution const.
-
•
(iv) A constant rate (which is independent of redshift.).
For the SFR we employ of Porciani & Madau pm01 : In models (ii) and (iii) the rate of SHBs is given by:
| (1) |
| Rate(z=0) | ||||||
|---|---|---|---|---|---|---|
| erg/sec | (z=0.7) | (z=1.8) | ||||
| i | ||||||
| ii | 0.05 | 0.06 | ||||
| iiσ | 0.1 | 0.22 | 0.25 | |||
| iii | 0.91 | 0.91 | ||||
| iv | 0.41 | 0.41 |
Table 2: Best fit parameters Rate(z=0) , , and and their confidence levels for models (i)-(iv). Also shown are the KS probability () that the five bursts with a known redshift arise from this distribution. We show two results for KS tests one with GRB 0508132 at and the other at . Case iiσ corresponds to case ii with an value lower by than the best fit one. Other parameters have been best fitted for this fixed number. Following Schmidt sch01 (see also gpw05 ; gp05 ) we consider a broken power law peak luminosity function with lower and upper limits, and , with power law indeces, , and luminosity break . We use gp05 . In gp06 (denoted GP06 hereafter) we show that both limits are chosen in such a way that a very small fraction (less than 1%) of the observed bursts are outside these range. Hence one cannot infer anything from the observations on the luminosity function in this range. Comparing the predicted distribution with the one observed by BATSE we obtain, the best fit parameters of each model and their standard deviation. The results are shown in table 2 and in figs 1 and 2 of GP06.
3 A Comparison with the current Swift-HETE II SHB sample
We can derive now the expected redshift distribution of the observed bursts’ population in the different models. We assume that the minimal peak flux for detection for Swift is ph/cm2/sec like BATSE (note the different spectral windows of both detectors which makes Swift relatively less sensitive to short bursts). Fig. 1 depicts the expected observed integrated redshift distributions of SHBs in the different models. As expected, a distribution that follows the SFR, (i), is ruled out by a KS test with the current five bursts (%). This is not surprising as other indications, such as the association of some SHBs with elliptical galaxies suggest that SHBs are not associated with young stellar populations.
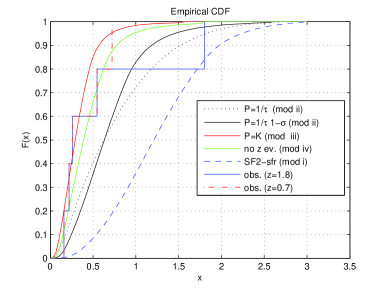
A distribution that follows the SFR with a constant logarithmic delay distribution, (ii), is marginally consistent with the data (%). The observed bursts are nearer (lower redshift) than expected from this distribution. If we use the Rowan-Robinson SFR gp05 , rather than SF2 of Porciani-Madau, the situation is even more promising % (for either z=0.7 or z-1.8). When we move to a distribution that is 1 away from the best fit distribution we find % and even higher for the RR SFR. Thus the suggestion GalYam05a that the observed sample rules out the NS merger model (with a logarithmic merger time distribution) was somewhat premature. Note however, that the local rate with this model (iiσ) is sixteen times larger than the rate of the best fit model, (ii). This reflects the large flexibility in modeling the peak flux distribution. To demonstrate the flexibility of the data we have considered two other time delay distributions. A uniform time delay distribution (iii) and an overall constant SHB rate (iv). Both models are compatible with the BATSE SHB distribution and with the sample of SHBs with a known redshift ( 80% and 40% respectively.). This result is not surprising. The BATSE peak flux distribution depends on two unknown functions, the rate and the luminosity function. There is enough freedom to chose one function (the rate) and fit for the other. In all models compatible with the five bursts with a known redshift, the intrinsic SHB rate is pushed towards lower redshifts. The inferred present rates, , and Gpc-3yr-1 for models (iii), (iv) and (iiσ) respectively, are larger by a factor ten to fifty than those estimates earlier (assuming that SBHs follow the SFR with a logarithmic delay with the best fit parameters GP05). The corresponding “typical” luminosities, , ranges from 0.1 to 0.7 erg/sec.
4 Conclusions and Implications
We have repeated the analysis of fitting the BATSE SHB data to a model of the luminosities and rates distributions. Our best fit logarithmic distribution model is similar to the best fit logarithmic model presented in GP05. A main new ingredient of this work is the fact that we consider several other models. We confirm our earlier finding that the BATSE data allows a lot of flexibility in the combination of the rates and luminosities. A second new ingredient of this work is the comparison of the best fit models to the small sample of five Swift/HETE II SHBs. The Swift/HETE II data gives a new constraint. This constraint favors a population of SHBs with a lower intrinsic luminosity and hence a nearer observed redshift distribution. It implies a significantly higher local SHB rate - a factor of ten to fifty higher than earlier estimates. The new observations of Swift show that the SHBs are nearer than what was expected before and therefore, their luminosity is lower and their local rate is higher. We stress that this new result was within the 1 error of the model presented in GP05, which had a very large range of allowed local rates and typical luminosities. Provided that the basic model is correct and we are not mislead by statistical (small numbers), observational (selection effects and threshold estimates) of intrinsic (two SHB population) factors we can proceed and compare the inferred SHB rate with the observationally inferred rate of NS-NS mergers in our galaxy na91 . This rate was recently reevaluated with the discovery of PSR J0373-3039 to be rather large as /Myr. Although the estimate contains a fair amount of uncertainty ka04 . If we assume that this rate is typical and that the number density of galaxies is /Mpc3, we find a merger rate of /Gpc3/yr. Using a beaming factor of 30-50 for short bursts be05 this rate implies a total merger rate of /Gpc3/yr for the three cases (iii), (iv) and (iiσ). The agreement between the completely different estimates is surprising and could be completely coincidental as both estimates are based on very few events. If correct these estimates are excellent news for gravitational radiation searches, for which neutron star mergers are prime targets. They imply that the recently updates high merger rate, that depends mostly on one object, PSR J0737+3039, is valid. These estimate implies one merger event within Mpc per year and one merger accompanied with a SHB within Mpc. These ranges are almost within the capability of LIGO I and certainly within the capability of LIGO II. If correct these estimates of the rate are excellent news for gravitational radiation searches, for which neutron star mergers are prime targets. To conclude we stress that we have assumed that the luminosity function has a lower limit of . This was just because even if such a limit does not exists weaker bursts would be barely detected. The current peak flux distribution of BATSE burst cannot confirm (or rule out) the existence of such population (note however, that Tanvir et al., tavnir05 suggest that such a population exists on the basis of the angular distribution of BATSE SHBs). If such weak bursts exist then, of course, the overall merger rate will be much larger n05 . Such events will provide such a high rate that soon LIGO I will begin to constrain this possibility.
References
- (1) Piran, T., 1992 ApJ,389, L83.
- (2) Mao, S., and Paczynski, B., 1992, ApJ, 388, L45.
- (3) Eichler, D., Livio, M., Piran, T., Schramm, D., 1989, Nature, 340, 126
- (4) Kouveliotou, C. et al., 1993, ApJ 413, L101.
- (5) Dezalay, J. P. et al., 1996, ApJ 471, L27.
- (6) Kouveliotou, C. et al., 1996, in Gamma-ray bursts, Proceedings of the 3rd Huntsville Symposium. AIP Conference proceedings series, 1996, vol. 384, edited by Kouveliotou et al., ISBN: 156966859, p.42.
- (7) Mao, S., Narayan, R. & Piran, T., 1994, ApJ 420, 171.
- (8) Cohen, E., and Piran, T., ApJ, 444, L25.
- (9) Piran, T. 1994, AIP Conf. Proc. 307: Gamma-Ray Bursts, 307, 543, (astro-ph/9412098).
- (10) Cohen, E., Phd Thesis, Hebrew University, 1996
- (11) Katz, J. I. & Canel, M., 1996, ApJ 471, 915.
- (12) Tavani, M., 1998, ApJ 497, L21.
- (13) Guetta, D., & Piran, T. 2005, A&A, 435, 421 (GP05)
- (14) Ando, S., 2004, JCAP, 06, 007.
- (15) Gal-Yam, A., et al.,2005, astro-ph/0509891.
- (16) Nakar, E., Gal Yam., A., and Fox, D., 2005, astro-ph/0511254,
- (17) Guetta, D., Piran, T. & Waxman E., 2005, ApJ, 619, 412.
- (18) Paciesas et al., 1999, ApJ. Supp. 122, 465.
- (19) Champion et al., 2004, MNRAS 350, L61.
- (20) Porciani, C., and Madau, P., 2001, ApJ 548, 522.
- (21) Schmidt, M., 2001, ApJ 559, L79.
- (22) Guetta, D. & Piran, T. 2006, submitted to A& A, astro-ph/0511239 (GP06)
- (23) Narayan, R., Piran, T., Shemi, A., 1991, ApJ 379, L17.
- (24) Kalogera, V. et al., 2004, ApJ 603, L41, erattum, 2004, ApJ. 614, L137.
- (25) Berger, E. et al. 2005, astro-ph/0508115.
- (26) Tanvir, N., et al., 2005, astro-ph/0509167