An unbiased deep search for small-area molecular structures
Abstract
Context. Small-area molecular structures (SAMS) resembling those clumpuscules, proposed by Pfenniger and Combes (1994) as candidate for baryonic dark matter, have recently been detected (Heithausen 2002, 2004) in an area where the shielding is too low for them to survive for a long time.
Aims. To study the frequency of occurence of such structures I present the results of an unbiased deep search for molecular clumpuscules.
Methods. The area surrounding these structures has been surveyed using the FCRAO 14m telescope in the CO transition. The field covered is 20′ by 20′. The resulting rms of the data is only 0.04 K in a 0.127 km s-1 wide channel. Also, high-angular resolution observations of the 13CO and C18O transitions were obtained with the IRAM Plateau-de-Bure Interferometer.
Results. 3 new SAMS have been detected. The structures have very low intensities which makes it impossible to detect them in large scale CO surveys conducted to map the molecular gas of the Milky way. They move with a similar radial velocity as the surrounding HI gas. The clouds follow the same size-linewidth relation as found for giant molecular clouds or Galactic cirrus clouds. The observations clearly show that most of the large linewidths observed at low angular resolution is caused by a large velocity difference among the clumps seen at highest angular resolution.
The non-detection of the structures in the high-angular resolution observations of the 13CO and C18O transitions shows that the 12CO transition must have a low optical depth. At an adopted distance of 100 pc the structures have masses of only Jupiter mass or below.
Conclusions. My observations show that SAMS might be an abundant phenomenon in the interstellar medium however not recognized as such due to their small size. If they are made of ordinary interstellar matter with solar metallicity they likely contribute only little to the total interstellar mass.
Key Words.:
Dark matter - Interstellar medium (ISM): abundances - ISM: clouds - ISM: moleculesE-mail: aheithau@uni-koeln.de
1 Introduction
It has been proposed that most of the baryonic dark matter in the Galaxy could be made of small, dense clumps of molecular hydrogen (Pfenniger & Combes pfenniger:combes1994 (1994); de Paolis et al. depaolis1995 (1995); Gerhard & Silk gerhard:silk1996 (1996); Walker & Wardle walker:wardle1998 (1998)). The detection of H2 is notoriously difficult due to the missing emission lines of that molecule at temperatures below a few hundred K. Sensitive absorption line studies towards many lines of sight have shown that H2 is ubiquitous in our Galaxy (e.g. Shull et al. shull:etal2000 (2000); Richter et al. 2003a ; Jenkins et al. jenkins:etal2003 (2003)) even in the diffuse medium.
While absorption line measurements indicate that there is significant small-scale structure even in the molecular gas, they do not provide much information on the structure or the form of the absorbing clouds. The recent detection of small-area molecular structures (SAMS) in emission of the CO transition (Heithausen heithausen2002 (2002), hereafter Paper 1) thererfore provided the first chance to study their small scale structure in detail. The detection was somewhat puzzling because the clouds were observed in an area where the shielding is too low for them to survive for a longer time.
Follow-up high-angular resolution observations (Heithausen heithausen2004 (2004), hereafter Paper 2) showed that the structures resembled those clumpuscules predicted by Pfenniger & Combes (pfenniger:combes1994 (1994)) as important candidates for the baryonic dark matter, albeit warmer and probably less massive. These observations also revealed that all the mass seen on larger scale is contained in smaller structures, a few hundred AU large, with no need for a diffuse molecular component.
Here I present the results of a deep search for further small-area molecular structures in the area where the first ones have been detected. I will show that these structures are not isolated objects but group in small clusters. Furthermore I will discuss high-angular resolution observations of SAMS2 in the 13CO and C18O transition which provide information on the optical depth in the same transition of the main isotopomer 12CO. These information will allow a better estimate of the mass of the objects and thus of their relative importance.
2 Observations
2.1 FCRAO observations
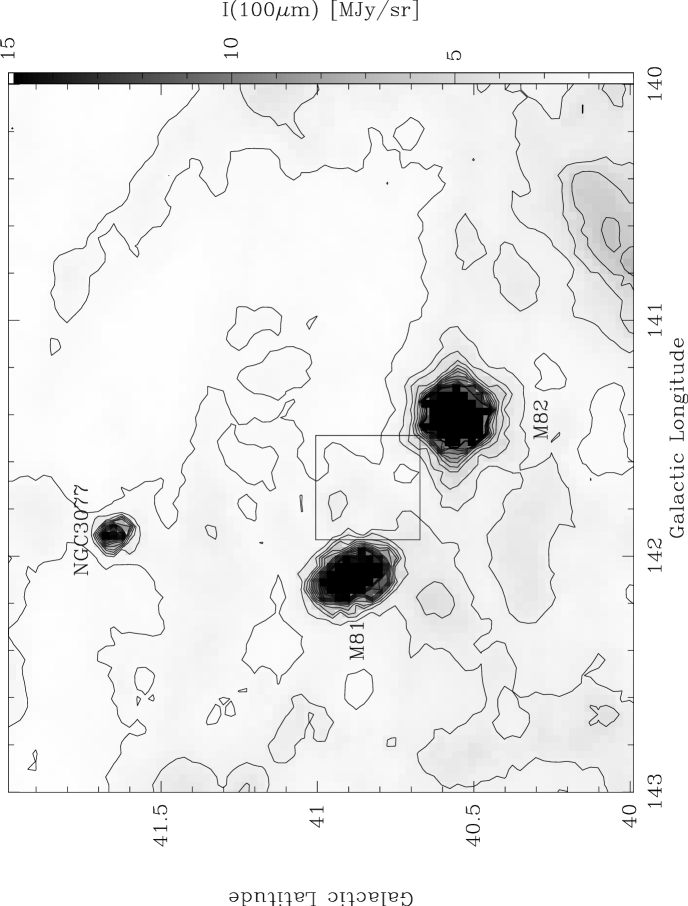
To study whether SAMS2 is an isolated object, a large-scale map (see Fig. 1) in the CO transition was obtained with the 14m telescope of the Five College Radio Astronomical Observatory (FCRAO) near Amherst in Massachusetts, U.S.A., in April 2003 and January and February 2004. Using the Sequoia 32 pixel receiver, data were taken in the on-the-fly mode with an off-position adopted to be free of emission about 1 degree away from the source position. The area was sampled with a spacing of between individual positions. The angular resolution of the 14m telescope at 115 GHz was , the main beam efficiency was 0.45. The resulting map has a size of by . The spectra were sampled with a velocity resolution of 0.127 km s-1; the resulting rms in the spectra was 0.04 K.
2.2 Plateau-de-Bure observation
High angular resolution 13CO and C18O data in the transition were obtained with the Plateau-de-Bure interferometer near Grenoble in the French Alps between May and December 2004. The observations were conducted in the C and D configuration which gives an angular resolution of by . The map consists of 6 individual pointings covering an area a bit larger than that observed in the 12CO transition (Paper 2). The final spectral resolution was 0.1 km s-1 at 110GHz.
3 Results
3.1 CO on larger scale
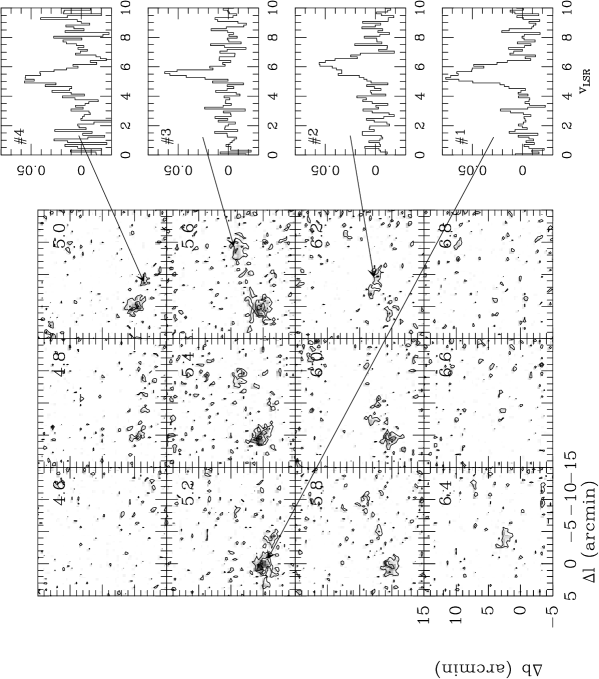
Fig. 2 shows the results of the unbiased observations of a large area around SAMS2. Presented are maps integrated over 0.2 km s-1 wide velocity channels. In these maps four individual clouds can be found: #1 corresponds to SAMS2, the other three have previously not been identified. There are even more candidates for molecular clouds in the field which are however close to the detection limit and thus have to be confirmed. Most of those are found in the velocity range between 5 and 7 km s-1 where the other clouds are detected. This velocity range is identical to that of the HI gas in the same direction.
Note that with the on-off observing method chosen for the observations, signals which change not much between the on and off position in both velocity and intensity are filtered out. Due to the location of the off-position at from the position of the map diffuse clouds larger than 1 degree cannot be detected. Clouds appearing in on- and off-position with velocities differing by more than the velocity resolution (0.127 km s-1) would show up as P-Cygni type line profiles with clouds in the off-position as apparent absorption dip. Such profiles were however not detected in the data.
Values from a gaussian fit to the cloud averaged spectra are listed in Tab. 1. Line parameters are derived from spectra averaged over the area with significant emission. Radii given in that table were determined from that area via . The center positions were determined from a two dimensional gaussian fit to the clouds.
| Number | Radius(1) | Identification | |||||||
|---|---|---|---|---|---|---|---|---|---|
| (deg) | (deg) | (K) | (K) | ( km s-1) | ( km s-1) | (′) | M⊙ | ||
| #1 | 141.723 | 41.860 | 0.072 | 0.010 | 1.9 | 1.4 | SAMS2 | ||
| #2 | 141.666 | 40.895 | 0.053 | 0.011 | 1.6 | 0.7 | |||
| #3 | 141.518 | 40.922 | 0.060 | 0.012 | 1.5 | 0.3 | |||
| #4 | 141.615 | 40.822 | 0.055 | 0.015 | 0.9 | 0.2 | |||
| Remarks: 1) the radius is determined from the area covered by spectra with emission via . 2) Masses are pure H2 masses not corrected for the contribution of Helium; they are calculated using the X-factor. Masses determined assuming a low optical depth are a factor 13.6 lower (see text). | |||||||||
3.2 CO excitation and cloud masses
In the high-angular resolution 13CO and C18O observations no signal of more than 0.3 K () was detected compared to lines up to 6 K in the same velocity range of the 12CO line (Paper 2). In typical Galactic molecular clouds both the 12CO and the 13CO lines are readily detected with an line ratio of (e.g. Falgarone et al. falgarone:etal1998 (1998)), much higher than one would expect from the isotopic ratio (e.g. Bensch et al. bensch:etal2001 (2001)) under the assumption that the lines are optically thin. It is therefore normally concluded that (at least) the 12CO line is optically thick. For SAMS2 the intensity ratio is much higher , which means that the 12CO line has a significant lower optical depth than the same line in other Galactic molecular clouds.
The H2 masses of the structures were therefore determined in two ways:
Using the X-factor and adopting a distance of 100 pc to the clouds I derive masses in the range of Jupiter masses . The mass for SAMS2 determined this way is in agreement with that determined from the IRAM 30m data (Paper 1) given the uncertainties in the determination of the radii and the respective main beam efficiencies of the telescopes used.
Assuming optically thin emission and adopting a excitation temperature K (see Paper 2) results in H2 masses which are a factor of 13.6 lower than those determined with the X-factor. Note that the CO abundance in regions with low shielding is expected to be lower (e.g. van Dishoeck & Black vandishoeck:black1988 (1988)) than the value for large molecular clouds given by Sutton et al.; the masses determined that way are therefore lower limits to the real value (provided the distance is correct).
4 Discussion

4.1 Velocity
The observations presented in this paper show clearly that SAMS break up in more and more clumps when going from low to high angular resolution. E.g. SAMS2 seen with the FCRAO telescope shows up as a single structure with indication for further substructure. Observed with the IRAM 30m telescope at least two substructures are visible (Paper 1). At high angular resolution observed with the PdB interferometer at least 6 smaller stuctures are observed, some of which are even unresolved (Paper 2). While the angular resolution increases the line of sight line width decreases from about 1 km s-1 at a resolution of 44′′ to about 0.4 km s-1 at 3′′. It is obvious that most of the large line width at low angular resolution is caused by a large velocity gradient among the smallest visible structures.
I therefore first analyse the size-linewidth relation which provides a good estimate for the amount of turbulence. Before however we use the data from Paper 1 and 2 to compare them with the data presented in this paper we have to correct for the different definition of the sizes. In Paper 1 and 2 I defined the sizes as full width at half maximum of the structures derived from a gaussian fit to the data. In this paper the radius was derived from the total area covered by significant emission. The latter definition depends therefore on the signal-to-noise ratio of the data, i.e. a higher results in a larger size. The correction factor can easily be calculated from a comparison of their different definitions: . For the actual it follows that .
The data corrected that way are plotted in Fig. 3. This figure also includes a single value for the whole ensemble of clouds in the area; for that the radius has been calculated from the total area covered by significant emission, and the linewidth from the sum of the spectra shown in Fig. 2. Rather than plotting formal error bars the figure shows the range of values for the different scales observed. The data nicely follow a relation of the form
with which is within the range of values found for giant molecular clouds (Larson larson1981 (1981)) and Galactic cirrus clouds (Heithausen heithausen1996 (1996)).
4.2 Abundance
Even with the deep observations presented in this paper it is hard to determine the relative importance of the small molecular structures. Due to their very low sizes it is clear that we only see those which are very close to us and bright. At a distance three times larger than their actual value only the structure #1 (SAMS2) would have been detectable with the FCRAO telescope, however just in one single spectrum with very low intensity. So if the distance is indeed 100pc (see Paper 1), we can only see SAMS in a volume of 300pc radius with the currently available radiotelescopes. If SAMS are however a widespread phenomenon they should be easily seen even at larger distances once ALMA comes into operation.
The analysis of the relative importance of SAMS relies furthermore on the assumption that important physical or chemical parameters, as e.g. the CO abundance or the kinetic temperature, are similar to that found for larger molecular clouds; an assumption which not necessarily needs to be true. As discussed in Sec. 3.2 we possibly overestimate the CO abundance and thus underestimate the masses and column densities of SAMS. Dirsch et al. (dirsch:etal2003 (2003), dirsch:etal2005 (2005)) recently reported the detection of a tiny dust cloud of 4′′ diameter seen in projection towards the spiral galaxy NGC 3269. They derive a maximum absorption through the cloud of mag. If this dust cloud is also associated with molecular gas it could turn out to be the first optically detected SAMS. In that case a more reliable value of the column density and mass could be derived which is significantly higher than that estimated for the SAMS in this paper.
Averaged over the whole 20′ by 20′ area the CO line has an integrated line strength of K km s-1. The CO clouds thus account for a molecular hydrogen column density of cm-2; here the lower value is calculated adopting optically thin emission and a Galactic CO abundance and the upper value adopting a Galactic factor (see Sec. 3.2). The HI column density of the same area already given in Paper 1 is cm-2. That means that only 0.06-0.8 percent of the total gas in that area are in form of molecular gas if the assumptions made are correct.
5 Conclusions
The deep observations presented in this paper have more than doubled the number of known SAMS. As already discussed in Paper 1 their velocities are all within the same velocity range as the local HI clouds towards that direction of the sky. They therefore are probably a natural constituent of the interstellar medium, however not recognized as such due to their small angular sizes and low intensities. While on smallest angular scales the molecular gas of SAMS dominates the total amount of the interstellar gas in the corresponding velocity range (as shown in Paper 2) on larger scales they form possibly only a minor fraction. This result relies however on the assumption that SAMS are made of ordinary interstellar matter. If they are made of pristine material, only slightly enriched with metalls, SAMS could be more massive, because we overestimate the CO abundance significantly (see Sect. 4.2). In this case they could even be virialized, making them more massive, similar to the clumpuscules proposed by Pfenniger & Combes (pfenniger:combes1994 (1994)). Consequently, they would also contribute more mass to the interstellar medium. Only direct observation of H2 lines, e.g. in absorption to distant stars or quasars, could help to solve this issue.
The detection of Galactic H2 in an HI high-velocity cloud let Richter et al. (richter:etal1999 (1999)) conclude that the cloud may be dissolving. H2 clouds have now been seen towards many extragalactic lines of sight (see Richter et al. 2003a , 2003b , Shull et al. shull:etal2000 (2000)). Some of these clouds have similar physical properties, i.e. high densities and small sizes, as the CO clouds dicussed here. The high detection rate suggests that these are not all in the state of dissolution, but rather that there is a steady process of formation and destruction of H2 clouds in the ISM. Because with respect to fractal index and size-linewidth relation SAMS are similar to larger molecular clouds, the observations presented here and in the previous papers also suggest that the structural properties of molecular clouds are imprinted in right in the beginning of their formation process. High-angular resolution HI data, to compare with the CO data, are necessary to shed further light on this issue. Such data are currently being reduced and will be presented in a forth-coming paper.
Acknowledgements.
I thank Arancha Castro-Carrizo (IRAM) for her help during the data reduction of the PdB data and Philipp Richter for comments on the manuscript. This paper is based on observations with the Five College Radio Astronomical Observatory (FCRAO) and the IRAM Plateau-de-Bure interferometer. IRAM is supported by INSU/CNRS (France), MPG (Germany), and IGN (Spain).References
- (1) Bensch, F., Pak, I., Wouterloot, J.G.A., Klapper, G., Winnewisser, G., 2001, ApJ 562, L185
- (2) de Paolis, F., Ingrosso, G. Jetzer, P., Roncadelli, M., 1995, A&A 299, 647
- (3) Dirsch, B., Richtler, T., Robinson, L., 2003, A&A 408, 929
- (4) Dirsch, B., Richtler, T., Gomez, M., 2005, AJ 130, 1141
- (5) Falgarone, E., Panis, J.-F., Heithausen,A., et al., 1998, A&A 331, 669
- (6) Gerhard O., Silk J., 1996, ApJ 472, 34
- (7) Heithausen A., 1996, A&A 314, 251
- (8) Heithausen A., 2002, A&A 393, L41 (Paper 1)
- (9) Heithausen A., 2004, ApJ 606, L13 (Paper 2)
- (10) Hunter, S.D., et al., ApJ 481, 205
- (11) Jenkins, E.B., Bowen, D.V., Tripp, T.M., et al., 2003, AJ 125, 2824
- (12) Larson, R.B., 1981, MNRAS 194, 809
- (13) Pfenniger D., Combes F., 1994, A&A 285, 94
- (14) Richter P., de Boer, K.S., Widmann, H., et al., 1999, Nature 402, 386
- (15) Richter P., Sembach K.R., Howk, J.C., 2003a, A&A 405, 1013
- (16) Richter, P., Wakker, B.P., Savage, B.D., Sembach, K.R., 2003b, ApJ 586, 230
- (17) Shull, J.M., Tumlinson, J., Jenkins, E.B., et al., 2000, ApJ 538, L73
- (18) Sutton, E.C., Peng, R., Danchi, W.C., Jaminet, P.A., Sandell. G, Russell, A.P.G., 1995, ApJS 97, 455
- (19) van Dishoeck E.F., Black J., 1988, ApJ 334, 771
- (20) Walker M., Wardle M., 1998, ApJ 498, L125