-
The Group Evolution Multiwavelength Study (GEMS): the Sample and Datasets
Abstract: Galaxy groups have been under-studied relative to their richer counterparts – clusters. The Group Evolution Multiwavelength Study (GEMS) aims to redress some the balance. Here we describe the GEMS sample selection and resulting sample of 60 nearby (distance 130 Mpc) galaxy groups and our multiwavelength dataset of X-ray, optical and HI imaging. ROSAT X-ray images of each group are presented. GEMS also utilizes near-infrared imaging from the 2MASS survey and optical spectra from the 6dFGS. These observational data are complemented by mock group catalogues generated from the latest CDM simulations with gas physics included. Existing GEMS publications are briefly highlighted as are future publication plans.
Keywords: surveys: groups — galaxies: evolution — galaxies: formation — galaxies: groups
1 Introduction
The degree to which initial formation and environmental influences determine galaxy properties today is similar to the ‘Nature vs Nurture’ debate. Like the biological debate, this issue is an ongoing and fundamental one for contemporary astrophysics. In addition to the environment having a role in galaxy evolution, the galaxies themselves also influence their local environment through expelled gas, high-energy particles and radiation outflows. This may in turn feedback into the subsequent evolution of galaxies within that environment.
Quantifying the importance of this complex interplay between galaxies and
their environment requires the detailed tracking of galaxy
properties over a broad range of environment and look-back
time. In terms of environment, there are three broad regimes
based on the spatial density of galaxies: rich clusters, groups
and the low-density ‘field’. At the highest densities, rich
clusters contain hundreds, even thousands, of galaxies within a
few cubic megaparsecs. In contrast, field galaxies are relatively
isolated galaxies whose nearest L∗ neighbours can be many megaparsecs
away. Galaxy groups represent an environment that is
intermediate between these two extremes, containing a
few tens of galaxies within a cubic megaparsec. Despite the
meagre size of their populations, groups are vital to obtaining a
complete understanding of galaxy evolution and environmental
processes for the following reasons:
-
•
Groups are the most common galaxy environment: approximately 70% of galaxies in the local universe are located in groups (Tully 1987).
-
•
Groups are the building blocks of bigger structures: in the hierarchical clustering scenario, groups are the fundamental building blocks of galaxy clusters. Hence the evolution of galaxies in groups is highly relevant to the early evolution of rich cluster galaxies (e.g. Bekki 1999; Solanes et al. 1999; Moss & Whittle 2000).
-
•
Groups are the most favoured environment for galaxy mergers: the best chance of observing galaxy mergers and interactions is in groups because of the low relative velocities between galaxies; Mamon (2000) recently concluded that the merger rate is 100 higher in groups than in rich clusters. Groups are therefore the very best laboratory for studying the merger process, which is known to be the most effective in transforming galaxies morphologically (e.g. Toomre & Toomre 1972).
-
•
Groups contain a significant fraction of the hot gas in the universe: the total amount of hot gas in groups is comparable to that in clusters and therefore provides a significant contributor to the baryonic component of the universe (Fukugita et al. 1998). Groups provide an unprecedented opportunity to study the nature and origin of this important mass component and the intimate link it has with galaxies and their evolution.
-
•
Star formation is suppressed on group scales: large surveys, such as the 2dFGRS (Lewis et al. 2002) have revealed that star formation is suppressed at projected densities greater than 1–2 galaxies Mpc-2. Such densities are associated with groups. The physical mechanism for this ‘pre-processing’ of galaxies in groups is currently not well understood (e.g. Fujita 2003; Bower & Balogh 2003).
-
•
A group is our local environment: our Galaxy, the Milky Way, lives in a small loose group containing several dozen galaxies. A comprehensive understanding of galaxy groups in general will provide insight into our own Local Group.
Clusters arise from high density pertubations. The early-type galaxies in clusters formed most of their stars at very early epochs, i.e. (e.g. Bower, Lucey & Ellis 1992; Kelson et al. 1997; Jorgensen et al. 1999; van Dokkum et al. 2000; Terlevich & Forbes 2002; Tanaka et al. 2005). Galaxy groups, on the other hand, are seeded by much lower density perturbations in a hierarchical Universe. They range from early-collapsed systems (‘fossil groups’) to overdensities only slightly greater than the ‘field’. Star formation tends to be more extended in group galaxies (Terlevich & Forbes 2002). Hence nearby groups offer the opportunity to study galaxy evolution and star formation histories in systems of different dynamical states. In addition, their proximity means that they are easily accessible with existing telescopes at different wavelengths.
Previous studies of galaxy groups have included those focusing on Hickson Compact Groups, e.g. the optical study by Hunsberger, Charlton & Zaritsky (1998), the X-ray study of Ponman et al. (1996) and the HI survey by Verdes-Montenegro et al. (2001). On the slightly scale, we have Poor (less than a dozen members), but relatively compact, groups have also attracted some attention, e.g. Tovmassian, Plionis & Andernach (2004); Plionis, Basilakos & Tovmassian (2004). Most studies of large loose groups have been restricted to small samples, perhaps due to the large areal coverage on the sky required. Wide area optical surveys have been conducted by Ferguson & Sandage (1991) of 5 groups and Trentham & Tully (2002) of 4 groups. Dedicated HI mapping of loose groups have been very few in number. Perhaps the largest is Maia, Willmer & da Costa (1998) who observed 73 (mostly loose) groups but without uniform coverage. The HIPASS HI survey of the southern sky contains around one hundred HI-detected groups (Stevens 2005). X-ray studies have included similar numbers of loose groups, e.g. Mulchaey et al. (2000), Mahdavi et al. (2000) and Helsdon et al. (2001).
However, most of these studies have tended to focus on a single wavelength. A notable exception is the optical and X-ray study of groups by Mulchaey & Zabludoff (1998) and Zabludoff & Mulchaey (1998), who studied 3 compact and 9 loose groups. Their groups were selected optically to be poor groups with less than 5 large galaxies. Nine of their groups were found to have extended X-ray emission, the remaining 3 were undetected in the X-ray. They found the 9 groups with intragroup X-ray emission to be bound systems with many members (even the compact groups). These bound groups appear to share a common, massive halo as opposed to possessing individual dark matter halos. This may explain why the galaxies in these groups have not yet all merged together. They also found bright elliptical galaxies at the centres of these groups, similar to those seen in clusters, and fractions of early-type galaxies approaching those in clusters. In contrast the 3 groups undetected in X-rays were found to contain no early-type galaxies and have spiral galaxies at their centre. They also found that, in terms of their optical (velocity dispersion) and X-ray (X-ray luminosity and temperature) properties, groups are equivalent to scaled-down clusters.
The physical nature of groups, evolutionary connection between different types of groups and the effect of the group environment on galaxies is not well understood. To fully understand any astrophysical problem it is important to adopt a multi-wavelength approach. This is particularly true for galaxy groups for which we expect large energetic and gas phase changes as a group evolves.
To overcome these limitations we created the Group Evolution Multiwavelength Study (GEMS) which is a survey of 60 nearby loose and compact galaxy groups. Here we describe the sample selection, the existing and planned data sets, and an overview of group properties. The GEMS collaboration involves researchers predominately from Swinburne University, Australia and Birmingham University, UK, but includes others from many astronomical institutions world-wide. Further details can be obtained from our public web pages at http://www.sr.bham.ac.uk/gems/.
2 Sample Selection
The GEMS sample is based on optically-defined groups which have deep ROSAT X-ray data available. The presence of hot intragroup gas indicates that the group is real (rather than merely a projection on the sky and that it is a bound system). The X-ray luminosity gives a measure of the virialisation of the group’s potential well and hence its evolutionary state.
The groups of galaxies were initially selected from a master group catalogue consisting of 4,320 optically-defined groups (e.g. Garcia 1993; Tully 1987). This master group list was compared to the ROSAT satellite pointed observations, and all groups with a ROSAT PSPC pointing within 20 arcmin of the group position were extracted. We further required that the ROSAT observation must be greater than 10,000 s (sufficient for detailed X–ray analysis), and that the recession velocity of the group must lie between 1000 km s 3000 km s-1. This left a list of groups which should neither be too close so as to fill the ROSAT field of view, nor too distant for detailed analysis. After excluding a small number of groups that are likely subclumps of the Hydra and Virgo clusters, this left 45 groups. To this we added 13 groups from Helsdon & Ponman (2000), and two Hickson Compact Groups (HCG 4 and HCG 40) all with ROSAT PSPC imaging. Further details can be found in Osmond & Ponman (2004).
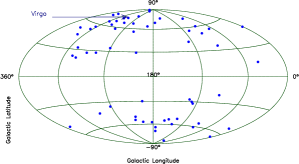
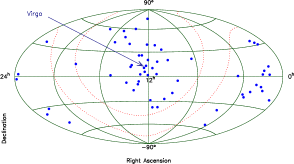
So although not a statistically-complete sample, the 60 groups have a large range in properties such as X-ray luminosity, dynamical state, velocity dispersion, richness and constituent galaxy types, making them a representative sample of nearby galaxy groups and the largest multiwavelength sample to date. They cover the whole sky. The sample includes both loose and compact groups, thus we are in a position to test possible evolutionary connections between the two types of groups.
The distribution of the GEMS groups on the sky, in galactic coordinates, is shown in Fig. 1. As can be seen in the figure, the GEMS groups were chosen to lie at from the Galactic plane.
3 A Multiwavelength Data Set
GEMS uses public catalogues/archive data as well as new dedicated
observations. The main datasets are:
X-ray imaging. All 60
groups have deep ( 10,000s) ROSAT PSPC images available. The
ROSAT data, overlaid on DSS images, are shown in Figures
7–11. After taking into point sources, 37 groups reveal extended
X-ray emission associated with an intragroup medium (called G),
15 groups have non extended X-ray emission that we associate with
the galaxy halo (H) and 8 groups have X-ray
emission that is times the background and are
classified as undetected (U). This diversity of X-ray properties
can be seen in Figures 6–10. For further details
see Osmond & Ponman (2004). The ROSAT data are
complemented by ever increasing coverage from the XMM-Newton and
Chandra X-ray satellites (see Table 1), which have increased
sensitivity and/or spatial resolution.
HI Mapping. We have carried out wide area (5.5 5.5 sq. degrees) HI mapping with the Parkes radio telescope for 16 GEMS groups (see Table 1). Thus we sample out to radii of a few Mpc or several virial radii. The telescope was scanned across each group in a grid pattern for a total of 16–20 hours. The resulting velocity resolution is 2 km s-1 (about 10 better than HIPASS) and a mass limit in the range 4–10 108M⊙ (about 2 better than HIPASS). The bandwidth is 8 MHz with 1024 spectral channels. The final beam size is 15.5 arcmins. Source selection is quantified using fake sources injected into the datacubes and their recovery rate measured.
A small number of Parkes sources have also been observed on the
Australia Telescope Compact Array. These are generally
sources that are ‘confused’ in the large Parkes beam
or new group members (see Kilborn et al. 2005b for details).
Optical imaging. Wide field imaging cameras have been used to image the central 0.5 sq. degrees of 29 groups in B,R,I filters. The data come from the 2.5m INT, Canary Islands (17 groups), the 2.2m ESO/MPI telescope, Chile (8 groups) and the 3.9m AAT, Australia (4 groups). Seeing was around 1 arcsec. Galaxy selection was carried out using the Sextractor routine. The data reach to absolute magnitudes (assuming group membership) of MB –13. For further details see Miles et al. (2004).
Near-infrared imaging. Image parameters and J,H,K magnitudes
are available for all GEMS group galaxies with K 13.1 from
the 2MASS survey (Jarrett et al. 2000). These near-infrared
magnitudes provide a good (photometric) tracer of galaxy mass,
and are used in GEMS to calculate luminosity-weighted group
centroid positions and analyse group properties
(see Brough et al. 2005 for details).
Recession velocities. Confirmed group membership
requires a recession velocity from either optical spectra or HI
observations. We complement the existing databases (such as NED
and Hyperleda) with our own new HI velocities and those from the
6dFGS (Jones et al. 2004) for some southern groups. More
velocities will become available after the third and final 6dFGS
data release. The SDSS survey will confirm group membership for
many northern groups. Such velocities are being used to derive
group properties such as velocity dispersions and hence probe
group dynamics (e.g. Brough et al. 2005) and can be used to test
whether HCGs are merely the dense cores of larger loose groups.
4 Mock Catalogues
Sample selection is one aspect of the study of galaxy groups that has significantly hindered progress. A large, well-selected sample has simply been lacking. This is partly due to the difficulty of defining galaxy groups in an objective way from galaxy positions alone (see Eke et al. 2004) combined with the difficulty of detecting X-ray emission from groups of (e.g. Osmond & Ponman 2004). To circumvent these problems and test our group selection procedure we use modern simulations.

4.1 Dark matter and stellar content
Our mock Universe is based on the volume of the Millennium simulation (Springel et al. 2005). With over particles each of mass this model resolves halos containing typical galaxy groups with over 10,000 particles. There are over 50,000 halos of group or larger size within the simulation volume, allowing detailed statistics of the halo properties to be extracted.
Within the framework of the Millennium simulation we have access to the mock catalogues of both Croton et al. (2005) and Bower et al. (2005). Both these mock catalogues include AGN feedback and successfully reproduce the break in the galaxy luminosity function.
4.2 Gas properties
The volume of the Millennium simulation has also been modelled at lower resolution but including hydrodynamics. Although this lower resolution is insufficient for a full treatment of the gaseous phase of galaxies it is sufficient to resolve the hot halos and produce reliable X-ray luminosities and gas temperatures. We have two runs, one without gas cooling (which produces halos that are far too bright in X-rays) and a run with preheating that has been tuned to reproduce both the observed X-ray luminosity–temperature relation and the mass–temperature relation. These models accurately reproduce the halo distribution of the higher resolution Millennium simulation.
With this set of models we can inter-compare galaxy, dark matter and gas properties for a volume limited sample of halos. We can also examine the evolution of any desired halo or set of halos, as both the dark matter and galaxy catalogues have 64 output redshifts, a number increased further still to 160 in the gas models.
As an example of what is available, we have extracted the 1D dark matter velocity dispersion within the virial radius of all the haloes with . In Fig. 3 we compare this to the 3D (black points) and 1D (red points) velocity dispersion for all galaxies with within these halos. At low velocity dispersion (small groups), the 1D line-of-sight measurement becomes a less reliable indicator of the true group velocity dispersion.
Figure 4 displays the same information but this time only the median , 10th and 90th percentile values are shown. For small haloes there is a slight tendency for the galaxies to have a lower than expected velocity dispersion, due to the fact that the semi-analytic galaxy is always the most-bound particle of its parent halo. No correction is made for the small numbers of galaxies or the fact that the central galaxy is assumed to be at rest with respect to the group. Due to the fact that we have over 50,000 clusters and 150,000 independent measures of the velocity dispersion our sample contains several hundred groups with derived velocity dispersions below . If we solely used the galaxy velocity dispersion to derive the size of these groups we would arrive at far too small a number. The sharp drop seen in Fig. 3 is mainly driven because we have deliberately chosen to cut off our sample at so that there are suddenly no smaller groups in our sample. Something like this effect also occurs observationally: below a certain size, groups are not identified because they only contain a single galaxy. Slightly above this threshold the recovered velocity dispersion is, on average, 6% too high: this is simply because there are more smaller groups than larger ones, so more groups scatter up than down. In summary, velocity dispersion measures for low mass groups become increasingly unreliable with a tendency to underestimate the group velocity dispersion (and hence underestimate group mass).
4.3 Galaxy counts
The number of galaxies above a specified brightness (in this case ) is well correlated with the halo velocity dispersion (Fig. 5). The GEMS group sample of Osmond & Ponman (2004) spans the model results and extends them to lower velocity dispersions. Many of the lower mass GEMS groups may not be virialised systems. The galaxy density (for galaxies brighter than ) is stable at a value of around 45 galaxies per although the scatter increases dramatically as the velocity dispersion of the halo drops (Fig. 6). Again the Osmond & Ponman groups span the model range, with no trend for a large systematic increase in galaxy density as the velocity dispersion is lowered; such a trend would be a clear indication that the size of the groups (and hence masses) had been systematically underestimated. This is not a problem for the GEMS groups, as discussed in Osmond & Ponman (2004), section 6.
5 Group Properties
We summarise some basic properties of the 60 GEMS groups in Table 1. The group name is generally the brightest central galaxy or Hickson Compact Group number. The position corresponds to the centrally located galaxy or that listed in the optical group catalog (see Osmond & Ponman (2004)). The distance is calculated from a Virgo-infall corrected velocity and assuming H0 = 70 km/s/Mpc (this Hubble constant is used in all GEMS papers). The r500 radius is a measure of the extent of each group. It is defined as the radius for which the density is 500 the critical density of the Universe. For groups, this quantity is more reliably obtained than the commonly used r200 or virial radius (r500 2/3 r200) in clusters. It is calculated based on the simulations of Evrard et al. (1996) using the measured X-ray temperature, TX (for those groups without X-ray temperatures, it is calculated from the summed B-band luminosity (LB) of all galaxies in the group). The r500 values listed here have been updated from Osmond & Ponman (2004) so that for groups with galaxy halo emission the radius is now calculated based on LB (rather than TX). The measured X-ray luminosity and upper limits are from Osmond & Ponman (2004). Whether this X-ray emission comes from intragroup emission (G), galaxy halo emission (H) or is undetected in X-rays (U) is listed. The current existing datasets for each group are given by the codes: O = optical imaging, P = Parkes HI mapping, C = Chandra X-ray imaging, X = XMM X-ray imaging.
| Group | R.A. | Dec. | Distance | r500 | LX | X-ray | Datasets |
|---|---|---|---|---|---|---|---|
| Name | (J2000) | (J2000) | (Mpc) | (Mpc) | (erg/s) | class | |
| HCG 4 | 00 34 13.8 | -21 26 21 | 115 | 0.36∗ | 41.48 0.19 | G | C,X |
| NGC 315 | 00 57 48.9 | +30 21 09 | 72 | 0.55 | 41.21 0.10 | G | C |
| NGC 383 | 01 07 24.9 | +32 24 45 | 73 | 0.69 | 43.07 0.01 | G | C |
| NGC 524 | 01 24 47.8 | +09 32 19 | 35 | 0.42 | 41.05 0.05 | H | P,O |
| NGC 533 | 01 25 31.3 | +01 45 33 | 76 | 0.58 | 42.67 0.03 | G | C,X |
| HCG 10 | 01 25 40.4 | +34 42 48 | 68 | 0.24 | 41.70 0.14 | G | O |
| NGC 720 | 01 53 00.4 | -13 44 18 | 23 | 0.40 | 41.20 0.02 | G | P,O,C,X |
| NGC 741 | 01 56 21.0 | +05 37 44 | 79 | 0.62 | 42.44 0.06 | G | C |
| HCG 15 | 02 07 37.5 | +02 10 50 | 95 | 0.54 | 42.12 0.05 | G | X |
| HCG 16 | 02 09 24.7 | -10 08 11 | 57 | 0.32 | 41.30 0.11 | G | C,X |
| NGC 1052 | 02 41 04.8 | -08 15 21 | 20 | 0.24 | 40.08 0.15 | H | P,O,C,X |
| HCG 22 | 03 03 31.0 | -15 41 10 | 39 | 0.29 | 40.68 0.13 | G | O |
| NGC 1332 | 03 26 17.1 | -21 20 05 | 23 | 0.25 | 40.81 0.02 | H | P,O,C |
| NGC 1407 | 03 40 11.8 | -18 34 48 | 26 | 0.57 | 41.69 0.02 | G | P,O,C |
| NGC 1566 | 04 20 00.6 | -54 56 17 | 21 | 0.53 | 40.41 0.05 | H | P,O |
| NGC 1587 | 04 30 39.9 | +00 39 43 | 55 | 0.55 | 41.18 0.09 | G | C |
| NGC 1808 | 05 07 42.3 | -37 30 46 | 17 | 0.32∗ | 40.10 | U | P,O,C,X |
| NGC 2563 | 08 20 35.7 | +21 04 04 | 73 | 0.57 | 42.50 0.03 | G | O,X |
| HCG 40 | 09 38 54.5 | -04 51 07 | 102 | 0.45∗ | 41.04 | U | – |
| HCG 42 | 10 00 14.2 | -19 38 03 | 64 | 0.48 | 41.99 0.02 | G | C,X |
| NGC 3227 | 10 23 30.6 | +19 51 54 | 27 | 0.35∗ | 41.23 0.05 | H | O,C,X |
| HCG 48 | 10 37 49.5 | -27 07 18 | 41 | 0.23∗ | 41.09 0.04 | G | – |
| NGC 3396 | 10 49 55.2 | +32 59 27 | 31 | 0.36 | 40.53 0.08 | H | O,C,X |
| NGC 3557 | 11 09 57.4 | -37 32 17 | 39 | 0.27 | 42.04 0.04 | G | P,O,C |
| NGC 3607 | 11 16 54.7 | +18 03 06 | 23 | 0.33 | 41.05 0.05 | G | O,X |
| NGC 3640 | 11 21 06.9 | +03 14 06 | 29 | 0.35∗ | 40.37 | U | O |
| NGC 3665 | 11 24 43.4 | +38 45 44 | 37 | 0.38 | 41.11 0.08 | G | O,C,X |
| NGC 3783 | 11 39 01.8 | -37 44 19 | 36 | 0.25∗ | 40.76 0.11 | G | P,O,C,X |
| HCG 58 | 11 42 23.7 | +10 15 51 | 98 | 0.51∗ | 41.33 | U | – |
| NGC 3923 | 11 51 02.1 | -28 48 23 | 22 | 0.36 | 40.98 0.02 | H | P,O,C,X |
| NGC 4065 | 12 04 06.2 | +20 14 06 | 106 | 0.62 | 42.64 0.05 | G | X |
| NGC 4073 | 12 04 27.0 | +01 53 48 | 96 | 0.69 | 43.41 0.02 | G | C,X |
| NGC 4151 | 12 10 32.6 | +39 24 21 | 23 | 0.29∗ | 40.20 | U | O,C,X |
| NGC 4193 | 12 13 53.6 | +13 10 22 | 39 | 0.39∗ | 40.63 0.08 | H | – |
| NGC 4261 | 12 19 23.2 | +05 49 31 | 41 | 0.64 | 41.92 0.03 | G | O,C,X |
| NGC 4325 | 12 23 06.7 | +10 37 16 | 117 | 0.51 | 43.15 0.01 | G | C,X |
| NGC 4589 | 12 21 45.0 | +75 18 43 | 29 | 0.43 | 41.61 0.05 | G | X |
| NGC 4565 | 12 36 20.8 | +25 59 16 | 27 | 0.49 | 40.44 0.14 | H | C,X |
| NGC 4636 | 12 42 50.4 | +02 41 24 | 10 | 0.51 | 41.49 0.02 | G | P,O,C,X |
| NGC 4697 | 12 48 35.7 | -05 48 03 | 20 | 0.39 | 41.01 0.02 | H | O,C,X |
| NGC 4725 | 12 50 26.6 | +25 30 06 | 25 | 0.43 | 40.63 0.06 | H | O,C,X |
| HCG 62 | 12 53 05.8 | -09 12 16 | 74 | 0.67 | 43.14 0.04 | G | C,X |
| NGC 5044 | 13 15 24.0 | -16 23 06 | 33 | 0.62 | 43.01 0.01 | G | P,O,C,X |
| NGC 5129 | 13 24 10.0 | +13 58 36 | 108 | 0.51 | 42.33 0.04 | G | X |
| NGC 5171 | 13 29 21.6 | +11 44 07 | 107 | 0.58 | 42.38 0.06 | G | C,X |
| HCG 67 | 13 49 11.4 | -07 13 28 | 115 | 0.46 | 42.02 0.07 | G | – |
| NGC 5322 | 13 49 15.5 | +60 11 28 | 35 | 0.42 | 40.71 0.10 | H | O,X |
| HCG 68 | 13 53 26.7 | +40 16 59 | 41 | 0.43 | 41.52 0.04 | G | X |
| NGC 5689 | 14 34 52.0 | +48 39 36 | 38 | 0.26∗ | 40.24 | U | X |
| NGC 5846 | 15 06 29.2 | +01 36 21 | 30 | 0.48 | 41.90 0.02 | G | O,C,X |
| NGC 5907 | 15 15 53.9 | +56 19 46 | 17 | 0.24∗ | 39.69 0.14 | H | X |
| NGC 5930 | 15 26 07.9 | +41 40 34 | 41 | 0.50 | 40.73 0.07 | H | – |
| NGC 6338 | 17 15 22.9 | +57 24 40 | 127 | 0.88∗ | 43.51 0.02 | G | C |
| NGC 6574 | 18 12 00.7 | +14 02 44 | 35 | 0.16∗ | 40.81 | U | |
| NGC 7144 | 21 52 42.9 | -48 15 16 | 27 | 0.30 | 40.33 0.13 | H | P,O |
| HCG 90 | 22 02 08.4 | -31 59 30 | 36 | 0.38 | 41.49 0.05 | G | P,O,C,X |
| HCG 92 | 22 35 58.4 | +33 57 57 | 88 | 0.47 | 41.99 0.04 | G | C,X |
| IC 1459 | 22 57 10.6 | -36 27 44 | 26 | 0.35 | 41.28 0.04 | G | P,O,C,X |
| NGC 7714 | 23 36 14.1 | +02 09 19 | 39 | 0.22∗ | 40.03 | U | P,X |
| HCG 97 | 23 47 22.9 | -02 18 02 | 92 | 0.51 | 42.37 0.05 | G | X |
aGroup name (generally the brightest central galaxy or HCG
number),
position of centrally located galaxy or
optical group catalog, distance from Virgo-infall corrected
velocity and assuming H0 = 70 km/s/Mpc, radius at 500
the critical density (∗ = uncertain radius), group X-ray class (G = intragroup emission, H =
galaxy halo emission, U = undetected in X-rays), O = optical, P =
Parkes, C = Chandra, X = XMM.
6 GEMS publications
Since the first presentation at the European National Astronomy
meeting (McKay et al. 2002),
there have been several GEMS publications:
Khosroshahi et al. (2004). An
analysis of galaxy surface brightness profiles in 16 groups,
which found galaxies in X-ray luminous groups to be in general
larger and more luminous than their counterparts in low X-ray
groups.
Osmond & Ponman (2004). An analysis of
the X-ray properties of the entire sample. X-ray luminosities to
a uniform group scale radius are derived. More recent fits to the
LX scaling relations (Ponman et al. 2006) indicate that the
X-ray properties of groups are consistent with being
scaled-down clusters. Various group optical
properties are found to be correlated to X-ray properties
(e.g. the spiral fraction with IGM X-ray temperature).
McKay et al. (2004). This paper reports the discovery
of two new galaxies, from Parkes HI mapping, in the NGC 1052 and
NGC 5044 groups. The two galaxies have HI masses of 0.5–1.0
109 M⊙ and faint optical counterparts.
Miles et al. (2004). Luminosity functions, in the B
and R bands, are presented for the central regions of 25
groups. A strong dip in the LF is seen around MB = –17 in the
low X-ray groups. This may be interpreted as a signature of
merging at intermediate galaxy mass scales in pre-virialised,
collapsing groups.
Kilborn et al. (2005a). This paper presents wide area
Parkes HI mapping of the low X-ray emission group NGC 1566. Of the 13 HI
detected galaxies, two were not known previously to be group
members. Several galaxies appear be HI deficient; the cause of which
is probably tidal interactions rather than ram pressure stripping.
Brough et al. (2005). The dynamics of the GEMS groups NGC 1407 and
NGC 1332 are studied, along with the Eridanus cloud. It is
suggested these groups form a bound ‘supergroup’ of 7
1013 M⊙ that is due to merge into a cluster.
Kilborn et al. (2005b). This paper presents wide area
Parkes HI mapping of the NGC 3783 group, which has some evidence
for a weak IGM. We find one HI ‘cloud’ (i.e. detected HI with no
optical counterpart to faint levels) of mass 109
M⊙. This cloud is likely to have a tidal origin.
7 Summary and Future Work
Groups are the preferred environment of galaxies for more than half of the age of the Universe. The GEMS project is an attempt to better quantify and understand the processes operating in nearby galaxy groups, building on the work of Zabludoff, Mulchaey and others from the 1990s. Our sample of 60 groups covers a range of group dynamical states. Our multiwavelength dataset and mock catalogues allow us to define the properties of these groups and better understand the physical processes operating. Our existing, and future, GEMS publications will provide a useful ‘local benchmark’ for groups found at moderate to high redshift in galaxy surveys such as the 2dFGRS, SDSS, DEEP2, 6dFGS.
Future work includes measuring the K-band galaxy luminosity function, a dynamical analysis of galaxy motions, high spatial resolution HI follow-up of selected galaxies, examination of the star formation rates via H fluxes and the origin of brightest group galaxies.
Acknowledgments
Thanks to ARC for funding aspects of this research and the telescope support staff at various observatories who helped collect the GEMS datasets. We thank the following for their help with aspects of GEMS: D. Barnes, P. Goudfrooij, S. Helsdon, H. Khosroshahi, B. Koribalski, N. McKay, P. Nulsen, R. Proctor.
References
- (1) Bekki, K. 1999 ApJL, 510, 15
- (2) Bower, R., Lucey, J., Ellis, R., 1992, MNRAS, 254, 601
- (3) Bower, R., Balogh, M., 2003, RMxAC, 17, 220
- (4) Bower, R., et al. 2005, astro-ph/0511338
- (5) Brough et al. 2005, MNRAS, submitted
- (6) Hunsberger, S., Charlton, J., Zaritsky, D., 1998, ApJ, 505, 536
- (7) Croton, et al. 2005, astro-ph/0508046
- (8) Eke, V., et al. 2004, MNRAS, 348, 866
- (9) Evrard, A., Metzler, C., Navarro, J., 1996, ApJ, 469, 494
- (10) Ferguson, H., Sandage, A., 1991, AJ, 101, 765
- (11) Fukugita, M., Hogan, C., Peebles, J., 1998, ApJ, 503, 518
- (12) Fujita, Y., 2003, astro-ph/0311193
- (13) Garcia, A., 1993, A&AS, 100, 47
- (14) Helsdon, S., Ponman, T., 2000, MNRAS, 319, 933
- (15) Helsdon, S., Ponman, T., O’Sullivan, E., Forbes, D., 2001, MNRAS, 325, 693
- (16) Jarrett, T., Chester, T., Cutri, R., Schneider, S., Skrutskie, M., Huchra, J., 2000, AJ, 119, 2498
- (17) Jones, D., et al. 2004, MNRAS, 355, 747
- (18) Jorgensen, I., et al. 1999, MNRAS, 308, 833
- (19) Kelson, D., et al. 1997, ApJL, 478, 13
- (20) Kilborn et al. 2005a, MNRAS, 356, 77
- (21) Kilborn et al. 2005b, MNRAS, submitted
- (22) Khosroshahi et al. 2004, MNRAS, 349, 527
- (23) Kilborn et al. 2005, MNRAS, 356, 77
- (24) Lewis, I., et al. 2002, MNRAS, 334, 673
- (25) Mahdavi, A., Bohringer, H., Geller, M., Ramella, M., 2000, ApJ, 534, 114
- (26) Maia M.A.G., Willmer C.N.A., da Costa L.N., 1998, AJ, 115, 49
- (27) Mamon, G., 2000, In “Dynamics of Galaxies: from the Early Universe to the Present”, Ed. Francoise Combes, Gary A. Mamon, and Vassilis Charmandaris, ASP Conference Series, p. 377
- (28) McKay et al. 2004, MNRAS, 352, 1121
- (29) Meurer, G., 2003, astro-ph/0311184
- (30) Miles et al. 2004, MNRAS, 355, 785
- (31) Moss, C. & Whittle, M. 2000, MNRAS, 317, 667
- (32) Mulchaey, J., 2000, ARAA, 38, 289
- (33) Mulchaey, J., Zabludoff, A., 1998, ApJ, 496, 73
- (34) Osmond, J., Ponman, T., 2004, MNRAS, 350, 1511
- (35) Plionis, M., Basilakos, S., Tovmassian, H., 2004, MNRAS, 352, 1323
- (36) Ponman, T., Bourner, P., Ebeling, H., Bohringer, H., 1996, MNRAS, 283, 690
- (37) Ponman et al. 2006, MNRAS, in prep.
- (38) Solanes, J.M., Salvador-Solé, E. & González-Casado, G., 1999, A&A, 343, 733
- (39) Springel, V., et al. 2005, Nature, 435, 629
- (40) Steven, J., 2005, PhD Thesis, University of Melbourne
- (41) Tanaka, M., et al. 2005, MNRAS, in press
- (42) Terlevich, A., Forbes, D., 2002, MNRAS, 330, 547
- (43) Toomre, A., Toomre, J., 1972, ApJ, 178, 623
- (44) Tovmassian, H., Plionis, M., Andernach, H., 2004, ApJL, 617, 111
- (45) Trentham, N., Tully, R., 2002, MNRAS, 335, 712
- (46) Tully, R. B., 1987, ApJ, 321, 280
- (47) van Dokkum, P., et al. 2000, ApJ, 541, 95
- (48) Verdes-Montenegro, L., Yun, M., Williams, B., Huchtmeier, W., Del Olmo, A., Perea, J., 2001, A&A, 377, 812
- (49) Zabludoff, A., Mulchaey, J., 1998, ApJ, 496, 39