0 \SetFirstPage1 \SetYear2006 \ReceivedDate000 \AcceptedDate000
revised diagnostic diagrams for planetary nebulae
Se presentan diagramas de diagnóstico de densidad electrónica – excitación para una muestra de 613 nebulosas planetarias. En base a esta extensa muestra se definen nuevos límites estadísticos para la distribución de nebulosas planetarias en los planos log [H/[S ii]] vs log [H/[N ii]], log [H/[S ii]] vs [S ii] 6717/6731 y log [H/[N ii]] vs [S ii] 6717/6731. Los diagramas proveen una buena representación de los intervalos de condiciones físicas, indicados por estos cocientes de líneas de emisión, presentes en nebulosas planetarias en diferentes estados de evolución.
Abstract
Diagnostic diagrams of electron density – excitation for a sample of 613 planetary nebulae are presented. The present extensive sample allows the definition of new statistical limits for the distribution of planetary nebulae in the log [H/[S ii]] vs log [H/[N ii]], log [H/[S ii]] vs [S ii] 6717/6731 and log [H/[N ii]] vs [S ii] 6717/6731 planes. The diagrams provide a good representation of the ranges of physical conditions, indicated by these emission line ratios, present in planetary nebulae during different evolutionary stages.
keywords:
ISM, Planetary Nebulae0.1 Introduction
Plots of emission line ratios provide useful diagnostics of the physical conditions and identification of classes of ionized gaseous nebulae. Electron density – excitation diagrams were introduced by Sabbadin, Minello and Bianchini (1977), SMB77 hereafter, with the specific purpose of clarifying the nature of the nebula S 176. These diagrams compare the relative line intensities of the H/[N ii], [S ii] 6717/6731 and H/[S ii] ratios observed in supernova remnants, planetary nebulae (PNe) and H II regions. These nebulae are expected to occupy distinct regions in these diagrams as a consequence of the different physical processes operating within them. For example, supernova remnants are mainly shock excited nebulae where low H/[N ii] and H/[S ii] ratios are expected across a range of electron densities. H II regions are photoionized nebulae that show a restricted range of excitation conditions and electron densities in their generally diluted environments. Meanwhile, planetary nebulae show a wide range of excitation conditions and electron densities depending upon their evolutionary stage, the possible presence of collimated outflows and shocks and the progenitor mass that may influence the observed H/[N ii] ratio.
Recently, Phillips (2004) has discussed the distribution and significance of other relevant emission line ratios in PNe. Emission line ratio plots have also been used to distinguish planetary from symbiotic nebulae (e.g. Gutiérrez Moreno, Moreno & Cortéz, 1995). The SMB77 diagrams have proven to be a useful diagnostic tool for PNe and have been used widely in a number of works (e.g. Barral et al. 1982; López and Meaburn 1983; García Lario et al. 1991; Tajitsu et al. 1999). In the case of PNe the data in these diagrams often fall outside the original boundaries fit by SMB77, most likley as a consquence of the limited sample available then to set the diagram limits. The information used originally by SMB77 to define the parameter space for the PNe was obtained from the limited compilation made by Kaler (1976), where relative emission line intensities observed in planetary and diffuse nebulae are listed from different sources. The estimated available number of PNe in that catalogue with the required information is of only about 40 objects. The information for H II regions in SMB77 was also obtained from that same source, whereas the data for Supernova remnants from Daltabuit et al. (1976), Sabbadin and D’Odorico (1976) and Dopita (1976).
Here we have taken advantage of line intensities listed in the Strasbourg Catalogue of Galactic Planetary Nebulae, part II, SCGPN II hereafter, (Acker et al. 1992) to explore the empirical location of PNe in the SMB77 diagrams, but now based upon a much larger and homogeneous sample.
0.2 The Sample
In order to update the parameter intervals of the log [H/[N ii]], [S ii] 6717/6731 and log [H/[S ii]] line ratios for PNe, we have compiled a database with 613 objects from the SCGPN II that provide the line intensities required in the diagrams.
The H/[N ii] ratio involves both [N II] lines, namely , whereas the SCGPN II provides only data for the stronger line. We have included the contribution from the line by assuming a typical ratio .
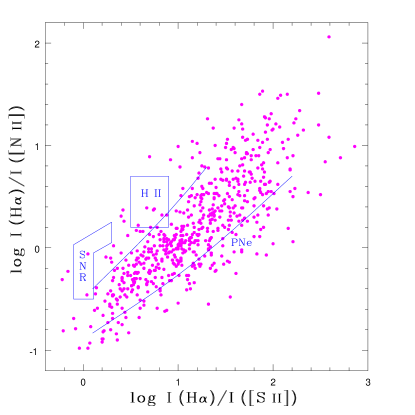
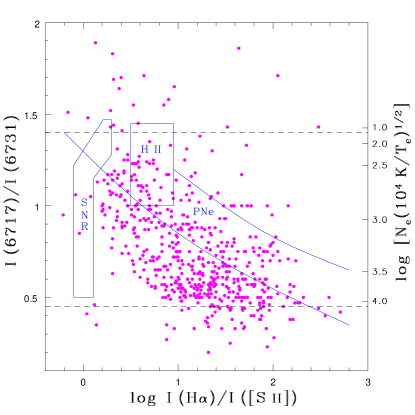
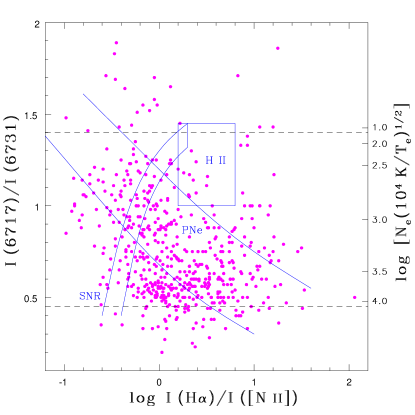
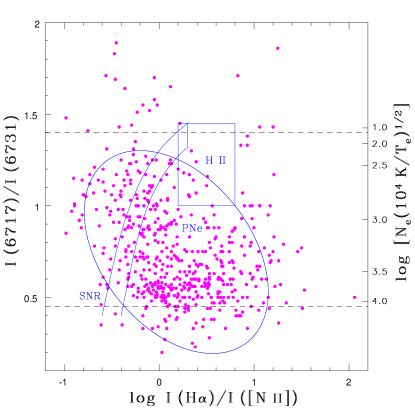
Figures 1, 2 and 3 show the distribution of the present dataset compared with the original zones for PNe, H II Regions and SNR as proposed by SMB77. The present sample requires an expansion of the original axes limits. Figure 1 shows the log [H/[S ii]] vs log [H/[N ii]] intensity ratios; Figure 2 the log [H/[S ii]] vs [S ii] 6717/6731 ratios and Figure 3 the log [H/[N ii]] vs [S ii] 6717/6731 ratios. In Figures 2 and 3 we have added dashed horizontal lines that indicate the range for which the [S ii] intensity ratio is a reliable indicator of the electron density (Osterbrok 1974). The corresponding electron density scales are included on the right axes of these figures. Figure 1 and 4 contain the 613 objects in our sample; Figures 2 and 3 and 5 and 6, that involve the [S ii] 6717/6731 ratio contain only 550 objects for there were 52 objects with only one [S II] line listed in the SCGPN II which precluded obtaining the [S ii] line ratio. Likewise, eleven other objects were also discarded in those diagrams for having an unlikely large [S ii] 6717/6731 2.

0.3 Discussion
It is clear from Figures 1 – 3 that the limits and zones defined for PNe in the original sample used by SMB77 fall short of covering substantial data regions in these diagrams. The present extended sample from the SCGPN II expands the previous location of PNe in the diagrams, providing a more accurate representation of their zones of influence.
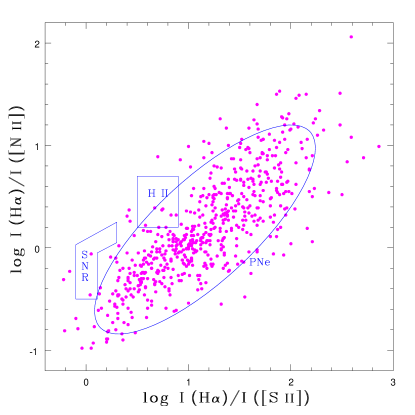
New statistical limits therefore have now been set to represent the location of PNe in the SMB77 diagrams by means of density ellipsoid probabilities. Figures 4, 5 and 6 show the new zones defined by ellipses of probablity 0.85 for the corresponding emission line ratios for PNe. The ellipse in the diagrams represents both the density contour and confidence region of finding an object within this zone with an 85 % confidence level. The density ellipse is also a good graphical indicator of the correlation between the two variables involved. The ellipse collapses across its minor axis, i.e., becomes thinner, as the correlation betwen the two variables increases and approaches unity () and expands or reduces its eccentricity as the correlation weakens. The density ellipses in Figures 4, 5 & 6 have all been set for a 0.85 probabilty, however the correlation coefficients differ among them, with values of 0.79, -0.58 and -0.37, respectively. Thus, the correlation between log [H/[S ii]] vs log [H/[N ii]] is strongest whereas that between log [H/[N ii]] vs [S ii] 6717/6731 is weakest. The correlation is related to the scatter of the points in the diagrams and this scatter is a combination of real dispersion due to different physical conditions, as those expected from different evolutionary stages of a planetary nebula, different conditions within a nebula (e.g. core, rim or halo) and in some cases, also probable observational uncertainties or measuring errors from the spectroscopic SCGPN II survey. Phillips (2004) has discussed a number of factors that potentially affect such samples, such as the aperture (slit) size and its location over the nebula.
The samples for each diagram follow the trends apparent in the original SMB77 diagrams, though now they cover zones where the concentration and correlation of the line ratios provide a much closer representation of the true location of PNe in these diagnostic diagrams. For example, the ellipses in Figures 5 and 6 show a clear tendency towards larger electron density values as compared to the corresponding original areas indicated in Figures 3 and 4. These values are in good accord with the electron densities derived from other, smaller, samples such as in Stanghellini and Kaler (1989).
The diagrams provide direct and useful information on general physical conditions in PNe. For example, diluted shells with low electron density and low to moderate excitation conditions, e.g. log [H/[S ii]] (see Fig. 5) will overlap the location of H II regions. These objects are likely large, evolved PNe. The likely presence of shock contributions in the dominantly photoionized environment of PNe is hinted by objects located in Fig. 4 in the log [H/[N ii]] and log [H/[S ii]] region. Objects with high electron density and high H emissivity in Figs. 5 and 6 point towards compact, young PNe. For PNe for which limited information is available, their location on the diagrams usually provides insight into their general (or peculiar) characteristics and evolutionary stage.
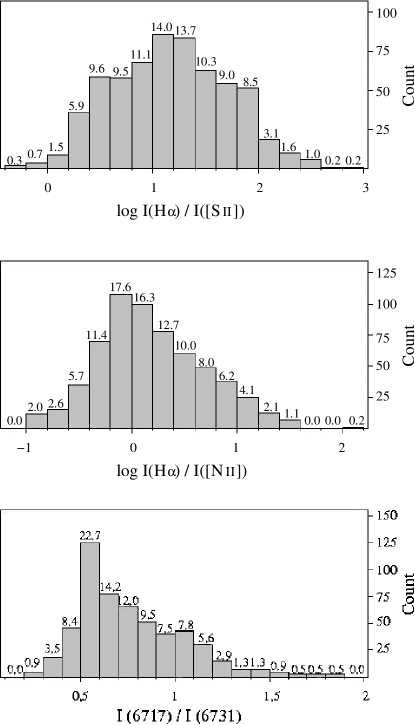
Figure 7 shows the histograms of the distribution of values for the corresponding line ratios. The numbers at the top of each bar indicate the percentage of objects in the sample associated with that value in relation to the entire sample. The line ratios of PNe are concentrated around a value of 1.2 for log [H/[S ii]] with a fairly even distribution on either side from the peak. For the log [H/[N ii]] line ratio its values concentrate around 0.0 but falling rapidly to negative values. Finally, the distribution of values for the [S ii] 6717/6731 line ratio is markedly asymmetric, peaking sharply at a value of 0.6, with a smooth drop towards larger values and an abrupt fall on the other side (high density). These values can be considered as representative for the most common or typical conditions in galactic PNe.
0.4 Conclusions
Values of H/[N ii], [S ii] 6717/6731 and H/[S ii] for 613 planetary nebulae have been derived from the Strasbourg Catalogue of Planetary Nebulae, part II (Acker et al. 1992) and plotted in the Sabbadin, Minello & Bianchini (1977) diagnostics diagrams. The current sample substantially expands the sample used in the original diagrams and allows a redefinition of the parameter space of PNe in the log [H/[S ii]] vs log [H/[N ii]], log [H/[S ii]] vs [S ii] 6717/6731 and log [H/[N ii]] vs [S ii] 6717/6731 planes. Accordingly, new statistical limits have been set for the location of PNe in these diagrams using density ellipses of probability 0.85. We find a good, 0.79 correlation for the log [H/[S ii]] vs log [H/[N ii]] intensity ratio; a modest -0.58 correlation for the log [H/[S ii]] vs log [H/[N ii]] intensity ratio and a poor, -0.37 correlation in the case of log [H/[N ii]] vs [S ii] 6717/6731. From our study we obtain the statistical distribution of emission line ratios expected in PNe. These upgraded diagnostic diagrams provide a better representation of the ranges of physical conditions indicated from the emission line ratios and allows the identification and study of groups or individual PNe of particular interest in specific regions of the diagrams.
Finally, in relation to the parameter space for the H II and SNR regions, the data sources in SMB77 for these two cases were restricted to a limited number of objects, as in the original case for PNe. For the HII regions they used the compilation made by Kaler (1976). For the supernovae the data is based on 17 galactic remnants. It would be clearly useful to revise and update the parameter space for the H II and SNR regions to assess the reliability of their distributions in the revised diagrams. This is presently out of the scope of the present paper but worth pursuing as a natural extension of this work.
Templates in poscript or pdf format of the revised diagrams, Figures 4, 5 and 6, are available from J. A. López.
Acknowledgements.
HR acknowledges a posgraduate scholarship from CONACYT. JAL acknowledges continued support from DGAPA-UNAM and CONACYT through grants IN112103 and 43121, respectively. We thank M. Richer and W. Steffen for their comments on this work and the anonymous referee for helping us to improve the presentation of the paper.References
- (1) Acker, A., Ochsenbein, F., Stenholm, B., Tylenda, R., Marcout, J., & Schohn, C. 1992, Strasbourg-ESO Catalogue of Galactic Planetary Nebulae, ESO
- (2) Barral, J.F., Cantó, J., Meaburn, J. & Walsh, J.R. 1982, MNRAS, 199, 817
- (3) Daltabuit, E., D’Odorico, S. & Sabbadin, F. 1976, A&A, 52, 93
- (4) Dopita, M.A. 1976, ApJ, 209 395
- (5) García-Lario, P., Manchado, A., Riera, A., Mampaso, A. & Pottasch, S. 1991, A&A, 249, 223
- (6) Gutiérrez-Moreno, A., Moreno, H. & Cortés, G. 1995, PASP, 107, 462
- (7) Kaler, J.B. 1976, ApJ Supp. Series, 31, 517
- (8) López, J.A. & Meaburn, J. 1983, MNRAS, 204, 203
- (9) Osterbrock, D. E. 1974, Astrophysics of Gaseous Nebulae, W.H. Freeman and Co. San Francisco
- (10) Phillips, J.P. 2004, RMAA, 40, 193
- (11) Sabbadin, F. & D’Odorico, S. 1976, A&A, 49, 119
- (12) Sabbadin, F., Minello, S., & Bianchini, A. 1977, A&A, 60, 147
- (13) Stangehellini, L. & Kaler, J. B. 1989, ApJ, 343 811
- (14) Tajitsu, A., Tamura, S. Yadoumaru, Y., Weinberger, R. & Koppen, J. 1999, PASP, 111, 1157