Velocity distributions in clusters of galaxies
Abstract
We employ a high-resolution dissipationless N-body simulation of a galaxy cluster to investigate the impact of subhalo selection on the resulting velocity distributions. Applying a lower limit on the present bound mass of subhalos leads to high subhalo velocity dispersions compared to the diffuse dark matter (positive velocity bias) and to a considerable deviation from a Gaussian velocity distribution (). However, if subhalos are required to exceed a minimal mass before accretion onto the host, the velocity bias becomes negligible and the velocity distribution is close to Gaussian (). Recently it has been shown that the latter criterion results in subhalo samples that agree well with the observed number-density profiles of galaxies in clusters. Therefore we argue that the velocity distributions of galaxies in clusters are essentially un-biased. The comparison of the galaxy velocity distribution and the sound speed, derived from scaling relations of X-ray observations, results in an average Mach number of 1.24. Altogether of the galaxies move supersonically and have Mach numbers larger than 2 with respect to the intra cluster gas.
keywords:
cosmology:theory – galaxies:clusters,velocity distribution – methods:numerical1 Introduction
Velocity distributions in groups and clusters of galaxies can be used to determine their dynamical masses. It is commonly agreed upon that line of sight distributions similar to Gaussian reveal relaxed systems (e.g. Chincarini & Rood 1977; Halliday et al. 2004; Łokas et al. 2006). Non-gaussianity is usually associated with merging or even multiple-merging events (e.g. Colless & Dunn 1996; Cortese et al. 2004; Adami et al. 2005; Girardi et al. 2005). Obviously, only relaxed systems may yield reliable mass estimates. However, cold dark matter (CDM) simulations have revealed high velocity dispersions of subhalos compared to the diffuse dark matter, even if relaxed systems are considered (Ghigna et al., 2000; Colín et al., 2000; Diemand et al., 2004). In other words, the subhalo populations show a positive velocity bias or are hotter compared to the diffuse component. For dynamical mass estimates of observed clusters (e.g. Łokas et al. 2006) it is important to know whether the velocities of galaxies are biased or not.
In comparing real galaxy clusters with N-body simulations, subhalos must be associated with galaxies. There have been different selection criteria proposed in the literature. As discussed below, the strength of the velocity bias depends strongly on the subhalo selection. Therefore we compare the velocity distributions of two differently selected subhalo samples derived from the same N-body cluster. One sample comprises all bound dark matter substructures above a certain mass limit at present time (). This kind of selection, which has been used in earlier investigations, leads to a positive velocity bias. However, the spatial distribution of these subhalos is less concentrated than the underlying dark matter distribution and not in agreement with observed galaxy distributions. (Diemand et al., 2004). A second subhalo sample, with distributions similar to the observed galaxy distributions, contains only those subhalos, which exceeded a certain mass limit before accretion onto the host. Using this accretion time subhalo selection criterion Nagai & Kravtsov (2005) were successful in matching the distribution of observed cluster galaxies with the results of N-body simulations. Conroy et al. (2005) use the maximal circular velocity at the time of accretion to assign luminosities and stellar masses to (sub)halos and achieve excellent agreement of modelled and observed galaxy clustering properties. This agreement suggests that the luminosity of a galaxy is related to the depth of halo potential at the epoch of high starforming activity, i.e. to its mass or circular velocity before entering the group or cluster.
Semi-analytic modeling of galaxy formation combined with high resolution dissipationless galaxy cluster simulations (Springel et al., 2001; Gao et al., 2004) also produces similar spatial and velocity distributions for the dark matter and the galaxies. Evidently the subhalos are populated with galaxies as in Nagai & Kravtsov (2005) but in a less transparent, more model dependent way. Similar spatial distributions of galaxies and dark matter were also found in hydrodynamic cosmological simulations (see Nagai & Kravtsov 2005; Sommer-Larsen et al. 2005; Macciò et al. 2006).
The spatial distribution of tracers in cosmological dark matter halos is related to their velocity distribution to a very good approximation via the spherical, stationary Jeans equation (Diemand et al., 2004, 2005). A spatially extended component (like subhalos) is hotter than the dark matter whereas more concentrated subsets (like intra cluster light or globular clusters) are colder. Since cluster galaxies tend to trace the total mass distribution, one expects little or no difference between galaxy and dark matter velocity distribution. Clusters of galaxies are formed by gravitational collapse, which results in a nearly Gaussian velocity distribution for the diffuse dark component (Hoeft et al., 2004; Hansen et al., 2006), thus the velocity distribution of galaxies should be close to Gaussian as well. In §2 the simulation and the two subhalo samples are described. In §3 we discuss the impact of the selection criterion of the subhalo samples on the velocity dispersions. Additionally the average Mach number of galaxies orbiting in the intra cluster medium (ICM) is derived. In §4 we summarise our results.
2 Simulation and subhalo samples
We analyse a cluster-sized dark matter halo generated within a cosmological N-body simulation (, , , ). The peak mass resolution is with a softening length of . The cluster (“D12” in Diemand et al. 2004) has a virial mass of at which corresponds to particles within the virial radius of 111According to the definition used here the virial radius encloses 368 times the mean matter density..
We create two different subhalo samples. On the one hand we use SKID222http://www-hpcc.astro.washington.edu/tools/skid.html with a linking length of and identify all bound structures comprising at least 10 particles as subhalos. This way we find 4239 subhalos within the virial radius of the cluster at . Subsequently, this subhalo sample is referred to as sample a. On the other hand we trace back the most bound particle of the subhalos, which were identified by SKID in the same manner as mentioned above, and compare their positions with those of field halos which are found with a friends-of-friends group finder (FOF) in earlier outputs using a linking length of 0.2 times the mean particle separation. The final sample encompasses only those subhalos, which had progenitors (FOF field halos) containing a minimum of 200 () particles at least once during their field-halo phase. In total, 367 sub-halos meet this criterion. These subhalos are assumed to host galaxies. Nagai & Kravtsov (2005) and Conroy et al. (2005) used this approach to assign galaxies to subhalos derived from pure dark matter N-body simulations. Subsequently, this sample is referred to as the “galaxy sample” or sample b. The galaxy sample is subdivided into two sub-samples according to accretion times before and after . The old and the young sub-samples contain 174 and 193 subhalos, respectively. We do not intend to assign any stellar properties to the subhalos, however it is expected that the old sample represents on average redder galaxies, since star formation in these galaxies may be efficiently suppressed by interactions with the dense intra cluster medium.
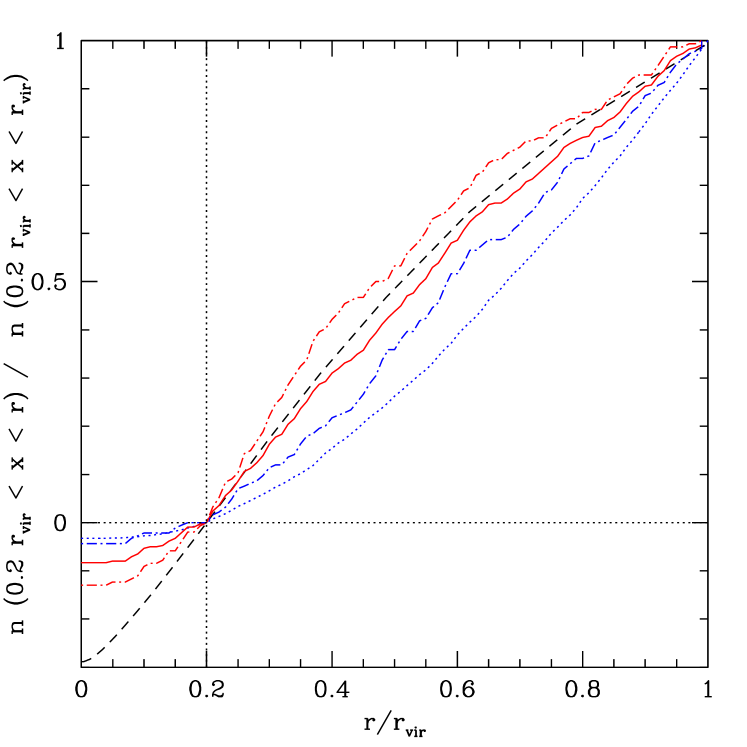
Figure 1 displays the cumulative radial number distribution for the different samples and the diffuse dark matter component. The location of the most bound particle is chosen as centre, which is assumed to coincide with the central brightest galaxy of observed clusters. We start the cumulation for all components, subhalos, galaxies and diffuse dark matter, at of the virial radius (). The inner is excluded because the high density environment is likely to artificially remove substructure by numerical overmerging. Moreover the survival of galaxies in this very inner region also depends on the mass distribution within their inner, baryon dominated parts (Nagai & Kravtsov, 2005; Macciò et al., 2006). The galaxy sample profile (solid line) and the diffuse dark matter profile (dashed line) are very similar, whereas the halos of sample a (dotted line) show a definite deviation. The splitting of the galaxy sample according to accretion times, leads to a strongly concentrated old subsample (red dotted-dashed lines). The young sub-sample (blue dotted-dashed lines) is more similar to sample a.
The selection for sample a based on the current mass of the subhalos ignores the history of the individual subhalos. Thus a recently accreted low mass halo and a tidally striped old (i.e. early accreted) subhalo are treated equivalently. Due to the steep mass function of field halos, most systems ever accreted had masses not much larger than the minimal mass. Those halos that who still lie above this minimal mass today are mostly systems which have lost little mass, i.e. recently accreted halos in the outer part of the cluster (see Kravtsov et al. 2004; Zentner et al. 2005). The selection criterion for the galaxy sample ensures that only subhalos with a substantial initial mass (200 particles) are counted as members of the sample. Since these halos must have retained at least 10 particles to be found by the SKID halo finder at , they can loose of their initial mass on their orbits within the cluster potential well (or even more if they were more massive at the moment of accretion). The subhalos of the galaxy sample are durable. In that respect the galaxy sample is very similar to the diffuse dark matter component, which by default is indestructible.
3 Dependence of the velocity distribution on the subhalo selection
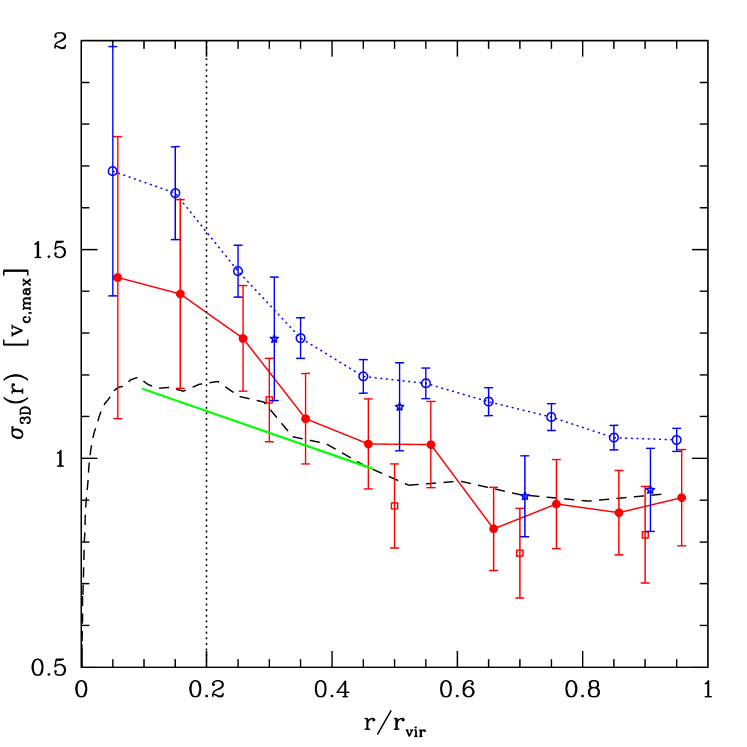
Figure 2 displays radially binned velocity dispersions of the samples a and b with open and filled symbols, respectively and the diffuse dark matter indicated by the dashed line. All dispersions are in units og the circular velocity of the host halo . The dotted vertical line marks the central region which is prone to numerical overmerging. Table 1 displays the characteristic values of the velocity distributions excluding the inner . The qualitative picture does not change if the central volume is included. All velocities are computed relative to the centre of mass velocity (), the average velocity of all particles within . The dispersion of the diffuse dark matter component is shown as black dashed line. The solid green line shows the velocity dispersion derived from X-ray temperature profiles for clusters with comparable size using the relations given in Vikhlinin et al. (2005) and Evrard et al. (1996).
For all radii the velocity dispersion of sample a deviates by more than from the diffuse component. The difference between these two distributions increases towards the centre, approaching values as large as at . There also appears a slight deviation of the velocity dispersion of sample b compared to the diffuse component, however, these deviations lie within the uncertainty range. The velocity dispersion profile of the galaxy sample (sample b) and the diffuse dark matter component are very similar. The old and recently accreted galaxy subsubsamples reveal lower and higher velocity dispersions, respectively. The velocity dispersions of the young subsample agree with the total galaxy sample at large radii but show excess towards the centre. Dispersions of the old galaxy subsample deviate below the total galaxy sample at large radii. The mean velocity dispersions of the subsamples compared to the velocity dispersions of all galaxy halos are and .
As discussed before, the similarity of the galaxy sample and the diffuse component in the density profiles can be explained by the long lifetime of the sample members. Therefore halos of sample b can be considered as a set of durable particles similar to the simulation particles, but with much larger masses. Due to energy conservation (and without including dynamical friction or other energy redistributing mechanisms) the gravitational collapse of a distribution of different mass particles initially leads to equal velocity dispersions within different mass bins. In this scenario neither spatial nor velocity biases are expected between sample b and the diffuse component. On the other hand Figure 2 indicates a prominent velocity bias or offset between the diffuse component and sample a. The average lifetime of sample a is shorter compared to sample b. Sample a is weighted toward subhalos that recently entered the host halo and consequently move faster. This mechanism shifts the average velocity of the remaining subhalos in the sample towards higher values and causes a positive velocity bias (see Ghigna et al. 2000; Colín et al. 2000; Diemand et al. 2004).
| kurtosis | |||
|---|---|---|---|
| N |
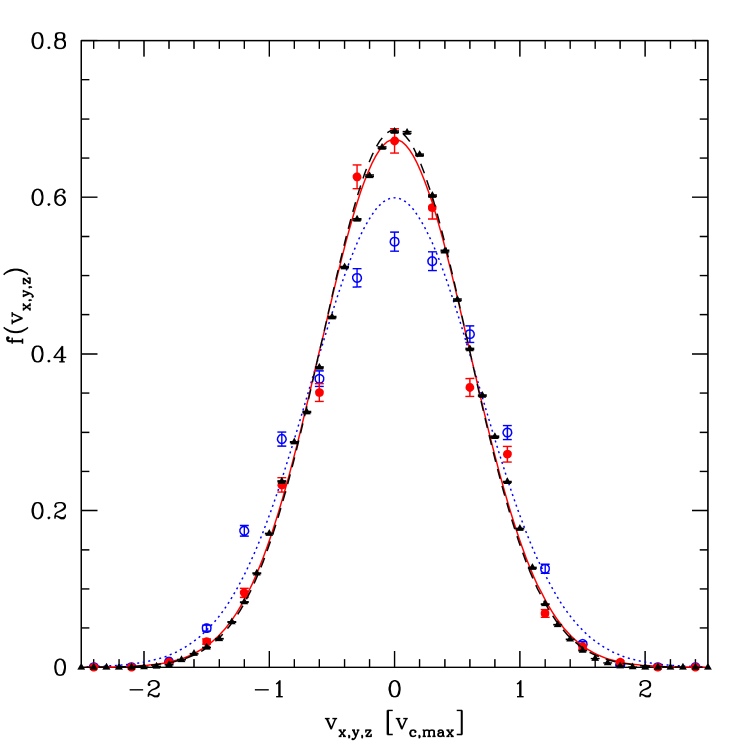
Figure 3 compares the projected velocity distributions of the two subhalo samples and the diffuse component. The dotted, solid and dashed lines are the Gaussian distributions derived from the dispersions of the respective components. Table 1 displays the actual values of the velocity dispersions in units of the maximum circular velocity of the host halo (). The distributions of the galaxy sample and the diffuse dark matter are very similar. The velocity dispersions and kurtosis of these two samples agree within 1 uncertainty. The velocity dispersion of sample a, however, exceeds the two others by . The corresponding velocity distribution (open circles, Figure 3) is flat-topped and not well approximated by a Gaussian distribution (dotted line). There appears to be a lack of slow moving subhalos and a slight excess of high velocity subhalos causing a negative kurtosis of . These features can naturally be explained by the loss of earlier accreted, slow moving, subhalos due to tidal truncation. In this context, loss means decline in particle numbers below the resolution limit of 10 particles.
The shapes of observed galaxy velocity distributions in relaxed clusters can in principle be used to infer if they follow a biased, flat-topped or unbiased, Gaussian distribution. In practice this are difficult measurements since large numbers of galaxies and careful removal of interlopers are needed to achieve a significant result. There are some first hints for flat-topped velocity distributions: van der Marel et al. (2000) report a negative (which is comparable to the subhalo samples, see Diemand et al. 2004) after stacking 16 CNOC1 clusters and excluding the cD galaxies. Łokas et al. (2006) found negative kurtosis values (around ) in 5 out of 6 nearby relaxed Abell clusters. However, the deviations from a Gaussian are only about 1 for these 5 individual systems. Our study suggests that a kurtosis which is significantly more negative than the one for the diffuse component (which has ) could be an indicator for positive velocity bias (and a related spatial anti-bias). It need not necessarily be related to tangential orbits (negative ) as often assumed (see e.g. van der Marel et al. 2000 based on models of Gerhard 1993).
The orbital anisotropy of the galaxy sample is not significantly different from the dark matter background, both are slightly radial in cluster D12. Sample a on the other hand shows marginally tangential orbits. Note that there is significant variation from halo to halo in the profiles. The average over six relaxed clusters similar to D12 shows that the dark matter grows from zero (i.e. isotropic) to about 0.35 near the virial radius and total subhalo populations (corresponding to our sample a) show a similar behaviour with a weak tendency to be closer to isotropic on average (Diemand et al., 2004).
| 64.44 % | 8.33 % | 0.18 % |
The green line in Figure 2 displays the velocity dispersion (temperature) profile of X-ray gas in clusters with masses comparable to the cluster analyzed here (see Vikhlinin et al. 2005). Despite all the complex gas physics involved, it is very similar to the diffuse dark matter and galaxy sample profiles. This finding can be used to estimate the typical Mach numbers of galaxies with respect to the ICM. Assuming adiabatic sound speed (, where is the 1D velocity dispersion of the system and is the adiabatic constant) and integrating the Gaussian distribution of the galaxies results in an average Mach number of . The distribution of Mach numbers is displayed in Table 2. For supersonic galaxy motions leading bow shocks and ram pressure stripped tails are present (Stevens et al., 1999) which can be detected by X-ray observations. Tails of supersonic galaxies are expected to be more irregular than these of subsonic moving galaxies (Roediger et al., 2006). Moreover, since ram pressure is proportional to the ICM density times the galaxy velocity squared (Gunn & Gott, 1972), the appearance of leading bow shocks reduces ram pressure and decreases the stripping efficiency, which may have impact on the abundance profiles in groups and clusters.
4 Summary and conclusions
Using a cold dark matter simulation of a cluster sized ( at ) host halo, we find that different subhalo
selection criteria change the resulting velocity distributions.
We analyse the velocity distribution of two differently selected
subhalo samples. Sample a contains all presently found subhalos
with masses above (10 particles).
Similar selection criteria have commonly been used for investigations
of the velocity bias in N-body simulations, however they do very
likely not generate subhalo samples which are comparable to galaxies
in groups and clusters. Sample b comprises subhalos, which
were able to accumulate more than 200 particles before entering the
host halo. This kind of selection results in number density profiles
which are similar to galaxies observed in groups and clusters (see
Kravtsov
et al. 2004; Nagai &
Kravtsov 2005). Our main conclusions are as
follows:
(1) In agreement with other authors, we find an enhancement of
the velocity dispersion in the range from to if sample
a is compared to the diffuse dark matter component. On average
sample a comprises more recently accreted, fast moving,
sub-halos since the early accreted, somewhat more slowly moving, halos
are prone to tidal dissolution. The positive velocity bias in sample
a results from a lack of slow moving sub-halos, i.e. a flat
topped non Gaussian velocity distribution with negative kurtosis
.
(2) We find no significant velocity bias between sample
b and the diffuse component. Both have nearly Gaussian velocity
distributions () and small radial anisotropies
(). Since sample b resembles the
spatial distributions of galaxies within clusters, it seems reasonable
to identify sample b with such galaxies. We conclude, that the
velocity distribution of cluster galaxies is very similar to the
underlying dark matter velocity distribution. This finding supports
the assumption of not applying a spatial or velocity bias when
estimating the cluster masses via galaxy kinematics (see
e.g. Łokas et al. 2006).
(3) The difference between sample a and b
lies in the lifetimes of the subhalos. Many subhalos of
sample a are low mass objects, lying only a little
above the mass limit. If these subhalos lose a small fraction of their
mass due to tidal forces, they will no longer be members of the
sample. On the other hand members of sample b have to lose
at least of their mass to be removed from the sample. Likewise,
massive galaxies in clusters are assumed to
survive for a long time after accretion. This can explain
similar properties of the diffuse dark matter, sample b and
luminous galaxies in clusters. However, this picture may change in
smaller and/or older host systems where dynamical friction and tidal
forces are more important. For instance, fossil groups are presumably
old (D’Onghia
et al., 2005) and may have turned a substantial fraction of
their old, slow moving, satellite galaxies into diffuse intra-group
light (Da Rocha
& Mendes de Oliveira, 2005; Faltenbacher &
Mathews, 2005). It is expected, that the
spatial and velocity distributions of fossil groups show similar
features (flattened central number-density profile and a lack
of slow moving galaxies) as found in sample a.
(4) The mean velocity dispersions of the whole
galaxy sample compared to the old galaxy subsample differ by
, thus the resulting mass estimates based on would
deviate by a factor of . A similar trend is found in
observations, if more recently accreted galaxy populations are
included for the computation of the total velocity dispersion (see
e.g. Mendes de Oliveira et al. 2006).
(5) We find an average Mach number of
1.24 for galaxies moving within a relaxed cluster
(compare to Faltenbacher et al. 2005). Altogether of the
galaxies move supersonically and show Mach numbers larger
than 2. The appearance of shocks affects the interaction between
galaxy and cluster gas in various ways. In particular shocks ahead of
supersonic moving galaxies reduces the ram pressure exerted
on the gas in their disks.
Acknowledgements
We are grateful to William G. Mathews for insightful comments on the draft of this paper. We thank the anonymous referee who helped us to improve the original manuscript. AF has been supported by NSF grant AST 00-98351 and NASA grant NAG5-13275 and JD by the Swiss National Science Foundation for which we are very thankful.
References
- Adami et al. (2005) Adami C., Biviano A., Durret F., Mazure A., 2005, A&A, 443, 17
- Chincarini & Rood (1977) Chincarini G., Rood H. J., 1977, ApJ, 214, 351
- Colín et al. (2000) Colín P., Klypin A. A., Kravtsov A. V., 2000, ApJ, 539, 561
- Colless & Dunn (1996) Colless M., Dunn A. M., 1996, ApJ, 458, 435
- Conroy et al. (2005) Conroy C., Wechsler R. H., Kravtsov A. V., 2005, ArXiv Astrophysics e-prints, astro-ph/0512234
- Cortese et al. (2004) Cortese L., Gavazzi G., Boselli A., Iglesias-Paramo J., Carrasco L., 2004, A&A, 425, 429
- Da Rocha & Mendes de Oliveira (2005) Da Rocha C., Mendes de Oliveira C. L., 2005, MNRAS, 364, 1069
- Diemand et al. (2005) Diemand J., Madau P., Moore B., 2005, MNRAS, 364, 367
- Diemand et al. (2004) Diemand J., Moore B., Stadel J., 2004, MNRAS, 352, 535
- D’Onghia et al. (2005) D’Onghia E., Sommer-Larsen J., Romeo A. D., Burkert A., Pedersen K., Portinari L., Rasmussen J., 2005, ApJ, 630, L109
- Evrard et al. (1996) Evrard A. E., Metzler C. A., Navarro J. F., 1996, ApJ, 469, 494
- Faltenbacher et al. (2005) Faltenbacher A., Kravtsov A. V., Nagai D., Gottlöber S., 2005, MNRAS, 358, 139
- Faltenbacher & Mathews (2005) Faltenbacher A., Mathews W. G., 2005, MNRAS, 362, 498
- Gao et al. (2004) Gao L., De Lucia G., White S. D. M., Jenkins A., 2004, MNRAS, 352, L1
- Gerhard (1993) Gerhard O. E., 1993, MNRAS, 265, 213
- Ghigna et al. (2000) Ghigna S., Moore B., Governato F., Lake G., Quinn T., Stadel J., 2000, ApJ, 544, 616
- Girardi et al. (2005) Girardi M., Demarco R., Rosati P., Borgani S., 2005, A&A, 442, 29
- Gunn & Gott (1972) Gunn J. E., Gott J. R. I., 1972, ApJ, 176, 1
- Halliday et al. (2004) Halliday C., Milvang-Jensen B., Poirier S., Poggianti B. M., Jablonka P., Aragón-Salamanca A., Saglia R. P., De Lucia G., Pelló R., Simard L., Clowe D. I., Rudnick G., Dalcanton J. J., White S. D. M., Zaritsky D., 2004, A&A, 427, 397
- Hansen et al. (2006) Hansen S. H., Moore B., Zemp M., Stadel J., 2006, Journal of Cosmology and Astro-Particle Physics, 1, 14
- Hoeft et al. (2004) Hoeft M., Mücket J. P., Gottlöber S., 2004, ApJ, 602, 162
- Kravtsov et al. (2004) Kravtsov A. V., Gnedin O. Y., Klypin A. A., 2004, ApJ, 609, 482
- Łokas et al. (2006) Łokas E. L., Wojtak R., Gottlöber S., Mamon G. A., Prada F., 2006, MNRAS, 367, 1463
- Macciò et al. (2006) Macciò A. V., Moore B., Stadel J., Diemand J., 2006, MNRAS, 366, 1529
- Mendes de Oliveira et al. (2006) Mendes de Oliveira C. L., Cypriano E. S., Sodré L. J., 2006, AJ, 131, 158
- Nagai & Kravtsov (2005) Nagai D., Kravtsov A. V., 2005, ApJ, 618, 557
- Roediger et al. (2006) Roediger E., Brueggen M., Hoeft M., 2006, ArXiv Astrophysics e-prints, astro-ph/0603565
- Sommer-Larsen et al. (2005) Sommer-Larsen J., Romeo A. D., Portinari L., 2005, Mon. Not. Roy. Astron. Soc., 357, 478
- Springel et al. (2001) Springel V., White S. D. M., Tormen G., Kauffmann G., 2001, MNRAS, 328, 726
- Stevens et al. (1999) Stevens I. R., Acreman D. M., Ponman T. J., 1999, MNRAS, 310, 663
- van der Marel et al. (2000) van der Marel R. P., Magorrian J., Carlberg R. G., Yee H. K. C., Ellingson E., 2000, AJ, 119, 2038
- Vikhlinin et al. (2005) Vikhlinin A., Markevitch M., Murray S. S., Jones C., Forman W., Van Speybroeck L., 2005, ApJ, 628, 655
- Zentner et al. (2005) Zentner A. R., Berlind A. A., Bullock J. S., Kravtsov A. V., Wechsler R. H., 2005, ApJ, 624, 505