X-ray reflection in the nearby Seyfert 2 galaxy NGC 1068
Abstract
We use the full broad-band XMM-Newton EPIC data to examine the X-ray spectrum of the nearby Seyfert 2 galaxy NGC 1068, previously shown to be complex with the X-ray continuum being a sum of components reflected/scattered from cold (neutral) and warm (ionised) matter, together with associated emission line spectra. We quantify the neutral and ionised reflectors in terms of the luminosity of the hidden nucleus. Both are relatively weak, a result we interpret on the Unified Seyfert Model by a near side-on view to the putative torus, reducing the visibility of the illuminated inner surface of the torus (the cold reflector), and part of the ionised outflow. A high inclination in NGC 1068 also provides a natural explanation for the large (Compton-thick) absorbing column in the line-of-sight to the nucleus. The emission line fluxes are consistent with the strength of the neutral and ionised continuum components, supporting the robustness of the spectral model.
keywords:
galaxies: active – galaxies: Seyfert: general – galaxies: individual: NGC 1068, Mkn 3 – X-ray: galaxies1 Introduction
At X-ray energies the low redshift Seyfert 2 galaxies NGC 1068 and Mkn 3 exhibit very ‘hard’ broad-band spectra due to strong absorption of the intrinsic X-ray continuum by a large column density of intervening cold matter (the torus?). Previous analyses of XMM-Newton EPIC spectra (NGC 1068: Matt et al. 2004, hereafter M04; Mkn 3: Pounds et al. 2005, hereafter P05) have confirmed earlier suggestions that the observed X-flux over the 3-10 keV band in these two nearby AGN is dominated by indirect radiation ‘reflected’ into the line of sight. We use the generic term ‘reflection’ here to describe the re-direction of the hidden nuclear X-ray continuum into the line of sight by electron scattering from neutral or near-neutral (‘cold’) matter, and from ionised (‘warm’) gas. Line emission arises from the same cold and warm reflectors as fluorescent (inner shell) transitions and by recombination/radiative decays, respectively. High resolution grating spectra from both XMM-Newton and Chandra have confirmed the soft X-ray band in both NGC 1068 and Mkn 3 to be dominated by line emission from a photoionised/photoexcited gas (NGC 1068: Kinkhabwala et al. 2002, Ogle et al. 2003; Mkn 3: Sako et al. 2000, P05), with observed outflow velocities of 400–500 km s-1.
Depression of the strong nuclear continuum in Seyfert 2 AGN makes them particularly suitable for studying the circumnuclear material, by both X-ray absorption and emission spectra. The structure and dynamics of the putative torus can be probed in terms of absorption and ‘cold reflection’, including fluorescence line emission, while the ‘warm reflector’ required by both the polarised broad optical lines and the soft X-ray line emission allows the ionised gas outflow to be quantified.
The aim of this paper is to assess the broad-band XMM-Newton EPIC spectrum of NGC 1068 in terms of the Unified Model of AGN (Antonucci 1993), and compare the outcome with the similar study of Mkn 3, which P05 concluded was probably a rather special case, being viewed ‘just over the edge’ of the torus.
2 EPIC observation of NGC 1068 and data reduction
NGC 1068 was observed by XMM-Newton on 2000 July 29-30. As the MOS1 camera was operated in full frame mode and suffered significant signal pile-up, we use X-ray spectra solely from the EPIC pn (Strüder et al. 2001) and MOS2 (Turner et al. 2001) cameras. The pn camera was operated in the large window mode and MOS2 in the small window mode, both with the medium filter, and pile-up was found to be unimportant. The X-ray data were screened with the SAS v6.3 software and events corresponding to patterns 0-4 (single and double pixel events) were selected for the pn data and patterns 0-12 for the MOS data. We separately obtained single pixel pn data to quantify the (small) energy shift in the double pixel counts (P05), but retained the full data set for the subsequent analysis as it provides significantly better statistical quality in the important Fe K band and above. EPIC source counts were taken within a circular region of 40′′ radius about the centroid position of NGC 1068, with the background being taken from a similar region, offset from but close to the source. The net exposures available for spectral fitting after removal of some high background data were 61.9 ks (pn) and 68.7 ks (MOS2). Since no obvious variability was evident throughout the observation, spectral data were then integrated over the full exposures and binned to a minimum of 20 counts per bin, to facilitate use of the minimalisation technique in spectral fitting. Spectral fitting was based on the Xspec package (Arnaud 1996) and all spectral fits include absorption due to the NGC 1068 line-of-sight Galactic column of (Dickey and Lockman 1990). Errors are quoted at the 90% confidence level ( for one interesting parameter).
3 The hard (3.5-15 keV) EPIC spectrum
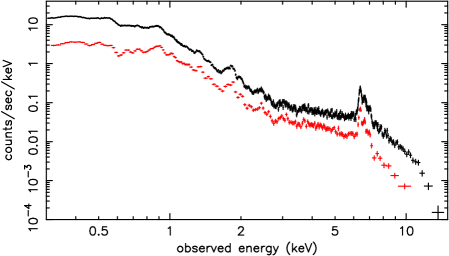
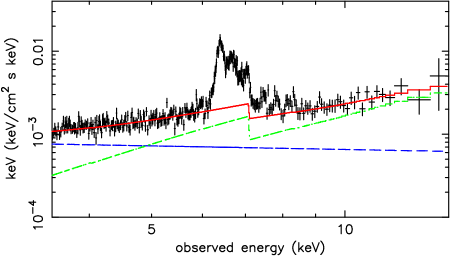
The integrated pn and MOS2 count spectra of NGC 1068 are reproduced in figure 1 and show considerable structure at both high and low energies. A simple power law fit to the data above 3 keV finds it to be ‘hard’, with a photon index 1. However, an observation of NGC 1068 to 100 keV with BeppoSAX confirmed the presence of a ‘normal’ Seyfert continuum source (1.8; Nandra and Pounds 1994) obscured by a Compton thick absorber (NHcm-2; Matt et al. 1997). Those authors, and Iwasawa et al.(1997) using ASCA data, interpreted the X-ray flux observed at 3–10 keV as arising by reflection/scattering of the nuclear power law continuum into the line of sight from cold matter, perhaps the inner face of the putative torus, with an additional component from the warm (highly ionised) medium also responsible for the polarised broad optical lines. Here we follow that analysis (see also M04) by fitting the 3.5-15 keV pn and MOS data, excluding the emission features at 6–8 keV, with 2 continuum components, one scattered into the line of sight by the warm reflector, retaining the slope of the intrinsic power law but diluted in accord with the optical depth and covering factor of the ionised gas, together with a cold reflection component, modelled in Xspec by PEXRAV (Magdziarz and Zdziarski 1995). This dual reflection model yields an acceptable continuum fit (=523/490 dof), with photon index =2.10.1 now within the range for a type 1 Seyfert nucleus (more specifically of a Narrow Line Seyfert 1; see Discussion), supporting the initial assumption that the hard spectrum of NGC 1068 is reflection-dominated. Applying this continuum model to the whole 3.5-15 keV data shows the highly significant excess flux at 6–8 keV (figure 2).
We then fit that excess with a sequence of Gaussian emission lines, with line energy and flux as free parameters and line widths initially tied. The number of lines that can be resolved depends on the EPIC resolution and the actual line widths. M04 found 9 lines in their fit, assuming intrinsically narrow lines. We find a best-fit tied line width =3010 eV, with - again - 9 emission lines being statistically significant. Justification of such a complex spectral fit, a tribute to the spectrometric capability of EPIC, is discussed further in the Appendix.
Our fit includes a single-scattering Compton shoulder (80eV) centered at 0.1 keV below the Fe K line of Fe (Hatchett and Weaver 1977). There is also marginal evidence for a similar Compton shoulder to Ni K, which we then include for physical consistency. The addition of those 10 emission lines yields an acceptable overall 3.5–15 keV spectral fit, with =858/805 dof.
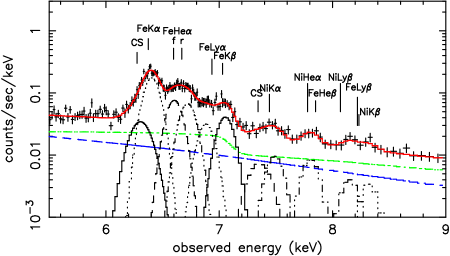
Figure 3 shows the line emission fit in more detail, together with the cold and warm reflection continua. The zero-velocity energies of the candidate line identifications of the K-shell emission of Fe and Ni, the only abundant metals with transitions in this energy band, are also shown in the figure. Fluxes and equivalent widths of the principal lines are included in Table 1.
Fluorescent emission from the cold reflector is clearly seen in the K lines of Fe and Ni, and K of Fe, with all 3 fluorescent line energies indicating (at most) a small blue-shift from the neutral line energy. (Re-fitting the line spectrum using only single pixel pn counts yielded a rest frame energy for Fe K of 6.4150.007 keV.) The relative strength of the Compton shoulder for the FeK line, at 20%, is consistent with reprocessing in Compton-thick reflecting matter (Matt 2002). The flux ratio of Fe K to K, of 4.5, compares with a theoretical ratio of 6 (Molendi et al. 2003), the strong K line being consistent with the low ionisation state of the ‘cold’ reflector.
Identifying the line emission from the warm (ionised) reflector is less straightforward, with line blending and an indication of substantial velocity shifts in some lines. Intriguingly, line shifts have been indicated in previous observations of ionised Fe K lines in NGC 1068 (Iwasawa et al. 1997, Ogle et al. 2003), implying velocities of 2000-5000 km s-1. Confirmation of high velocity/highly ionised gas extending above the putative torus in NGC 1068 would be of considerable interest, given growing evidence for such flows in luminous type 1 AGN (Chartas et al.2002, Pounds et al. 2003, O’Brien et al. 2005). We defer further consideration of this possibility to a subsequent paper (Pounds et al.2006).
Based on the above broad band spectral fit we find an 3-15 keV flux for NGC 1068 of erg cm-2 s-1, corresponding (for a red-shift of 0.00379; Huchra et al. 1999) to a luminosity of erg s-1 ( km s-1 Mpc-1). For later reference, over the 2–10 keV band the cold reflection continuum luminosity is Lcold erg s-1, with Lwarm erg s-1.
4 Extrapolating the hard EPIC spectral fit of NGC 1068 to 0.3 keV
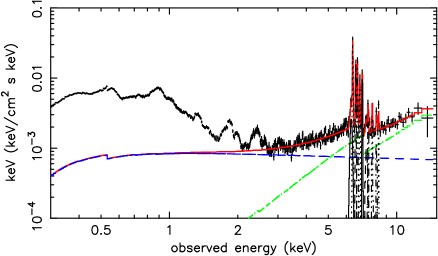
Extending the 3.5-15 keV spectral fit to lower energies reveals a marked and highly structured ‘soft excess’ (figure 4). The excess soft X-ray emission is found to have an observed flux (0.3-3 keV) of erg cm-2 s-1. Allowing for attenuation by the Galactic column of cm-2 increases this by 10 percent, corresponding to an intrinsic soft X-ray luminosity over this energy band of erg s-1.
Similar low energy structure is seen in both pn and MOS spectra and we choose - as for Mkn 3 in P05 - to study the MOS data in more detail, since in the soft X-ray band both EPIC cameras have ample statistics while the energy resolution in the MOS CCDs is better. [The 1 resolution of the MOS at the time of the NGC 1068 observation was 34 eV at 1.5 keV (M.Kirsch, XMM-SOC-CAL-TN-0018 issue 2.3, 28 July 2004)]. As P05 found in their analysis of Mkn 3 the MOS camera is remarkably good in resolving the main spectral features in a line-dominated spectrum. Although not competing with the RGS spectrum in terms of energy resolution, the MOS data are a valuable complement to the RGS by virtue of having better count statistics, a sensitivity extending to higher energies, and potentially providing a measure of line flux in broad wings that would be difficult to distinguish in high resolution spectra. The quantitative comparison of line and continuum emission provides an important check on the reflection-dominated spectrum of NGC 1068.
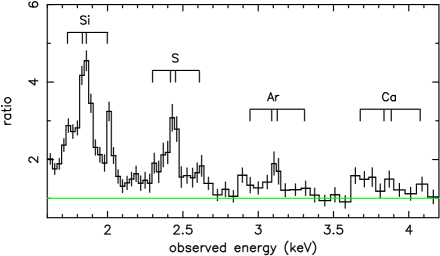

Visual examination of the low energy excess in the MOS spectrum of NGC 1068 (figure 5) confirms that the neutral K lines of Si, S, Ca and Ar are detected, with equivalent widths (compared to the cold reflection continuum), listed in Table 1, broadly consistent with fluorescence in solar abundance matter (Matt, Fabian and Reynolds 1997). The resonance emission lines of highly ionised ions of Ca, Ar, S, Si, Mg, Ne and O can also be resolved in the MOS data, though comparison with the higher resolution RGS data for NGC 1068 (Kinkhabwala et al. 2002) shows many weaker lines, particularly of Fe-L and higher transitions of the He- and H-like ions, that are blended in the MOS spectra below 1.5 keV. For example, the peaks identified with Fe-L lines in figure 5 are seen in the RGS data to be blended with equally strong radiative recombination continua (RRC) of OVII and VIII. Nevertheless, we expect the flux and equivalent widths of the resonance lines of He- and H-like ions of S and Si (also listed in Table 1) to be reasonably well determined.
We see no significant blue- or red-shifts in the lines resolved by the MOS, consistent with the higher resolution RGS data, from which Kinkhabwala et al. find an outflow velocity of 400-500 km s-1 and line widths of similar magnitude. In particular, there is no evidence in the low and moderate ionisation gas for the high velocities suggested for the highly ionised Fe K lines.
A key assumption in deducing the line EWs is that the incident continuum is correctly modelled as in figure 4. For example, a strong up-turn in the soft X-ray continuum is often assumed in fitting Seyfert 1 spectra (although the physical reality of this ‘soft excess’ has recently been questioned by Gierlinski and Done 2004). It is instructive in this respect to compare the excess soft X-ray flux in figure 4 with the sum of the line fluxes resolved by the RGS (Kinkhabwala et al. 2002). Between 0.35-2 keV the narrow emission lines resolved by the RGS account for 70% of the total soft excess flux over the same energy band in figure 4. Allowance for possible broad wings to the principal lines, and for faint or blended lines not listed in the RGS analysis could easily provide the difference. That suggests any continuum ‘soft excess’ in in the intrinsic X-ray spectrum of NGC 1068 is small or absent.
5 Discussion
5.1 Visual comparison of the broad-band X-ray spectra of NGC 1068 and Mkn 3.
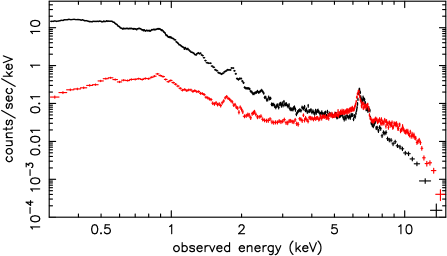
Analysis of the EPIC spectrum of NGC 1068 over the 3.5–15 keV energy band shows the X-ray continuum to be composed of two components, arising from the hidden nucleus being scattered into the line-of-sight by both cold and warm reflectors. This spectral modelling is markedly different from that of Mkn 3 (P05), where the 3–15 keV spectrum is primarily an addition of the attenuated intrinsic power law and a strong cold reflection component. This difference is clear in a visual comparison of the raw EPIC data of NGC 1068 and Mkn 3 (figure 6). The cold-reflection-dominated continuum of Mkn 3 is evident in the extremely hard spectrum ( –0.5) below 6 keV, and in the deep absorption Fe K absorption edge at 7.1 keV. (We see later that the strong cold reflection in Mkn 3 results in it being as bright as NGC 1068 near 6 keV, despite being 3.5 times more distant.) Above 10 keV the much softer observed Mkn 3 spectrum is a consequence of the underlying 1.8 power law becoming visible through the marginally Compton-thick absorber. In contrast, while the absorbed power law component enhances the overall Fe K absorption edge in Mkn 3, the power law component in NGC 1068 reflected from highly ionised matter (acting more like a perfect mirror) has the effect of diluting the observed 7.1 keV edge and softening the continuum below 6 keV (1).
In the soft X-ray band, below 3 keV, visual examination of the EPIC data shows the soft X-ray spectra of NGC 1068 and Mkn 3 to be similar in both spectral structure and luminosity, although in Mkn 3 the flux falls more steeply at the lowest energies. While the latter difference is partly explained by the larger Galactic column in the line-of-sight to Mkn 3, some residual difference suggests a higher mean ionisation parameter for the outflow visible in Mkn 3, a view supported by the higher ratio of Ly to He line fluxes in Table 1 for Mkn 3.
| Line | NGC 1068 flux | EW(eV) | Mkn 3 flux | EW(eV) | EWcalc(eV) |
|---|---|---|---|---|---|
| Si I K | 155 | 300100 | 102 | 20040 | 165 |
| Si XIII (1s-2p)rif | 304 | 14020 | 102 | 7015 | |
| Si XIV Ly | 155 | 7525 | 82 | 14035 | |
| S I K | 42 | 11055 | 73 | 14060 | 230 |
| S XV (1s-2p)rif | 124 | 6020 | 31.5 | 6030 | |
| S XVI Ly | 63 | 3015 | 31.5 | 6530 | |
| Fe I K | 417 | 600100 | 303 | 1100100 | 1000 |
| Fe I K CS | 9.5 | 13070 | 61 | 20040 | |
| Fe XXV (1s-2p)r | 173 | 34060 | 2 | 1400 | 350 |
| Fe XXVI Ly | 81.5 | 25045 | 2 | 1400 | 250 |
| Fe I K | 111.5 | 22030 | 31.5 | 11055 | |
| Ni I K | 31 | 14050 | 21 | 6030 | 90 |
Table 1 lists the estimated fluxes and equivalent widths (EW) of the the principal emission lines that can be adequately resolved in the EPIC data for NGC 1068 and Mkn 3. In the Fe and Ni K bands our derived fluxes agree well with those in MO4, although our calculated equivalent widths are a factor 2 lower. While the softer X-ray line fluxes have substantial errors, the derived values are in general agreement with those from the Chandra HETG observation reported by Ogle et al. (2003). For our present purposes, to assess the reflection-dominated X-ray spectrum of NGC 1068, the measured line equivalent widths - and their comparison with simple theory - are of most interest.
Taking first the fluorescent lines of Ni, Fe, S and Si, all have a large EW, within a factor 2 of the prediction for reflection from cold, optically thick matter of solar abundance. Taken as a group, the measured values are consistent with the relative strength of the cold reflector in our continuum fit for NGC 1068, as was found by P05 for Mkn 3.
For the warm reflector, the principal emission lines of ionised S and Si are seen with similar EWs in both NGC 1068 and Mkn 3. The non-detection of He- and H-like Fe emission in Mkn 3 can be understood partly by the dominance of the cold reflection and intrinsic power law continua (over the ionised reflector) in the Fe K band for that source. In the case of NGC 1068 those resonance lines are detected, but with EWs much lower than the (2–3 keV) values predicted for scattering of the hidden X-ray continuum from optically thin gas (Matt et al.1996). Included in the final column of Table 1 are reduced values of the Fe XXV and XXVI resonance line EWs assuming a column density through the warm reflector of NH= cm-2, as derived in the next Section.
5.2 Measuring the strength of reflection in NGC 1068 and Mkn 3
Implicit in the above discussion is that the reflection components have a simple relationship to the irradiating continuum. The cold reflection will be a product of LX/4, where LX is the intrinsic nuclear X-ray luminosity, is the mean albedo and /4 is the fractional solid angle of illuminated cold matter in our line of sight. Though the incident spectral index and reflection geometry are also significant, as is the relative Fe abundance, the principal determinant of the strength of the reflection, relative to the incident flux, is the solid angle of reflector in view. For the warm reflector, the observed continuum luminosity will, for an optically thin plasma, be a product of LX/4, where /4 is the covering fraction (of the source) by matter of scattering optical depth .
Where the intrinsic power law component is detected, as in Mkn 3, the PEXRAV model in Xspec yields a measure of /2, termed the reflection factor R. P05 found R = 1.70.1, consistent with the strong cold reflection in Mkn 3. A similar estimate of R is not possible for NGC 1068 where the intrinsic X-ray source is not seen in the XMM-Newton band.
Fortunately, the 12m flux has been shown to be a good indicator of the nuclear bolometric luminosity of Seyfert galaxies of both type 1 and type 2 (Spinoglio and Malkan 1989), while the bolometric and 2–10 keV luminosities are also often closely coupled (e.g. Marconi et al.2004). For NGC 1068 the 12m flux yields Lbol erg s-1, which in turn allows an estimate of the unseen X-ray luminosity (Marconi et al.2004) of L2-10 erg s-1. Comparing that figure with our measured value for the cold reflection continuum Lcold erg s-1, taking 0.02 (George and Fabian 1991), we find /40.11. Such a small value might be seen in a geometry where the irradiated inner surface of the torus is largely hidden by a side-on view angle. In NGC 1068 that conclusion would be consistent with the water maser observations (Gallimore et al. 1996; Greenhill et al. 1996) which indicate a toroidal disc, of 1 pc scale, at an inclination 80∘.
In conceptual terms the extremely strong cold reflection in Mkn 3 creates more difficulty, implying that we are seeing unattenuated reflection from matter completely surrounding the nuclear source. One possibility might be that we have underestimated the intrinsic X-ray flux. To check that, we again use the 12m flux to estimate the bolometric luminosity of Mkn 3, finding Lbol erg s-1. Assuming the 25-fold ratio of Lbol to L2-10 (Marconi et al. 2004), we then retrieve the intrinsic luminosity as L2-10 erg s-1, very close to the value obtained from the XMM-Newton analysis of Mkn 3. Thus it appears that the strong cold reflection in Mkn 3 requires a rather special geometry, where a viewing angle just cutting the near-side edge of the torus, as proposed in P05, sees directly most of the illuminated far inner wall of the putative torus. In addition, transmission through a column density cm-2 of cold matter on the near side of the torus may provide a significant additional component to both continuum and Fe K line, which might also explain the significant blue-shift of the Fe K line in Mkn 3 (PO5).
The strength of the warm reflected continuum provides a measure of the ionised gas extending above the obscuring torus. From the spectral deconvolution of NGC 1068 we had, over the 2–10 keV band, Lwarm erg s-1. Compared with the incident luminosity of L2-10 erg s-1, we find .C 0.25 %. This value is close to that found from optical spectroscopy (Miller et al. 1991) and photoionisation modelling (e.g. Storchi-Bergmann et al. 1992) of the NLR. The effect of the higher scattering cross section in resonance lines is seen clearly below 2 keV where strong line emission is responsible for the soft X-ray hump seen in figure 4 (Kinkhabwala et al. 2002). Assuming the continuum scattering fraction of 0.25% and a covering factor C0.1 (Miller et al. 1991), we deduce a column density through the ionised gas of NH cm-2, which would be sufficient to strongly depress resonance line fluxes without a significant velocity shear in the outflow (Matt et al. 1996). Such a substantial reduction is indeed indicated in the measured equivalent widths of the ionised reflector resonance lines in Table 1, where we find reasonable agreement with theory (Matt et al. 1996) assuming a column density of NH cm-2.
Referring again to figure 6, given that NGC 1068 is 3 times more luminous and 3.5 times closer than Mkn 3, we would expect - with identical warm reflectors - that Mkn 3 would be 36 times fainter than NGC 1068 in the soft X-ray band. Figure 7 shows the observed difference is closer to a factor 12 at 1 keV, increasing to 20 at 0.5 keV, allowing for the larger Galactic column to Mkn 3. Thus the line-dominated soft X-ray emissivity in Mkn 3 is a factor 1.8–3 larger than in NGC 1068. For the warm continuum component, a comparison with the intrinsic luminosity over the same 2–10 keV band, as above, yields a scattering fraction for Mkn 3 of 1.1%. Thus both continuum and line fluxes suggest a factor 2–4 more ionised matter is visible in Mkn 3.
5.3 An interpretation on the Unified Scheme
In terms of the unified Seyfert geometry (e.g. Antonucci 1993), where the nuclear source is hidden from direct view at large inclinations by an optically thick torus, we now have 3 independent deductions from the X-ray spectral analysis which all suggest that NGC 1068 is observed near side-on (Compton thick absorption, weak cold and relatively weak warm reflection), in contrast to Mkn 3, which PO5 concluded is viewed at a large angle to the plane of the torus, with a smaller column to the nucleus, and a much larger extent of the illuminated inner surface visible. Again, on that standard picture, the larger ionised reflection seen in Mkn 3 could be a result of seeing further down the throat of the torus and correspondingly more of the outflowing ionised gas. The spectral difference in the soft emission in the 2 cases suggests the gas closer to the nucleus is also more highly ionised.
We note, in passing, that integrating such an ionised outflow to much smaller radii would contribute a stronger soft X-ray emission spectrum in type 1 Seyferts, as suggested recently ( Pounds et al. 2005b and references therein). The relatively high velocities and strong saturation in resonance line cores expected in that case could put much of that extra emission into broad wings which would be difficult to see with current high resolution instrumentation.
6 Summary
The XMM-Newton observation of NGC 1068 highlights the potential to explore the local circumstellar matter in type 2 AGN, afforded by the strong suppression of the direct nuclear continuum.
The hard X-ray (3 keV) spectra of both NGC 1068 and Mkn 3 have continuum components arising from reflection from cold matter, perhaps the putative molecular torus. Both also have a strong emission line at 6.4 keV consistent with fluorescence from the same cold matter. While the absorbing column density to the nuclear X-ray source in Mkn 3 is only marginally Compton-thick (NH1.2cm-2), allowing the intrinsic power law to be seen 8 keV, the cold absorber in NGC 1068 is totally opaque in the EPIC band. Paradoxically, the Compton-thick source, NGC 1068, has the less hard overall spectrum and a much weaker Fe K edge. Spectral deconvolution confirms that this is due to a relatively strong continuum component reflected from warm matter into to line of sight in NGC 1068. We note that, if Compton-thick AGN are a dominant component of the Cosmic X-ray Background (1.4), this ‘continuum softening’ must be a common occurrence at higher redshift. This is indeed suggested in a recent survey of 49 Seyfert 2 X-ray spectra (Guainazzi et al.2005) which found highly obscured AGN invariably exhibit a prominent soft excess above the extrapolated hard X-ray power law. Conversely, we conclude the extremely hard 2-10 keV spectrum of Mkn 3 shows that such sources cannot be very common, a conclusion consistent with the interpretation in P05 of a Seyfert being viewed (just) through the edge of the obscuring torus.
Line fluxes from both neutral and ionised matter yield equivalent widths that support the continuum deconvolution. However, comparison of the reflected continua with an estimate of the intrinsic nuclear luminosities shows that both cold and warm reflection is stronger in Mkn 3, particularly so for the former. The large cold reflection and marginally Compton thick absorber in Mkn 3 led P05 to suggest that Mkn 3 was being viewed through the near-edge of the putative torus. We now find the much lower cold reflection and higher opacity to the nucleus suggests that NGC 1068 is being viewed near side-on, i.e. close to the plane of the torus. The further outcome of our comparison of the X-ray spectra of NGC 1068 and Mkn 3, that the total warm reflection is somewhat stronger in Mkn 3, is also consistent with that explanation, whereby more of the outflowing ionised gas can be seen over the edge of the obscuring cold matter. One caveat on that conclusion, which assumes NGC 1068 and Mkn 3 are intrinsically similar objects, is raised by the relatively narrow permitted optical lines (Miller et al. 1991) and steep X-ray power law in NGC 1068, suggesting it harbours a NLS1 nucleus, where a significantly higher accretion ratio (Pounds et al. 1995, Laor 1997) could affect the density and distribution of circumnuclear matter.
Finally we note how our analysis may be relevant to the strong soft excesses widely ‘observed’, but physically difficult to explain (e.g. Gierlinski and Done 2004) in Type 1 Seyferts. First, taking our interpretation of the stronger warm reflector in Mkn 3 as being due to seeing deeper into the throat of the torus, observing the outflow in a type 1 Seyfert might provide the enhanced soft X-ray emission component discussed in Pounds et al. (2005). Second, the absence of a significant ‘upturn’ below 1 keV in the warm reflected continuum of NGC 1068 contrasts with the strong ‘soft excess’ often claimed in Seyfert 1 spectra. Both these findings support recent suggestions (e.g. Gierlinski and Done 2004, Pounds et al. 2004a,b) that the enigmatic ‘soft excess’, a long-standing property of AGN (Turner and Pounds 1989) needs a fundamental re-assessment.
7 Acknowledgements
The results reported here are based on observations obtained with XMM-Newton, an ESA science mission with instruments and contributions directly funded by ESA Member States and the USA (NASA). The authors wish to thank the SOC and SSC teams for organising the XMM-Newton observations and initial data reduction, and the referee for a detailed report which improved the focus of the paper. KAP gratefully acknowledges the support of a Leverhulme Trust Emeritus Fellowship. SAV is supported on a PPARC research grant.
References
- [1] Antonucci R. 1993, ARAA, 31, 473
- [2] Arnaud K. A. 1996, ASP Conf. Series, 101, 17
- [3] Chartas G., Brandt W.N., Gallagher S.C., Garmire G.P. 2002, ApJ, 569, 179
- [4] Dickey J. M., Lockman F.J. 1990, ARA&A, 28, 215
- [5] Freeman P. E. et al. 1999, ApJ, 524, 753
- [6] Gallimore J. F., Baum S. A., O’Dea C. P., Brinks E., Pedlar A. 1996, ApJ, 462, 740
- [7] George I.M., Fabian A.C. 1991, MNRAS, 249, 352
- [8] Gierlinski M., Done C. 2004, MNRAS, 349, L7
- [9] Greenhill L. J., Gwinn C.R., Antonucci R., Barcainis R. 1996, ApJ, 472, L21
- [10] Guainazzi M., Matt G., Perola G. C. 2005, A&A, 444, 119
- [11] Hatchett S., Weaver R. 1977, ApJ, 215, 285
- [12] Huchra J.P., Vogeley M.S., Geller M.J. 1999, ApJS, 121, 287
- [13] Iwasawa K., Fabian A. C., Matt G. 1997, MNRAS, 289, 443
- [14] Kinkhabwala A. et al. 2002, ApJ, 575, 732
- [15] Laor A. 1997, ApJ, 477, 94
- [16] Magdziarz P., Zdziarski A.A. 1995, MNRAS, 273, 837
- [17] Marconi A., Risaliti G., Gilli R. 2004, MNRAS, 351, 169
- [18] Marshall F. E et al. 1993, ApJ, 405, 168
- [19] Matt G., Brandt W.N., Fabian A.C. 1996, MNRAS, 280, 823
- [20] Matt G. et al. 1997, A&A, 325, L13
- [21] Matt G., Fabian A.C., Reynolds C.S. 1997, MNRAS, 289, 175
- [22] Matt G. 2002, MNRAS, 337, 147
- [23] Matt G., Bianchi S., Guainazzi M., Molendi S. 2004, A&A, 414, 155 (M04)
- [24] Miller J. S, Goodrich R.W., Matthews W.G. 1991, ApJ, 378, 47
- [25] Molendi S., Bianchi S., Matt G. 2003, MNRAS, 343, L1
- [26] Nandra K., Pounds K.A. 1994, MNRAS, 268, 405
- [27] O’Brien P.T., Reeves J.N., Simpson C., Ward M.J. 2005, MNRAS, 360, L25
- [28] Ogle P.M., Brookings T., Canizares C. R., Lee J. C., Marshall H. L. 2003, A&A, 402, 849
- [29] Pounds K. A., Done C., Osborne J.E. 1995, MNRAS, 277, 5P
- [30] Pounds K.A., Reeves J.N., King A.R., Page K.L., O’Brien P.T., Turner M.J.L. 2003, MNRAS, 345, 705
- [31] Pounds K. A., Reeves J. N., King A. R., Page K. L. 2004a, MNRAS, 350, 10
- [32] Pounds K. A., Reeves J. N., Page K. L., O’Brien P. T. 2004b, ApJ, 616, 696
- [33] Pounds K. A., Page K. L. 2005, MNRAS, 360, 1123 (P05)
- [34] Pounds K. A., Wilkes B. J., Page K. L. 2005b, MNRAS, 362, 784
- [35] Pounds K.A., Vaughan S., King A.R. 2006, in preparation
- [36] Protassov R., van Dyk D. A., Connors A., Kashyap V. L., Siemiginowska A. 2002, ApJ, 571, 545
- [37] Sako M., Kahn S. M., Paerels F., Liedahl D. A. 2000, ApJ, 543, L115
- [38] Sivia D. S., 1996, Data Analysis: A Bayesian Tutorial, Oxford Univ. Press (Oxford)
- [39] Sivia D. S., Carlile C. J. 1992, J.Chem.Phys., 96, 170
- [40] Spinoglio L., Malkan M.A. 1989, ApJ, 342, 83
- [41] Storchi-Bergmann T., Mulchaey J. S., Wilson A. S. 1992, ApJ, 395, L73
- [42] Strüder L.et al. 2001, A&A, 365, L18
- [43] Turner M. J. L. et al. 2001, A&A, 365, L27
- [44] Turner T. J, Pounds K. A. 1989, MNRAS, 240, 833
Appendix A Bayesian analysis
The excess emission at 6–8 keV shown in the continuum fit to the NGC 1068 EPIC spectrum (figure 2) has been resolved into more and more components as better data have become available. A BBXRT observation (Marshall et al. 1993) suggested 3 components, identified with Fe K, He and Ly, a view supported by an ASCA observation from which Iwasawa et al. (1997) added a fourth component identified with the Compton shoulder of the Fe K line. Making first use of the present XMM-Newton data Matt04 analysed the pn spectrum between 4–10 keV and identified a total of 9 lines, 5 from cold and 4 from warm matter.Our analysis resolved a similarly complex spectrum and we examine the statistical basis for such spectral line fits in this Appendix.
Justifying the number of lines included in a spectral fit is a challenging problem for classical (i.e. frequentist) statistics. Given an X-ray spectrum comprising a continuum and a “few” emission lines, how many lines are there and what are their energies and strengths? Fortunately there is a Bayesian solution to this problem that gives the relative probabilities of there being lines in a given spectrum. The method was discussed in detail by Sivia & Carlile (1992; see also section 4.2 of Sivia 1996), where it was applied to molecular spectroscopy data. We briefly review the method before presenting its results.
We require the posterior probability, denoted , of there being lines in a spectrum based on an analysis of the data array , where symbolises all the background information necessary for the analysis (i.e., that the data have Gaussian errors, how to specify the continuum model, and that the instrument calibration is well understood). In order to calculate we employ Bayes theorem to “invert” the integrated likelihood , which itself can be derived using the results of standard maximum likelihood (ML) analysis (in this case -minimisation).
The procedure works by adding lines to the model one at a time, obtaining the ML solution each time, and recording the number of parameters, the and covariance matrix of the fit. Initially the model is fitted, i.e. the underlying continuum model (in this case an absorbed power law and PEXRAV cold reflection continuum). Then a Gaussian of fixed width is added to the model and the change in is measured as the line energy is stepped through the range keV in keV intervals, allowing the normalisation to vary at each position. The line energy giving the minimum is taken to be a good initial guess for the ML line energy, and the model is then fitted, starting from this position, to find the best . The process is repeated, at each successive iteration adding one more line. For each value of the following expression is evaluated:
| (1) |
The term represents the volume of parameter space searched in order to find lines, where and are the lower and upper energy bounds placed on the lines ( and keV, respectively) and ph cm-2 s-1 is the maximum normalisation allowed in the fit. Together these prescribe our prior ignorance about the line energies and normalisations, i.e. prior to examining the data we make the most least-informed assumption and consider lines to be equally probable anywhere in the range with any normalisation . In the calculation of this term effectively acts as a penalty for adding extra parameters in the model, enacting “Occam’s razor.”
The term gives the integrated likelihood of the data given a model containing lines and free parameters (in our case since the continuum has three free parameters and each Gaussian line has two). The likelihood value at the best fit is . The implicit assumption is that the likelihood surface can be approximated by a -dimensional Gaussian, and this expression is then the integral of that Gaussian with a peak of and a shape (widths) defined by the covariance matrix , calculated using the Laplace approximation111The validity of this assumption can be checked by comparing the errors on each parameter calculated from the diagonal elements of the covariance matrix, , with the errors calculated using a criterion. If the two error estimates are in agreement for each parameter then the likelihood surface is Gaussian and the Laplace approximation is valid..
Finally, the factor of simply accounts for the degeneracy in the fit: the order of the lines is irrelevant and so there are identical maxima in the likelihood space corresponding to all the possible permutations.
Once we have computed for we can then normalise them such that . In doing so we have implicitly assigned an equal prior probability to the each value of , in other words we admit total ignorance about the number of lines in the spectrum except to define an upper limit (in this case ). No value of is any more probable than any other. This factor, , is present in the constant of proportionality above but can be ignored since the results are normalised.

Using Xspec to fit in sequence lines to the data, including a power law plus cold reflection continuum, the above method was applied to the keV EPIC pn spectrum of NGC 1068. For each model the posterior probability was calculated, and the results are shown in figure 8. The most probable number of lines is but there is little to favour this over or lines. However, lines are quite strongly preferred over fewer lines, with odds of . There is also no evidence to favour more lines, with odds of against there being more than lines.
This method therefore provides reliable evidence for at least and as many as separate line-like emission components in the EPIC spectrum of NGC 1068, and is free from the statistical problems often associated with detecting emission lines (see discussion in Protassov et al. 2002). In passing we note that Freeman et al. (1999) previously used essentially the same method (based on identical logic) to assess the evidence for absorption lines in the X-ray spectra of a -ray burst.