Neutron-capture elements in the very metal-poor star HD 12256311affiliation: Based on data collected at the Subaru Telescope, which is operated by the National Astronomical Observatory of Japan.
Abstract
We obtained high resolution, high S/N spectroscopy for the very metal-poor star HD 122563 with the Subaru Telescope High Dispersion Spectrograph. Previous studies have shown that this object has excesses of light neutron-capture elements, while its abundances of heavy ones are very low. In our spectrum covering 3070 – 4780 Å of this object, 19 neutron-capture elements have been detected, including seven for the first time in this star (Nb, Mo, Ru, Pd, Ag, Pr, and Sm). Upper limits are given for five other elements including Th. The abundance pattern shows a gradually decreasing trend, as a function of atomic number, from Sr to Yb, which is quite different from those in stars with excesses of r-process elements. This abundance pattern of neutron-capture elements provides new strong constraints on the models of nucleosynthesis responsible for the very metal-poor stars with excesses of light neutron-capture elements but without enhancement of heavy ones.
1 Introduction
The chemical composition of extremely metal-poor stars is expected to reflect the yields from a quite small number of nucleosynthesis processes. Recent abundance analyses for extremely metal-poor stars have provided quite valuable information on the origin of the elements, (in particular when combined with Galactic chemical evolution studies, e.g., Ishimaru & Wanajo, 1999; Ishimaru et al., 2004), and the individual nucleosynthesis processes involved.
The rapid neutron capture process (r-process) is known to be responsible for about half of the abundances of elements heavier than the iron-group in solar system material. Although observational data have been rapidly increasing in the past decade, the astrophysical site of the r-process is still unclear. Previous nucleosynthesis studies suggest several possibilities, e.g., neutrino-driven winds (Woosley et al., 1994; Wanajo et al., 2001) or prompt explosions (Sumiyoshi et al., 2001; Wanajo et al., 2003) of core-collapse (Type II/Ibc) supernovae, neutron star mergers (Freiburghaus et al., 1999), jets from gamma-ray burst accretion discs (Surman et al., 2005). All the scenarios proposed above involve, however, severe problems that remain to be solved, and no consensus has yet been achieved.
Models of the r-process nucleosynthesis are usually examined by comparison with the abundance pattern of the r-process component in solar-system material. Recent measurements for abundances of neutron-capture elements in very metal-poor stars have been providing useful constraints on these models. Sneden et al. (1996, 2003) have studied the chemical abundances of the extremely metal-poor star CS 22892–052, the first example of a small but growing class of metal-poor stars that exhibit very large excesses of r-process elements relative to iron ([r-process/Fe] ). An important result of their work is that the relative abundance pattern of the neutron-capture elements from the 2nd to the 3rd peak (56 Z 76) in this star is identical, within observational errors, to that of the (inferred) solar system r-process component. This phenomenon is sometimes referred to as “universality” of the r-process, having a large impact on the studies of the nature of the r-process, and its astrophysical site.
However, the abundance patterns of light neutron-capture elements (38 Z 48) in r-process enhanced stars exhibit clear deviations from that of the solar system r-process component (Sneden et al., 2000). This suggests the existence of another r-process site which has contributed to the light r-process elements in solar-system material. This process is sometimes called as “weak r-process”, while the process that is responsible for heavy neutron-capture elements (Ba U) is referred to “main r-process” (e.g., Truran et al., 2002; Wanajo & Ishimaru, 2005).
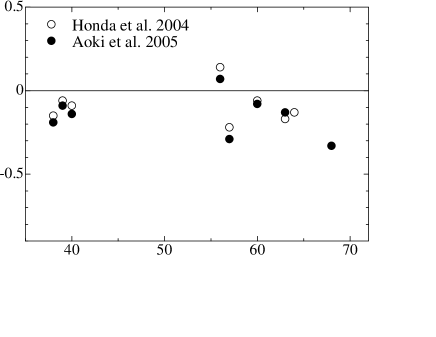
Following the previous studies (e.g., Burris et al., 2000; Truran et al., 2002), Honda et al. (2004) and Aoki et al. (2005) have investigated the correlation of Sr and Ba abundances in very metal-poor stars ([Fe/H] ) in some detail. They showed that the dispersion of the Sr abundances clearly decreases with increasing Ba abundance. This correlation indicates the existence of (at least) two processes: one enriches both heavy and light neutron-capture elements, while the other yields light neutron-capture elements with only small production of heavy ones. Travaglio et al. (2004) discuss the contribution of a primary process which has produced light neutron-capture elements in our Galaxy.
The abundance patterns produced by the main r-process have been studied previously based on high resolution spectroscopy of metal-poor stars (e.g., Sneden et al., 1996, 2003; Hill et al., 2002) as mentioned above. By way of contrast, the abundance pattern of neutron-capture elements produced by the weak r-process is still unclear. Since the abundances of heavy neutron-capture elements yielded by this process are very low, it is quite difficult to accurately measure their abundances in metal-poor stars. In addition, most spectral lines of light neutron-capture elements, in particular those with exist in the near-UV region, in which atmospheric extinction makes the observation with ground-based telescopes difficult.
We have been investigating light neutron-capture elements in very metal-deficient stars from near-UV spectroscopy with the 8.2 m Subaru Telescope. Ishimaru et al. (2006, in preparation) studied the abundances of Pd and Ag, which exist between the first and second abundance peaks produced by neutron-capture processes, for several metal-poor stars. One of the targets is HD 122563, a well-studied bright metal-poor ([Fe/H] ) giant. This object has very low abundances of heavy neutron-capture elements (e.g. [Ba/Fe] Honda et al., 2004), while light neutron-capture elements show large excesses relative to heavy ones (e.g. [Sr/Ba] ). Therefore, the abundance pattern of neutron-capture elements in this star might well represent the yields of the process producing light neutron-capture elements at low metallicity.
In this paper we report the abundance pattern of light and heavy neutron-capture elements in HD 122563. In §2 we present our near-UV spectroscopy with Subaru/HDS, while we describe in detail the abundance analysis of neutron-capture elements in §3. Our results are compared with the previous studies in §4. We discuss the derived abundances of HD 122563, and the source of neutron-capture elements in §5. Finally, our conclusions are presented in §6.
2 Observations and measurements
High Dispersion Spectroscopy of HD 122563 was carried out with the Subaru Telescope High Dispersion Spectrograph (HDS: Noguchi et al., 2002) in 30 April, 2004. Our spectrum covers the wavelength range from 3070 to 4780 Å with a resolving power of = 90,000. The total exposure time is 5400 seconds (one 600 s exposure plus four 1200 s ones). The reduction was carried out in a standard manner using the IRAF echelle package111IRAF is distributed by National Optical Astronomy Observatories, which are operated by the Association of Universities for Research in Astronomy, Inc., under cooperative agreement with the National Science Foundation. The signal to noise ratio (S/N) of the spectrum (per 0.9 km s-1 pixel) estimated from the photon counts is 140 at 3100 Å; 480 at 3500 Å; 860 at 3900 Å; 1080 at 4200 Å and 1340 at 4500 Å.
In order to measure Ba lines at 5853 Å and 6141 Å, a spectrum obtained during the HDS commissioning covering 5090Å – 6410Å was used. The S/N ratio of this spectrum is 350 at 6000 Å.
We adopted the line list used in previous studies for
line identifications and analyses of neutron-capture
elements (e.g., Hill et al., 2002; Cowan et al., 2002; Sneden et al., 2003; Johnson & Bolte, 2004).
In addition, the recent measurements of transition
probabilities and hyperfine splitting reported for some
elements (e.g., Lawler et al., 2001a, b; Den Hartog et al., 2003) are incorporated.
The line list used in the analysis is given in Table 1.
Equivalent widths of clean, isolated lines are measured by fitting
gaussian profile.
The results are given in Table 1.
3 Abundance analysis
For our quantitative abundance measurements, we used the analysis program SPTOOL developed by Y. Takeda, based on Kurucz’s ATLAS9/WIDTH9 (Kurucz, 1993). SPTOOL calculates synthetic spectra and equivalent widths of lines on the basis of the given model atmosphere, line data, and chemical composition, under the assumption of LTE.
We adopted the model atmosphere parameters (effective temperature: , gravity: , micro-turbulent velocity: , and metallicity: [Fe/H]) derived by Honda et al. (2004): = 4570 K, = 1.1, = 2.2 km s-1, and [Fe/H] . The estimated uncertainties are = 100 K, = 0.3 dex, = 0.5 km s-1, and [Fe/H] = 0.19 dex (Honda et al. 2004).
The abundance analyses were attempted for 24 neutron-capture elements from Sr to Th. The effects of hyperfine and isotopic splitting are taken into account in the analysis of Ba, La, Eu, and Yb (see references in Table 1).
The derived abundances are given in Table 2. The abundances determined from individual lines are given in Table 1. We used the solar system abundances obtained by Asplund et al. (2005) to derive [X/Fe] values. The size of the random errors are estimated from the standard deviation (1) of the abundances derived from individual lines for elements that have three or more lines available for the abundance analysis. For the abundances of elements based only on one or two lines, we employ the mean of the random errors estimated from those elements with three or more lines available.
The uncertainties of model atmosphere parameters result in systematic errors in the abundances of neutron-capture elements. The effects of these uncertainties on the abundance measurements are given in Table 3. The behavior of the errors is slightly different for abundances derived from neutral species and those from ionized ones. This should be borne in mind in the discussion on the abundances of light neutron-capture elements, some of which were determined using lines of neutral species. By contrast, such differences do not significantly affect our discussion of the abundance ratios of heavy neutron-capture elements, which were all measured from ionized species.
The details of the analysis for individual neutron-capture elements are presented below. For comparison purposes, the abundances of Cu and Zn were also determined. In addition to the Cu 5105 Å and Zn 4810 Å lines, the UV lines (3250 - 3350 Å) are also used in the abundance analyses (Table 1).
3.1 Light neutron-capture elements ()
Although the abundances of Sr, Y, and Zr have been determined by a number of previous studies for HD 122563, measurements for other light neutron-capture elements are quite limited so far. We have newly detected 5 elements (Nb, Mo, Ru, Pd, and Ag) in our spectrum, and derived an upper limit for a sixth element (Rh).
Two strong lines of Sr II (4077 and 4215Å) and the weak line of Sr I (4607Å) were measured. The two Sr II resonance lines are so strong that the abundance derived from these lines is sensitive to the microturbulent velocity and treatment of damping. However, the agreement of the abundances derived from Sr II and Sr I (see Table 1) suggests the reliability of our measurements.
Two Nb II () lines are detected. The detection of the 3163Å line is reported only for Canopus by Reynolds et al. (1988) and for the sun. This line would be useful for abundance analyses because of its strength (Figure 1). We note, however, that the abundance determined from this line is slightly higher (by 0.25 dex) than that from the 3215 Å line, possibly suggesting a small contamination by other spectral features. However, here we simply adopt the mean of the abundances derived from the two lines.
The Mo I () 3864 Å line is detected in CS 22892-052 by Sneden et al. (2003). Although a blend of a CN line is reported by these authors, that is not severe in HD 122563, because the carbon abundance of this star is more than 1 dex lower than that of CS 22892–052.
We have detected two lines of Ru I (). The equivalent width of the 3498 Å line is measurable due to there being no (apparent) blend with other lines. Since a strong Fe I line exists in the bluer region of the other line at 3728 Å, we applied the spectrum synthesis technique to the analysis of that line.
The Rh I () 3692 Å line exists in the wing of H I line, but is not detected in our spectrum. We determined only an upper limit on the abundance of this element.
We have detected two lines of Pd. The Pd I 3242 Å line blends with OH lines. The contamination was estimated using the OH line list of Kurucz (1993), adjusting the oxygen abundance to match the strengths of neighboring OH lines ([O/Fe] 0.4). The Pd I 3404 Å line is clearly detected with no severe blend (Figure 1).
Two Ag I lines have been measured in some metal-poor stars. The Ag I 3280 Å line is detected, while the 3383 Å line is not. Since NH lines blend with the 3280 Å line (Johnson & Bolte, 2002), we included the NH lines adopted from Kurucz (1993) in the spectrum synthesis, calibrating the N abundance to reproduce the NH features around the Ag I line ([N/Fe]). We note that the N abundance adopted is much lower than those derived by previous works (e.g.,[N/Fe] Westin et al., 2000). This discrepancy is partially due to the inaccurate gf-values used in our analysis. Recent studies of N abundances based on NH lines applied corrections of gf-values to the Kurucz’s list (e.g., Ecuvillon et al., 2004).
In addition to the NH lines, some unidentified feature appears in the red part of this Ag I line (Figure 1). If such unknown lines also affect the Ag I line, the values derived from this line must be regarded as an upper limit on the Ag abundance.
3.2 Heavy neutron-capture elements ()
The abundances of Ba, La, Eu, and Yb were derived by a spectrum synthesis technique, taking into account hyperfine splitting. The abundances of other elements were determined by applying a single line approximation, which is justified by the fact that the absorption lines are quite weak in general.
In addition to the two resonance lines at 4554 and 4934 Å, two Ba lines in the red region were measured. The line data of McWilliam (1998) were used for the analysis of Ba lines, assuming the isotope ratios of r-process component in solar-system material. There is a small discrepancy between the Ba abundances from the two resonance lines and others. A possible reason for this discrepancy is the non-LTE effect (e.g., Asplund, 2005). However, we here simply adopt the average of the Ba abundances from the four lines.
We detected three Eu II lines at 3819 Å, 4129 Å and 4205 Å. However, the 4205 Å line blends with a V I line, while the 3819 Å one is affected by a wing component of a strong Fe line at 3820 Å. Since these Eu lines are quite weak in the spectrum of HD 122563, in contrast to those in r-process enhanced stars, the effect of the blending is significant. Hence, we adopt the result from the 4129 Å. We note that the Eu abundances derived from the excluded lines, within their relatively large errors, agree with the value from the 4129 Å line.
The effect of isotope shift for Gd lines was included in the analysis by Johnson & Bolte (2004) for the s-process enhanced star CS 31062-050. This effect is, however, neglected in the present analysis, because the Gd lines of HD 122563 are very weak. We have detected three Gd lines (Table 1). The Gd abundance derived from the 3481 Å line is significantly higher than those from the other two, and an upper limit estimated from another line (3331 Å). We regard this as a result of contamination of the 3481 Å line by some unidentified lines, and exclude this line in the determination of the final Gd abundance.
Yb is the heaviest element detected in our spectrum. We measured two Yb lines at 3220Å and 3694Å. A spectrum synthesis technique was applied to the analysis including the effect of hyperfine splitting for these lines (Sneden et al. 2003, private communication). Agreement of the results from the two lines is fairly good.
The upper limits of Ir and Th abundances are obtained from the analyses of Ir I 3800 Å and Th II 4019 Å line. The line of Th II 4019 Å is affected by contamination by other lines (Figure 2). We analyzed this line using the line list of Johnson & Bolte (2001) for this wavelength region. We adopted 12C/13C = 5 to estimated the blending of 13CH lines. Since the blends of Fe and Co lines are severe, no clear Th feature is identified, although the quality of the spectrum is very high (S/N = 950 at 4020 Å). We derived the upper limit of the Th abundance (log (Th) ) from the fitting of synthetic spectra by eye.
4 Comparisons with previous studies
Neutron-capture elements have been studied for this object by many authors. Recently, Westin et al. (2000), Johnson & Bolte (2001), Honda et al. (2004), and Aoki et al. (2005) performed detailed abundance analyses based on high resolution spectroscopy () for this object. Burris et al. (2000) also determined the abundances of eight neutron-capture elements, though their resolving power () is not as high as those in the above studies. Recently, Cowan et al. (2005) derived the abundances of Ge, Zr, La and Eu from the UV region (2410 3070 Å) of this object using Hubble Space Telescope, and also UV-Blue region (3150 4600 Å) with Keck I HIRES.
Figure 3 shows comparisons of the abundances of neutron-capture elements derived by the present analysis with those of previous work. Our results are in good agreement with Johnson & Bolte (2002), Honda et al. (2004) and Aoki et al. (2005). However, the abundances of neutron-capture elements determined by the present analysis are systematically lower than those by Westin et al. (2000) and Burris et al. (2000). Here we inspect the discrepancy between the results of Westin et al. (2000) and ours in some detail, because their work determined abundances of a larger number of elements than Burris et al. (2000), and they reported the equivalent widths used in the abundance analysis for some lines (unfortunately, the equivalent widths were not given for the lines for which spectrum synthesis technique was applied).
The atmospheric parameters adopted in our analysis are in good agreement with theirs: the differences (our results minus those of Westin et al. (2000)) of , , [Fe/H] and are +70 K, –0.2 dex, –0.07 dex and –0.3 km s-1, respectively. These differences results in differences of abundances smaller than 0.1 dex for heavy neutron-capture elements (see Table 3). Therefore, the difference of the adopted atmospheric parameters is not a reason for the abundance discrepancy.
We also found good agreements in the equivalent widths of the lines reported by both works. However, the value of the Nd 4061 Å line used by Westin et al. (2000) is lower by 0.25 dex than ours. Though the values of La adopted by the two works are quite similar, no information on the treatment of the hyperfine splitting was given by Westin et al. (2000), while the effect is fully included in our analysis. We adopted recent line data for La II (Lawler et al., 2001a) and Nd II (Den Hartog et al., 2003), which should be more accurate than those used by Westin et al. (2000). Thus, the discrepancy between the results of the two work might be partially explained by the difference of the adopted line data. However, there seems to exist small (0.2 dex) systematic differences, for which no clear reason is identified.
5 Discussion
We investigated a high quality UV-blue spectrum of HD 122563, and have detected 19 neutron-capture elements including Nb, Mo, Ru, Pd, Ag, Pr, and Sm, which are detected for the first time by our study for this object, and upper-limits for 5 elements including Th. The derived abundances are given in Table 2. In this section, we discuss the abundance pattern of the neutron-capture elements, along with Cu and Zn, to investigate the origin of neutron-capture elements in this object.
5.1 Overall abundance pattern of neutron-capture elements
The abundance ratio between Ba (or La) and Eu is used as an indicator of the origin of neutron-capture elements. The value of [Ba/Eu] of the solar system r-process component is –0.81, while that of the s-process component is +1.45 (Burris et al., 2000). The value of the [Ba/Eu] is –0.50 in HD 122563. In addition, the value of [La/Eu] of the solar system r-process component is –0.59, while that in HD 122563 is –0.50. These results indicate that the heavy ( 56) neutron-capture elements of this object are principally associated with the r-process, and the contribution of the (main) s-process is small if any. We recall that this object is very metal-poor ([Fe/H]) with no excess of carbon ([C/Fe]=).
Figure 4 shows the abundance pattern of HD 122563, comparing with that of the solar-system r-process component. The solar system r-process abundance pattern is scaled to the Eu abundance of HD 122563. This figure clearly shows that the abundances of light neutron-capture elements (38 Z 47) are much higher than those of heavy ones in HD 122563, compared to the solar-system r-process pattern. This behavior is very different from that found in r-process enhanced stars (e.g. CS 22892-052, CS 31082-001: Sneden et al., 2003; Hill et al., 2002). Although we indicated above that the heavy neutron-capture elements are principally associated with the r-process, Figure 4 indicates that even in the range 56 59 the abundances in HD 122563 exceed those of the scaled solar r-process, with only La falling on the Eu-normalised curve. This suggests that the tendency for the light neutron-capture elements (38 47) to fall above the scaled solar r-process curve is part of a general, atomic-number dependent, trend.
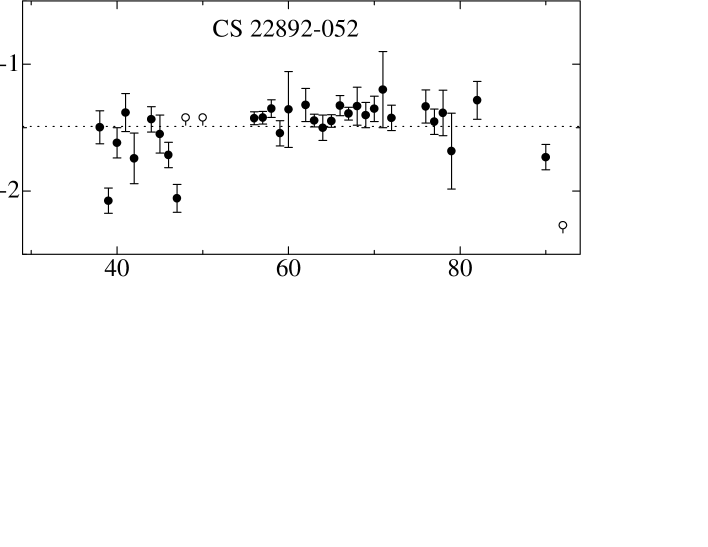
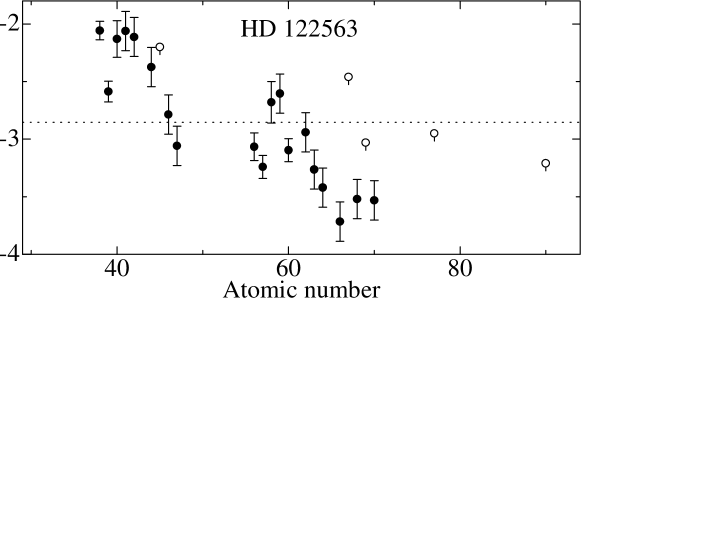
In order to demonstrate this behavior more clearly, Figure 5 shows the logarithmic difference of the abundances of this object from the solar system r-process pattern as a function of atomic number. We also show that of the r-process enhanced star CS 22892-052 (Sneden et al., 2003) in the same way. We find good agreement between the abundance pattern of CS 22892-052 and the solar-system r-process one, at least for elements with 56. By way of contrast, our new measurements for HD 122563 clearly demonstrate a quite different abundance pattern from that of the solar-system r-process component and of CS 22892–052.
The excess of light neutron-capture elements (e.g. Sr) with respect to the heavy ones (e.g. Ba) was known for HD 122563 by previous studies (see section 1). However, the abundances of elements having intermediate mass (e.g. Mo, Pd) were measured in detail for the first time by the present work. The abundances of these elements are intermediate, and, hence, the abundances of neutron-capture elements gradually and continuously decrease with increasing atomic number from to . This trend is a key to investigating the nucleosynthesis process that is responsible for neutron-capture elements in this object.
For comparison purposes, we also attempted to compare the abundances of HD 122563 with the solar system s-process distribution (Figure 6). In this case, Ba, La, Ce, and Eu show large deviations from the solar system s-process curve, although the overall abundance pattern from Sr to Yb seems to be similar. Since the s-process abundance pattern in the solar-system is a result of a combination of some individual processes (at least the weak and main components of the s-process), we presume this apparent “agreement” is physically not important.
We also have detected four neutron-capture elements heavier than Eu (Gd, Dy, Er, Yb: 64). The abundances of these elements also show a decreasing trend as a function of atomic number, with respect to the solar-system r-process pattern. This also has an impact on the understanding of the origin of neutron-capture elements in this object. Th is a radioactive element and is synthesized only by the r-process. The upper limit of the Th abundance determined by the present work indicated that this object does not show an excess of Th with respect to Eu (and other heavy neutron-capture elements), compared to most r-process enhanced stars.
The Cu and Zn abundances of HD 122563 are typical values found in very metal-poor stars (e.g., Johnson, 2002; Cayrel et al., 2004). That is, no clear difference is found in the abundances of these elements between the stars having high and low abundances of light neutron-capture elements. This result may give a hint for the origins of Cu and Zn, as well as of light neutron-capture elements, which are still unclear.
5.2 What is the source of neutron-capture elements in HD 122563 ?
Here we consider the origin of neutron-capture elements in this object based on the abundance pattern determined by the present work.
5.2.1 Light neutron-capture elements
The abundance ratios between light and heavy neutron-capture elements (e.g., Sr/Ba) in HD 122563 are clearly different from those in r-process enhanced stars, as already mentioned in §1. Therefore, the r-process responsible for the heavy neutron-capture elements in the Solar System (the so-called “main” r-process) is not an important source of, at least, light neutron-capture elements in HD 122563. The main s-process is also excluded from the possible source of light neutron-capture elements, because that yields even lower abundance ratios between light and heavy neutron-capture elements at low metallicity (e.g. Busso, Gallino & Wasserburg, 1999; Aoki et al., 2002).
The weak component of the s-process was introduced to interpret the light s-process nuclei in the Solar System. However, the gradually decreasing trend of elemental abundances from Sr to Ba found in HD 122563 does not resemble that of the weak s-process, which predicts a rapid drop of abundances at (i.e. Y or Zr). It should be noted in addition that the weak s-process is expected to be inefficient at low metallicity, because of the lack of the neutron source 22Ne (e.g. Prantzos et al., 1990; Raiteri et al., 1993) in addition to the lack of iron seeds.
Thus, another process that has efficiently yielded light neutron-capture elements at low metallicity is required to explain the abundance pattern of neutron-capture elements in HD 122563. The presence of such a process has been indicated by recent observational studies of metal-deficient stars with no excess of heavy neutron-capture elements (Aoki et al., 2005, and references therein). This process was called the “Light Element Primary Process” (LEPP) by Travaglio et al. (2004), who estimated its contribution to the solar abundances. Wanajo et al. (2001) have shown that such light r-process nuclei (up to ) are produced in neutrino winds as a result of “weak” (or failed) r-processing (see also Wanajo & Ishimaru, 2005). It is likely, therefore, that these light neutron-capture elements originate from the core-collapse supernovae, although a contribution from other sources cannot be excluded. The abundance pattern of light to heavy neutron-capture elements measured for HD 122563 provides a unique constraint on such model calculations.
5.2.2 Heavy neutron-capture elements
The abundance pattern of heavy neutron-capture elements of HD 122563 shows a significant departure from the r-process component in solar-system material, though the departure is not as large as that found for light neutron-capture elements (Figure 4). Figure 7 shows a comparison between the abundances of elements with measured for HD 122563 (filled circles) and the Solar-System r-process abundance pattern (Burris et al., 2000), which is scaled to achieve the best fit to the observed data (the solid line). (Recall that the scaling in Figure 4 was to Eu.) Significant disagreements are found for Ce and Pr, as well as for Dy, Er and Yb. Given the fact that the abundance patterns of heavy elements measured for r-process enhanced stars show excellent agreement with that of the Solar-System, the different abundance pattern of HD 122563 must be significant. Some process that produces a different abundance pattern of heavy neutron-capture elements from that of the main r-process is at least required to explain the abundance pattern of this star.
One possibility is to assume a small contribution of the (main) s-process. In order to examine this possibility, we adopted the r-process and s-process abundance patterns in the Solar-System as determined by Burris et al. (2000), and searched for the combination that gives the best fit to the abundance pattern of HD 122563. The result is shown by the dashed line in Figure 7. In this case, the contributions of the s-process to Ba, La, and Ce are significant ( 70%), while those to elements heavier than Nd are small ( 10%). It should be noted that such a small contribution of the main s-process does not affect the abundance pattern of light neutron-capture elements discussed in the previous subsection.
The root-mean-square (rms) of the logarithmic abundance difference between the observed and calculated abundance patterns is 0.29 dex for the case that a contribution from the s-process is introduced, compared with 0.34 dex if only the r-process is assumed. Thus, the fit is slightly better if an s-process contribution is introduced. However, the improved fit comes at the cost of an additional free parameter (the relative contribution of the s- and r-processes), and it is not clear that assuming an s-process contribution is justifiable from the point of view of the star’s nucleosynthetic history. In particular, the discrepancy found in the abundance pattern of elements heavier than Sm cannot be explained by this approach, because the production of such heavy elements by the s-process is very small.
This discrepancy leads us to consider an alternative possibility that the heavy neutron-capture elements of this star are also a result of the unidentified (single) process that is responsible for the large enhancement of the light neutron-capture elements discussed in § 5.2.1. Wanajo et al. (2001) have suggested that the small (but non-negligible) amount of heavy r-process nuclei () with non solar r-process abundance pattern can be produced in neutrino winds if the entropy of the neutrino-heated matter is enough high (but smaller than that required for the main r-process), in addition to the light r-process nuclei. If this is true, the abundance pattern of heavy neutron-capture elements in this object may give another hint for, or constraint on, the modeling of this process.
The differences between the abundance patterns of heavy neutron-capture elements in HD 122563 and the solar-system r-process abundance pattern are not large. Further observational data are clearly required to derive definitive conclusions. However, it would be very difficult to improve the measurement of abundances for HD 122563, because the quality of the spectrum used in the present work is extremely high. One possibility is to reconsider the atomic line data to reduce the uncertainties in abundance measurements. Another important observational study is to apply similar analysis to other metal-poor stars having high abundance ratios of light to heavy neutron-capture elements. In particular, measurements for stars with lower metallicity than HD 122563 are important, because no s-process contribution is expected for such stars.
6 Conclusions
We obtained a high resolution, high S/N UV-blue spectrum of the very metal-poor star HD 122563 with Subaru/HDS. The abundances were measured for 19 neutron-capture elements, among which seven elements are detected for the first time in this star. Our new measurements for HD 122563 clearly demonstrate that the elemental abundances gradually decrease relative to the scaled solar r-process abundances with increasing atomic number, at least from Sr to Yb. We have considered whether the higher abundances of lighter elements can be explained by contributions from the weak s- or main s-processes, and find these not to provide satisfactory explanations. The abundance pattern of elements with does not agree with any prediction of neutron-capture process models known. The abundance pattern of a wide range of neutron-capture elements determined for HD 122563 therefore provides new strong constraints on models of nucleosynthesis for very metal-poor stars, in particular those with excesses of light neutron-capture elements but without enhancement of heavy ones.
References
- Aoki et al. (2002) Aoki, W., et al. 2002, ApJ, 580, 1149
- Aoki et al. (2005) Aoki, W., et al. 2005, ApJ, 632, 611
- Asplund et al. (2005) Asplund, M., Grevesse, N., & Sauval, A. J. 2005, in ASP Conf. Ser. 336, Cosmic Abundances as Records of Stellar Evolution and Nucleosynthesis, ed. T. G. Barnes III & F. N. Bash (San Francisco: ASP), 25
- Asplund (2005) Asplund, M. 2005, ARA&A, 43, 481
- Burris et al. (2000) Burris, D. L., Pilachowski, C. A., Armandroff, T. E., Sneden, C., Cowan, J. J., & Roe, H 2000, ApJ, 544, 302
- Busso, Gallino & Wasserburg (1999) Busso, M., Gallino, R., & Wasserburg, G. J. 1999, ARA&A, 37, 239
- Cameron (2001) Cameron, A. G. W. 2001, ApJ, 562, 456
- Cayrel et al. (2004) Cayrel, R, et al. 2004, A&A, 416, 1117
- Cowan et al. (2002) Cowan, J. J., et al. 2002, ApJ, 572, 861
- Cowan et al. (2005) Cowan, J. J., et al. 2005, ApJ, 627, 238
- Den Hartog et al. (2003) Den Hartog, E. A., Lawler, J. E., Sneden, C. & Cowan, J. J. 2003, ApJS, 148, 543
- Ecuvillon et al. (2004) Ecuvillon, A., Israelian, G., Santos, N. C., Mayor, M., Garcia Lopez, R. J., & Randich, S. 2004, A&A, 418, 703
- Freiburghaus et al. (1999) Freiburghaus, C., Rosswog, S., & Thielemann, F. -K. 1999, ApJ, 525, L121
- Hill et al. (2002) Hill, V., et al. 2002, A&A, 387, 560
- Honda et al. (2004) Honda, S., et al. 2004, ApJ, 607, 474
- Ishimaru & Wanajo (1999) Ishimaru, Y. & Wanajo, S. 1999, ApJ, 511, L33
- Ishimaru et al. (2004) Ishimaru, Y., Wanajo, S., Aoki, W., & Ryan, S. G. 2004, ApJ, 600, L47
- Johnson & Bolte (2001) Johnson, J. A. & Bolte, M. 2001, ApJ, 554, 888
- Johnson (2002) Johnson, J. A. 2002, ApJS, 139, 219
- Johnson & Bolte (2002) Johnson, J. A. & Bolte, M. 2002, ApJ, 579, 616
- Johnson & Bolte (2004) Johnson, J. A. & Bolte, M. 2004, ApJ, 605, 462
- Kurucz & Bell (1995) Kurucz, R. L., & Bell. B 1995, Kurucz CD-ROM,No.23 (Harvard-Smithsonian Center for Astrophysics)
- Kurucz (1993) Kurucz, R. L. 1993, Kurucz CD-ROM,No.13 (Harvard-Smithsonian Center for Astrophysics)
- Lawler et al. (2004) Lawler, J. E., Sneden, C., & Cowan, J. J., 2004, ApJ, 604, 850
- Lawler et al. (2001a) Lawler, J. E., Bonvallet, G., & Sneden, C. 2001a, ApJ, 556, 452
- Lawler et al. (2001b) Lawler, J. E., Wickliffe, M. E., Den Hartog, E. A., & Sneden, C. 2001b, ApJ, 563, 1075
- McWilliam et al. (1995) McWilliam, A, Preston, G. W., Sneden, C, & Searle, L 1995, AJ, 109, 27
- McWilliam (1998) McWilliam, A 1998, AJ, 115, 1640
- Noguchi et al. (2002) Noguchi, K.,et al. 2002, PASJ, 54, 855
- Prantzos et al. (1990) Prantzos, N., Hashimoto, M., & Nomoto, K. 1990, A&A, 234, 211
- Sneden et al. (1996) Sneden, C., McWilliam, A., Preston, G. W., Cowan, J. J., Burris, D. L., & Armosky, B. J. 1996, ApJ, 467, 819
- Sneden et al. (2000) Sneden, C, Cowan, J. J., Ivans, I. I., Fuller, G. M., Burles, S, Beers, T. C., & Lawler, J. E. 2000, ApJ, 533L, 139
- Sneden et al. (2003) Sneden, C., et al. 2003, ApJ, 591, 936
- Sumiyoshi et al. (2001) Sumiyoshi, K., et al. 2001, ApJ, 562, 880
- Surman et al. (2005) Surman, R., McLaughlin, G. C., & Hix, W. R. 2005, submitted to ApJ(astro-ph/0509365)
- Raiteri et al. (1993) Raiteri, C. M., Gallino, R., Busso, M., Neuberger, D., & Kappeler, F. 1993, ApJ, 419, 207
- Reynolds et al. (1988) Reynolds, S. E., Hearnshaw, J. B., & Cottrell, P. L. 1988, MNRAS, 235, 1423
- Rosswog et al. (1999) Rosswog, S., Liebendorfer, M., Thielemann, F.-K., Davies, M. B., Benz, W., & Piran, T. 1999, A&A, 341, 499
- Travaglio et al. (2004) Travaglio et al. 2004, ApJ, 114, 1293
- Truran et al. (2002) Truran, J. W., Cowan, J. J., Pilachowski, C. A., & Sneden, C. 2002, PASP, 114, 1293
- Wanajo et al. (2001) Wanajo, S., Kajino, T., Mathews, G. J., & Otsuki, K. 2001, ApJ, 554, 578
- Wanajo et al. (2003) Wanajo, S., Tamamura, M., Itoh, N., Nomoto, K., Ishimaru, Y., Beers, T. C., & Nozawa, S. 2003, ApJ, 593,968
- Wanajo & Ishimaru (2005) Wanajo, S. & Ishimaru, I. 2005, Nucl. Phys. A, in press
- Westin et al. (2000) Westin, J., Sneden, C., Gustafsson, B., & Cowan, J. J. 2000, ApJ, 530, 783
- Woosley et al. (1994) Woosley, S. E., Wilson, J. R., Mathews, G. J., Hoffman, R. D., & Meyer, B. S. 1994, ApJ, 433, 229
| Wavelength | L.E.P.(eV) | log | log | W(mÅ) | ref |
| Cu I, | |||||
| 3247.53 | 0.000 | –0.060 | 1.04 | 115.1* | 8 |
| 3273.95 | 0.000 | –0.360 | 1.24 | 112.3 | 8 |
| 5105.55 | 1.390 | –1.520 | 0.66 | 3.3 | 2 |
| Zn I, | |||||
| 3302.98 | 4.030 | –0.057 | 2.07 | 20.3* | 1 |
| 3345.02 | 4.078 | 0.246 | 1.78 | 19.5* | 1 |
| 4722.15 | 4.030 | –0.390 | 2.09 | 14.5 | 5 |
| 4810.54 | 4.080 | –0.170 | 2.10 | 20.5 | 5 |
| Sr I, | |||||
| 4607.33 | 0.000 | 0.280 | –0.14 | 2.4 | 7 |
| Sr II, | |||||
| 4077.71 | 0.000 | 0.170 | –0.18 | 163.3 | 6 |
| 4215.52 | 0.000 | –0.170 | –0.03 | 155.6 | 6 |
| Y II, | |||||
| 3327.88 | 0.410 | 0.130 | –0.98 | 49.3* | 8 |
| 3549.01 | 0.130 | –0.280 | –0.97 | 49.0 | 7 |
| 3584.52 | 0.100 | –0.410 | –0.98 | 44.1* | 10 |
| 3600.74 | 0.180 | 0.280 | –1.06 | 68.2 | 7 |
| 3611.04 | 0.130 | 0.010 | –1.06 | 59.0 | 7 |
| 3628.70 | 0.130 | –0.710 | –0.90 | 31.8 | 10 |
| 3710.29 | 0.180 | 0.460 | –0.98 | 82.3 | 10 |
| 3747.55 | 0.100 | –0.910 | –0.98 | 22.8 | 7 |
| 3774.33 | 0.130 | 0.210 | –0.91 | 79.0 | 6 |
| 3788.70 | 0.100 | –0.070 | –0.95 | 66.6 | 6 |
| 3818.34 | 0.130 | –0.980 | –0.74 | 29.4 | 6 |
| 3950.36 | 0.100 | –0.490 | –0.94 | 47.4 | 6 |
| 4398.01 | 0.130 | –1.000 | –0.82 | 28.0 | 6 |
| 4883.69 | 1.080 | 0.070 | –0.82 | 25.0 | 6 |
| 5087.43 | 1.080 | –0.170 | –0.91 | 13.8 | 6 |
| Zr II, | |||||
| 3438.23 | 0.090 | 0.420 | –0.57 | 76.8* | 7 |
| 3457.56 | 0.560 | –0.530 | –0.17 | 27.3 | 7 |
| 3479.02 | 0.530 | –0.690 | –0.34 | 16.7 | 7 |
| 3479.39 | 0.710 | 0.170 | –0.40 | 40.2* | 7 |
| 3499.58 | 0.410 | –0.810 | –0.48 | 13.6* | 7 |
| 3505.67 | 0.160 | –0.360 | –0.42 | 47.0* | 7 |
| 3536.94 | 0.360 | –1.310 | –0.33 | 7.6* | 7 |
| 3551.96 | 0.090 | –0.310 | –0.35 | 57.3* | 8 |
| 3573.08 | 0.320 | –1.040 | –0.26 | 16.4 | 7 |
| 3578.23 | 1.220 | –0.610 | –0.29 | 3.8* | 7 |
| 3630.02 | 0.360 | –1.110 | –0.28 | 12.8 | 7 |
| 3714.78 | 0.530 | –0.930 | –0.25 | 13.6 | 7 |
| 3836.77 | 0.560 | –0.060 | –0.31 | 47.3 | 6 |
| 3998.97 | 0.560 | –0.670 | 0.07 | 36.1 | 7 |
| 4050.33 | 0.710 | –1.000 | –0.09 | 11.0 | 7 |
| 4208.98 | 0.710 | –0.460 | –0.16 | 27.1 | 6 |
| 4317.32 | 0.710 | –1.380 | –0.08 | 5.3 | 6 |
| Nb II, | |||||
| 3163.40 | 0.376 | 0.260 | –1.30 | 24.2* | 1 |
| 3215.59 | 0.440 | –0.190 | –1.65 | 4.5* | 6 |
| Mo I, | |||||
| 3864.10 | 0.000 | –0.010 | –0.87 | 3.3 | 8 |
| Ru I, | |||||
| 3498.94 | 0.000 | 0.310 | –0.90 | 4.1 | 6 |
| 3728.03 | 0.000 | 0.270 | –0.82 | 4.7* | 6 |
| Rh I, | |||||
| 3692.36 | 0.000 | 0.174 | -1.20 | syn | 6 |
| Pd I, | |||||
| 3404.58 | 0.810 | 0.320 | –1.31 | 6.7* | 6 |
| Ag I, | |||||
| 3280.68 | 0.000 | –0.050 | –1.88 | 6.5* | 6 |
| Ba II, | |||||
| 4554.04 | 0.000 | 0.170 | –1.76 | 95.4* | 6 |
| 4934.10 | 0.000 | –0.150 | –1.76 | 82.2* | 6 |
| 5853.70 | 0.604 | –1.010 | –1.54 | 8.5* | 6 |
| 6141.70 | 0.704 | –0.070 | –1.55 | 40.6* | 6 |
| La II | |||||
| 3794.77 | 0.240 | 0.210 | –2.35 | 5.9* | 7 |
| 3988.52 | 0.400 | 0.210 | –2.75 | 1.7* | 4 |
| 3995.75 | 0.170 | –0.060 | –2.65 | 2.1* | 4 |
| 4086.71 | 0.000 | –0.070 | –2.53 | 4.6* | 4 |
| 4123.23 | 0.320 | 0.130 | –2.70 | 2.0* | 4 |
| Ce II | |||||
| 4222.60 | 0.120 | –0.180 | –1.90 | 2.0* | 6 |
| 4523.08 | 0.520 | –0.080 | –1.62 | 1.6* | 10 |
| 4539.78 | 0.330 | –0.080 | –2.03 | 1.1 | 10 |
| 4562.37 | 0.480 | 0.190 | –2.01 | 1.4 | 10 |
| 4572.28 | 0.680 | 0.290 | –1.98 | 1.1* | 8 |
| Pr II | |||||
| 4179.40 | 0.200 | 0.480 | –2.15 | 7.8* | 7 |
| 4189.48 | 0.370 | 0.380 | -2.15 | 8 | |
| Nd II | |||||
| 3784.25 | 0.380 | 0.150 | –2.14 | 2.0 | 9 |
| 3826.42 | 0.064 | –0.410 | –2.00 | 2.0* | 9 |
| 4061.08 | 0.471 | 0.550 | –2.00 | 5.5 | 9 |
| 4232.38 | 0.064 | –0.470 | –1.89 | 2.3* | 9 |
| Sm II | |||||
| 4318.94 | 0.280 | –0.270 | –2.16 | 1.8* | 7 |
| 4642.23 | 0.380 | –0.520 | –2.16 | 0.8 | 7 |
| Eu II | |||||
| 3819.67aaLines that were not used to derive final results. References.– 1.Kurucz & Bell 1995; 2.Westin et al. 2000; 3.Lawler et al. 2001a; 4.Lawler et al. 2001b; 5.Johnson 2002; 6.Hill et al. 2002; 7.Cowan et al. 2002; 8.Sneden et al. 2003; 9.Den Hartog et al. 2003; 10.Johnson et al. 2004; 11.Lawler et al. 2004. | 0.000 | 0.510 | –2.95 | syn | 5 |
| 4129.70 | 0.000 | 0.220 | –2.77 | 9.0* | 5 |
| 4205.05aaLines that were not used to derive final results. References.– 1.Kurucz & Bell 1995; 2.Westin et al. 2000; 3.Lawler et al. 2001a; 4.Lawler et al. 2001b; 5.Johnson 2002; 6.Hill et al. 2002; 7.Cowan et al. 2002; 8.Sneden et al. 2003; 9.Den Hartog et al. 2003; 10.Johnson et al. 2004; 11.Lawler et al. 2004. | 0.000 | 0.210 | –2.92 | syn | 5 |
| Gd II | |||||
| 3331.40aaLines that were not used to derive final results. References.– 1.Kurucz & Bell 1995; 2.Westin et al. 2000; 3.Lawler et al. 2001a; 4.Lawler et al. 2001b; 5.Johnson 2002; 6.Hill et al. 2002; 7.Cowan et al. 2002; 8.Sneden et al. 2003; 9.Den Hartog et al. 2003; 10.Johnson et al. 2004; 11.Lawler et al. 2004. | 0.000 | –0.140 | -2.15 | syn | 7 |
| 3481.80aaLines that were not used to derive final results. References.– 1.Kurucz & Bell 1995; 2.Westin et al. 2000; 3.Lawler et al. 2001a; 4.Lawler et al. 2001b; 5.Johnson 2002; 6.Hill et al. 2002; 7.Cowan et al. 2002; 8.Sneden et al. 2003; 9.Den Hartog et al. 2003; 10.Johnson et al. 2004; 11.Lawler et al. 2004. | 0.490 | 0.230 | –1.79 | 4.0* | 7 |
| 3549.37 | 0.240 | 0.260 | –2.40 | 2.1 | 7 |
| 3768.40 | 0.080 | 0.360 | –2.48 | 3.8* | 7 |
| Dy II | |||||
| 3460.97 | 0.000 | –0.070 | –2.42 | 3.2* | 7 |
| 3531.71 | 0.000 | 0.770 | –2.81 | 8.3* | 8 |
| Ho II | |||||
| 3398.94 | 0.000 | 0.410 | -2.00 | syn | 11 |
| Er II | |||||
| 3499.10 | 0.060 | 0.136 | –2.75 | 2.7 | 10 |
| 3692.65 | 0.050 | 0.138 | –2.57 | 4.5* | 6 |
| Tm II | |||||
| 3701.36 | 0.000 | –0.540 | –3.00 | syn | 8 |
| Yb II | |||||
| 3289.37 | 0.000 | 0.020 | –2.70 | 27.5* | 8 |
| 3694.19 | 0.000 | –0.300 | –2.86 | 13.3* | 8 |
| Ir I | |||||
| 3220.76aaLines that were not used to derive final results. References.– 1.Kurucz & Bell 1995; 2.Westin et al. 2000; 3.Lawler et al. 2001a; 4.Lawler et al. 2001b; 5.Johnson 2002; 6.Hill et al. 2002; 7.Cowan et al. 2002; 8.Sneden et al. 2003; 9.Den Hartog et al. 2003; 10.Johnson et al. 2004; 11.Lawler et al. 2004. | 0.350 | –0.510 | -1.12 | syn | 7 |
| 3800.12 | 0.000 | –1.450 | -1.60 | syn | 7 |
| Th II | |||||
| 4019.12 | 0.000 | –0.270 | –3.05 | syn | 7 |
| species | Z | log | [X/Fe] | N | |
|---|---|---|---|---|---|
| Cu | 29 | 0.98 | 0.29 | –1.15 | 3 |
| Zn | 30 | 2.01 | 0.16 | +0.18 | 4 |
| Sr | 38 | –0.11 | 0.08 | –0.26 | 3 |
| Y | 39 | –0.93 | 0.09 | –0.37 | 15 |
| Zr | 40 | –0.28 | 0.16 | –0.10 | 17 |
| Nb | 41 | –1.48 | 0.17 | –0.13 | 2 |
| Mo | 42 | –0.87 | 0.17 | –0.02 | 1 |
| Ru | 44 | –0.86 | 0.17 | +0.07 | 2 |
| Rh | 45 | –1.20 | +0.45 | 1 | |
| Pd | 46 | –1.36 | 0.17 | –0.28 | 2 |
| Ag | 47 | –1.88 | 0.17 | –0.05 | 1 |
| Ba | 56 | –1.62 | 0.12 | –1.02 | 4 |
| La | 57 | –2.66 | 0.10 | –1.02 | 5 |
| Ce | 58 | –1.83 | 0.18 | –0.64 | 6 |
| Pr | 59 | –2.15 | 0.17 | –0.09 | 1 |
| Nd | 60 | –2.01 | 0.10 | –0.69 | 4 |
| Sm | 62 | –2.16 | 0.17 | –0.40 | 2 |
| Eu | 63 | –2.77 | 0.17 | –0.52 | 1 |
| Gd | 64 | –2.44 | 0.17 | –0.76 | 2 |
| Dy | 66 | –2.62 | 0.17 | –0.99 | 2 |
| Ho | 67 | –2.00 | +0.26 | 1 | |
| Er | 68 | –2.66 | 0.17 | –0.82 | 2 |
| Tm | 69 | –3.00 | –0.23 | 1 | |
| Yb | 70 | –2.78 | 0.17 | –1.09 | 2 |
| Ir | 77 | –1.60 | –0.21 | 2 | |
| Th | 90 | –3.05 | –0.34 | 1 |
| species | [Fe/H] | ||||||||||
|---|---|---|---|---|---|---|---|---|---|---|---|
| Cu I | 0.22 | 0.17 | 0.06 | 0.07 | 0.15 | 0.06 | 0.23 | 0.26 | |||
| Zn I | 0.05 | 0.04 | 0.05 | 0.04 | 0.00 | 0.01 | 0.03 | 0.02 | |||
| Sr I | 0.13 | 0.12 | 0.02 | 0.03 | 0.04 | 0.00 | 0.01 | 0.00 | |||
| Sr II | 0.12 | 0.11 | 0.05 | 0.03 | 0.03 | 0.05 | 0.31 | 0.39 | |||
| Y II | 0.08 | 0.07 | 0.08 | 0.08 | 0.02 | 0.01 | 0.16 | 0.09 | |||
| Zr II | 0.08 | 0.07 | 0.09 | 0.08 | 0.03 | 0.02 | 0.08 | 0.05 | |||
| Nb II | 0.09 | 0.09 | 0.10 | 0.10 | 0.04 | 0.02 | 0.03 | 0.02 | |||
| Mo I | 0.19 | 0.17 | 0.02 | 0.01 | 0.03 | 0.00 | 0.00 | 0.00 | |||
| Ru I | 0.20 | 0.17 | 0.01 | 0.02 | 0.04 | 0.00 | 0.01 | 0.00 | |||
| Pd I | 0.20 | 0.17 | 0.01 | 0.03 | 0.04 | 0.01 | 0.01 | 0.01 | |||
| Ag I | 0.21 | 0.17 | 0.00 | 0.01 | 0.04 | 0.00 | 0.01 | 0.01 | |||
| Ba II | 0.09 | 0.07 | 0.09 | 0.07 | 0.01 | 0.01 | 0.08 | 0.06 | |||
| La II | 0.08 | 0.07 | 0.10 | 0.09 | 0.03 | 0.02 | 0.00 | 0.00 | |||
| Ce II | 0.08 | 0.07 | 0.09 | 0.09 | 0.02 | 0.02 | 0.00 | 0.00 | |||
| Pr II | 0.10 | 0.08 | 0.10 | 0.09 | 0.03 | 0.02 | 0.01 | 0.01 | |||
| Nd II | 0.08 | 0.08 | 0.09 | 0.10 | 0.04 | 0.02 | 0.00 | 0.00 | |||
| Sm II | 0.09 | 0.07 | 0.09 | 0.08 | 0.03 | 0.02 | 0.00 | 0.00 | |||
| Eu II | 0.09 | 0.09 | 0.10 | 0.10 | 0.04 | 0.02 | 0.00 | 0.00 | |||
| Gd II | 0.10 | 0.08 | 0.11 | 0.09 | 0.03 | 0.02 | 0.00 | 0.00 | |||
| Dy II | 0.09 | 0.10 | 0.10 | 0.10 | 0.05 | 0.02 | 0.01 | 0.01 | |||
| Er II | 0.09 | 0.09 | 0.10 | 0.09 | 0.04 | 0.03 | 0.00 | 0.00 | |||
| Yb II | 0.09 | 0.08 | 0.10 | 0.10 | 0.04 | 0.02 | 0.03 | 0.02 | |||