A unified picture for gamma-ray burst prompt and X-ray afterglow emissions
Abstract
Data from the Swift satellite has enabled us for the first time to provide a complete picture of the gamma-ray burst emission mechanism and its relationship with the early afterglow emissions. We show that gamma-ray photons for two bursts, 050126 & 050219A, for which we have carried out detailed analysis were produced as a result of the synchrotron self-Compton process in the material ejected in the explosion when it was heated to a mildly relativistic temperature at a distance from the center of explosion of order the deceleration radius. Both of these bursts exhibit rapidly declining early X-ray afterglow lightcurves; this emission is from the same source that produced the gamma-ray burst. The technique we exploit to determine this is very general and makes no assumption about any particular model for gamma-ray generation except that the basic radiation mechanism is some combination of synchrotron and inverse-Compton processes in a relativistic outflow. For GRB 050219A we can rule out the possibility that energy from the explosion is carried outward by magnetic fields, and that the dissipation of this field produced the -ray burst.
keywords:
gamma-rays: bursts — shock waves — hydrodynamics1 Introduction
The successful launch of the Swift satellite in November 2004 filled a crucial gap in the gamma-ray burst data at early times – between a minute to a few hours – that existed in prior GRB missions. This has led to a number of very interesting discoveries regarding emission from GRBs on time scales of minutes following a burst. One of these discoveries is that the very early X-ray lightcurve (LC) of many bursts falls off very rapidly: (Tagliaferri et al. 2005, Goad et al. 2005, Burrows et al. 2005, Chincarini et al. 2005). This phase of rapid fall off lasts for about 5 minutes, and is followed by the usual behavior. In most cases, no change to the spectral slope is seen accompanying the change to the lightcurve. In this paper, we discuss two bursts exhibiting such behavior, GRBs 050126 and 050219A. We provide an argument that the -rays and the early X-rays (for the first 5 minutes) have a common source, and we determine the physical properties of the source (next section).
2 Modeling Prompt -ray and Afterglow Emissions
We start with some very general physical considerations and describe a model with as few assumptions as possible to try to understand the -ray and X-ray emissions together.
We do not assume that -rays are produced in the internal shock or external shock or any other of a number of different models that have been suggested. We determine the properties of the -ray source from the data and use it to decide which of the proposed models, if any, work. The only assumption that we make is that -rays are generated by synchrotron or inverse-Compton (IC) mechanisms – an assumption that is supported by their non-thermal spectrum and also indirectly by the excellent overall agreement between models based on synchrotron & IC emission and multiwavelength afterglow data for a large number of GRBs (Piran, 2005; Mészáros & Rees, 1999; Panaitescu & Kumar, 2002; Granot et al. 1999).
The two bursts considered here have -ray light curves dominated by a single peak and small fluctuations and therefore much of the -ray flux is likely produced in a single source localized in space. In such a case the synchrotron and IC emissions from the object are completely determined if we know the magnetic field strength (), the optical thickness of the object to Thomson scattering (), the speed of the object toward the observer (Lorentz factor – ), the total number of radiating particles assuming isotropic source (), and the minimum energy for radiating particles, , ( is electron mass & is the speed of light). The particle energy distribution above , at the acceleration region where particles have not suffered appreciable loss of energy, is assumed to be a power-law function with index . The energy distribution of particles for the entire population, however, is not a single power law function due to the loss of energy via radiative processes. We determine this modified distribution numerically by carrying out a self-consistent calculation of synchrotron cooling and self-absorption frequencies as described in Panaitescu & Mészáros (2000), and McMahon et al. (2005).
The average energy per particle, at the acceleration site, in the comoving frame of the source is , and therefore ; where is the isotropic equivalent of energy in -rays. The index is determined by the observed spectral index; we take when the spectrum above the peak is not known – results reported here have been checked for dependence on , and found qualitatively to be insensitive to .
So we are left with four unknown parameters viz., , , and . The observational constraints on these parameters are: the -ray flux at the peak of the observed light curve, the frequency at which the spectrum peaks, the duration of the burst, the spectral index below the peak, and the optical flux limit (when available). The last two constraints are not independent and typically provide a limit on synchrotron cooling and/or injection frequencies.
The optical depth, , and determine the distance of the -ray source from the center of the explosion: ; and the burst duration . The parameters we use describe the state of the -ray producing source at the time of the peak of the observed lightcurve. The observed peak flux is the synchrotron or inverse-Compton flux in the appropriate observer energy band which is determined from , (the total number of electrons/positrons in the source), , and ; the details of the calculation is described in Kumar et al. (2005). By searching the parameter space (, , , ) for emission properties consistent with those observed for each burst we can decide among various GRB models. As we shall see, we are led to more or less a unique solution: -rays are generated via synchrotron-self-IC (SSC) in a source with typical electron energy less than 10 and with properties that favor the external reverse-shock or internal shocks. Moreover, the -ray source we thus find also accounts for the early X-ray afterglow in a natural way, as off axis flux from the -ray emitting material or flux from the adiabatically cooling source.
Results for 050126 and 050219A are discussed below.
2.1 GRB 050126
GRB 050126 was 25s long with a fluence in 15-350 kev band of erg cm-2, and redshift 1.29 (Tagliaferri et al. 2005). The average spectral index () during the burst was and during the X-ray afterglow, the spectral index was and the LC fell off as . We describe the results for -ray and X-ray emissions below.
Gamma-ray generation via the synchrotron process
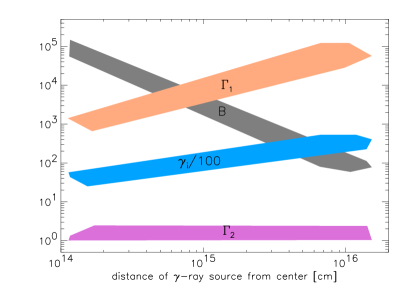
Figure 1 shows the parameter space allowed – for a source radiating via the synchrotron process – to explain the observed -ray data for 050126. In particular we show the allowed range for , , (the lower limit to the Lorentz factor of unshocked shell which produced the -ray photons when it was shock heated – we will refer to it as shell 1), and the upper limit to the Lorentz factor of the shell or the medium that shell 1 collided with (); the figure caption describes how and are calculated. These quantities are plotted against the radius, , at which -rays are generated, to determine which GRB model could be described by the four parameter solution space.
The solutions we find have , and a high magnetic field strength is needed to explain the -ray emission for this burst if it were to arise due to synchrotron emission. The synchrotron cooling frequency is found to be less than a few ev which is in part due to the constraint that the low energy spectral index is -0.34 (so all of the solutions are in highly radiative cooling regime). The radius where the observed -rays could have been generated varies from the typical internal shock radius of cm to the external shock radius of cm; the lower limit to the radius is due to our choice of in order to avoid excessive Compton scattering — for the minimum is a factor 2 smaller. In the case of internal shocks we find that the Lorentz factor of the two colliding shells must satisfy the condition and (see fig. 1), which seems an unrealistic requirement for any central engine to meet, and in any case this situation would not be that different from the interaction of GRB ejecta with the ISM where . Note that the time interval between the ejection of the two shells (with and ) is larger than 500s for the internal shock radius of cm while the duration of this burst was 25s – this is another problem for this solution. Furthermore, the fact that the GRB LC was a FRED (fast rise, exponential decline) means that internal shocks are not required to generate the -ray emission.
The allowed parameter space contains an external forward-shock solution as well (cm; ). This solution, however, requires (figure 1) which makes the already acute problem of baryonic loading much worse. Moreover, the deceleration radius for this large , for a typical GRB-circumstellar medium density of cm-3, is less than cm – the distance at which the -ray source according to our solution is located. Therefore, we conclude that -rays from 050126 are unlikely to have been produced via the synchrotron process in internal or external shocks.
2.1.1 Gamma-ray production via the inverse-Compton process
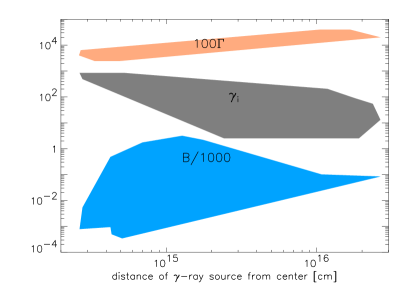
Figure 2 shows the allowed parameter space for synchrotron-self-IC solutions. The entire solution space consists of mildly relativistic shocks with , and the Lorentz factor (LF) of the source is between 20 & 300. Mildly relativistic shocks arise naturally in internal collisions (with the ratio of LFs for colliding shells of order a few) and the external reverse-shock (RS). A good fraction of the allowed parameter space has electron cooling time, due to radiative losses, of order the dynamical time or less, and the synchrotron cooling frequency is of order a few eV. The magnetic field strength is about 50 Gauss (which corresponds to ) & Compton Y for the part of parameter space corresponding to reverse-shocks, whereas is between 1 and 103 gauss and for internal shocks. The IC -ray lightcurve falls off very rapidly for both the internal and the reverse shock emission as does the observed LC (Kobayashi et al. 2005). Therefore, -rays from GRB050126 could have been produced via SSC in either internal or external shocks, and we don’t see any reason to prefer one solution over the other for this burst.
2.1.2 X-ray afterglow
Is it possible that the early X-ray afterglow was produced by the same source as the GRB IC photons? The IC cooling frequency, , at the GRB LC peak (7s) is typically of order a few hundred keV for the allowed parameter space for this burst. Since shifts to lower energies due to adiabatic cooling, as , at 100s it will have dropped to 1 keV. In this case the flux in the XRT band at 100s from part of the source will be very small, and will rapidly drop to zero on a short time scale. The early X-ray LC could be explained by this adiabatically cooling -ray source provided that MeV at 7 s, which is somewhat outside of the parameter space we find for this burst.
Could photons detected by the XRT in 0.2-10 keV band at s be off-axis photons (Kumar & Panaitescu, 2000) that originate at the source at an angle w.r.t. the line of sight ? The flux at 10 keV at the peak of the GRB 050126 lightcurve was 0.54mJy. This gives the flux 111The off-axis flux falls off as , see [11], where is the spectral index, i.e. . at 100s due to off axis emission of 1.1Jy, in rough agreement with the XRT measurement of 2.8Jy. The X-ray light-curve between 100s and 425s declined as . This decline is also consistent with that expected of off-axis emission; during this period would give rise to off-axis LC decaying as . The spectral peak for the off-axis emission from a uniform jet decreases with time as , and so the peak at 100s is at keV. The peak frequency decreases more rapidly when electron energy and/or magnetic field is smaller at higher . In this case the spectral peak will be below 10 keV, and in the XRT band, for s, smaller than during the GRB. We note that a decrease of and would not lead to a decrease in the flux in the XRT band so long as these changes are accompanied with an increase in the number of radiating particles as might be expected, for instance, when decreases with but the energy per unit solid angle is roughly constant. The angular structure of the ejecta can be constrained by the difference between the observed spectral peak at 100s and during the burst.
2.2 GRB 050219A
GRB 050219A was 23.6s long with fluence in the BAT 15-350 kev band of erg cm-2. The average spectral index during the burst was (), and the peak of the spectrum was at 90 keV (Tagliaferri et al. 2005). During the X-ray afterglow, the spectral index was and the X-ray LC declined as . We describe below the mechanism for -ray, X-ray, and optical emissions.
2.2.1 Gamma-ray production
The positive during the GRB, although consistent with the synchrotron spectrum of to within 1.5, rules out the synchrotron process for the generation of -rays for 050219A. The reason is that the magnetic field required to produce synchrotron peak frequency of 90keV is sufficiently strong that electrons lose their energy on a time scale much less than the duration of the burst (23s), and in this case the spectrum below 90 keV would be . 222A synchrotron frequency of 90 keV implies that and the electron cooling LF is ; the Compton parameter , and therefore, , where is the burst duration in the host galaxy rest frame. Since and s, and , we see that unless which is highly unlikely. This is in conflict with the observed spectrum and rules out the synchrotron process for -ray generation.
The inverse-Compton process on the other hand provides a very natural way of explaining the observed spectrum and other properties. The spectrum produced by inverse Compton scattering of a self-absorbed synchrotron radiation is for ; where is the synchrotron self-absorption frequency. For and eV, the peak of the IC spectrum at is close to the observed value of 909 keV. These parameters arise naturally in an external reverse-shock.
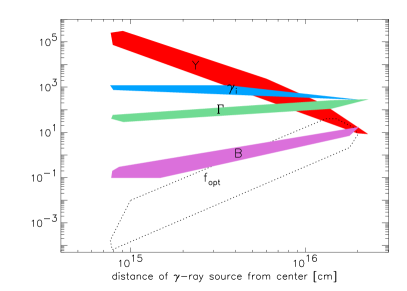
Figure 3 shows the allowed parameter space for SSC solution for GRB 050219A, assuming . The range of for the allowed solutions is 200–1500 which is typical for the external reverse-shock and for internal shocks, but not the external forward-shock. The magnetic field is between 0.1 and 20 Gauss. This is highly sub-equipartition (), and therefore for 050219A we can rule out the possibility that the -ray burst was produced as a result of dissipation of magnetic field or that much of the energy of the explosion was carried outward by the magnetic field.
The Compton Y is rather large – of order 10–100 for external shock (cm), and larger than 104 for internal shock radius of cm (fig. 3). One might suspect that the large renders these solutions unphysical since the energy in the 2nd Compton scattering, which produces 100 GeV photons, will far exceed the -ray energy. However, for low optical depth systems with the radius of the system increases by about a factor 2 in the time it takes photons to traverse the shell. Therefore, the optical depth for the 2nd scattering is smaller than the 1st by a factor 4, and the electron thermal energy has decreased due to adiabatic expansion during this period by a factor of about 4 for RS (shell thickness for RS increases as ), and a factor 2 for internal shocks. Thus, the effective for the 2nd Compton scattering is smaller than the 1st scattering Compton-Y by a factor of about 64 for the RS and 16 for internal shocks. For this reason for the external shock is quite acceptable, as the total energy requirement is of order 1051 erg. However, for internal shocks (see fig. 3) would require the total energy in the explosion to be times larger than energy in the -ray band and that is highly unlikely considering that erg. Therefore, the only viable solution for the -ray production for 050219A is inverse-Compton in the external reverse-shock heated ejecta.
2.2.2 X-ray afterglow
There are two mechanisms that can explain the X-ray observations for this burst. One of these is the off-axis emission. The flux at the peak of -ray LC (15s) at 10keV was Jy. Using this and , we find the flux at 100s, due to the off-axis emission mechanism (), to be Jy, which is consistent with the observed XRT flux (Jy at 10 keV at 100s). The LC decay according to the off-axis emission after the spectral peak falls through the XRT band is , where is the spectral index for s, and this is consistent with the observed decay of . The difference between the X-ray afterglow and -ray spectra can be understood in the same way as discussed for 050126, i.e. the peak of during the GRB (90keV) is well below 10keV at 100s if and decrease with slightly and this changes the spectrum from to .333Angular variation is almost unavoidable, because in the absence of it the early X-ray LC would have declined as due to the off axis emission.
The second possibility is that we continue to see radiation from within angle of the adiabatically cooling -ray source. We find that for a large part of the allowed parameter space for -ray solution MeV, and therefore we expect to receive emission in the 0.2-10 keV band for a period of about 5 minutes, during which time the flux decline will be , which is consistent with the observed decay. 444The IC frequencies for an adiabatically cooling ejecta shift with time as , so the 90 keV peak at 15s would have shifted to 2 keV at 100s. During the time when this peak is above the XRT band of 10keV, the IC flux from the RS decreases very weakly with time (), and subsequently, the flux decreases as . The cross-over is expected at about 45s. Thus, the flux from the RS at 100s at 10 keV is expected to be about Jy which is consistent with the XRT flux of 25Jy. The spectrum at 100s will be as expected of IC above , i.e. roughly . We note that the discontinuity in the BAT and XRT lightcurves for this burst1 could be due to an underestimation of the spectral evolution in 20-50s time interval where the BAT signal was low. A discontinuous jump can also arise in the off-axis model as a result of a rapid increase in jet energy for between and .
Both of these solutions suggest a common source for the -ray burst and early X-rays.
2.2.3 Optical observations
The optical flux at 100s from the -ray source is shown in figure 3. For the RS solution the flux is about 1 mJy whereas the observed UVOT upper limit at 96s is 0.02mJy (Schady et al. 2005). The much smaller optical flux could be due to absorption in the host galaxy. The total hydrogen column density for this burst was1 cm-2, in excess of the galactic value, which for a burst at could give 7mag of optical extinction, more than sufficient to bring the optical flux below the observed upper limit.555Galactic correlation between and extinction might not apply to GRBs due to possible dust destruction by GRB emission (Galama & Wijers, 2001). It is therefore difficult to say with confidence the amount of extinction for this burst in the V-band. Alternatively, if the RS occurs at cm the optical flux would be roughly consistent with the observed upper limit (see fig. 3). However, in this case , and the energy in the 2nd Compton scattered, photons, at 100 GeV, will be almost an order of magnitude larger than the energy in -rays.
3 Conclusion
We find that the prompt -ray and early (first few minutes) X-ray emissions for GRBs 050126 and 050219A are consistent with being produced by the same source. In the case of 050126, the emission is inverse Compton radiation from either internal shocks or external-reverse shock, and in the case of 050219A, the photons are produced by inverse Compton in the external-reverse shock. The late time X-ray (min) is produced, as usual, in the forward shock.
These results can be applied to the class of gamma-ray bursts with consist of a simple, i.e. not highly variable, lightcurve. For instance, our conclusion that -rays were generated via the inverse-Compton process for GRB 050219A is valid for all those GRBs which, like GRB 050219A, have a positive low energy spectral index for the prompt gamma-ray emission ( with ). The allowed values for parameters – , & – for the source of -rays for any GRB consisting of a single peak in the -ray lightcurve should be similar to that shown in figures 1 and 3 for 050126 & 050219A.
Acknowledgment: PK thanks Alin Panaitescu and Jonathan Granot for useful discussions. This work is supported in part by grants from NASA and NSF (AST-0406878) to PK.
References
- [1] Burrows, D.N., et al., to appear in Science (2005), astro-ph/0506130
- [2] Chincarini, G. et al., submitted to ApJ (2005), astro-ph/0506453
- [3] Galama, T.J., & Wijers, R.A.M., ApJ 549, L209-L212 (2001)
- [4] Goad, M.R., et al., Submitted to ApJ (2005)
- [5] Granot, J., Piran, T. and Sari, R., ApJ 513, 679-689 (1999)
- [6] Kobayashi, S., Zhang, B., Mészáros, P., and Burrows, D., 2005, submitted to ApJ
- [7] Kumar, P, and Panaitescu, A., ApJ 541, L51-L54 (2000)
- [8] Kumar, P. et al. in preparation (2005)
- [9] McMahon, E., Kumar, P., and Piran, T., to appear in MNRAS (2005)
- [10] Mészáros, P. and Rees, M.J., ApJ 476, 232-237 (1999)
- [11] Panaitescu, A. and Kumar, P., ApJ 571, 779-789 (2002)
- [12] Panaitescu, A., & Mészáros, P., ApJ 544, L17-21 (2000)
- [13] Piran, T., Rev. Mod. Phy. 76, 1143-1210 (2005)
- [14] Schady, P., et al., GCN circular 3029 (2005)
- [15] Tagliaferri, G. et al., 2005, Nature 436, 985