Post-Outburst Phase of McNeil’s Nebula (V1647 Orionis)
Abstract
We present a detailed study of the post-outburst phase of McNeil’s nebula (V1647 Orionis) using optical and near-infrared (NIR) photometric and low resolution optical spectroscopic observations. The observations were carried out with the HFOSC, NIRCAM, TIRCAM and NICMOS cameras on the 2m HCT and 1.2m PRL telescopes during the period 2004 February – 2005 December. The optical and NIR observations show a general decline in brightness of the exciting source of McNeil’s nebula (V1647 Ori). Our recent optical images show that V1647 Ori has faded by more than 3 magnitudes since February 2004. McNeil’s nebula itself has also faded considerably. The optical/NIR photometric data also show a significant variation in the magnitudes ( = 0.78 mag, = 0.44 mag, = 0.21 mag, = 0.24 mag and = 0.20 mag) of V1647 Ori within a period of one month, which is possibly undergoing a phase similar to eruptive variables, like EXors or FUors. The optical spectra show a few features such as strong emission with blue-shifted absorption and the Ca II IR triplet (8498Å, 8542Å and 8662Å) in emission. As compared to the period just after outburst, there is a decrease in the depth and extent of the blue-shifted absorption component, indicating a weakening in the powerful stellar wind. The presence of the Ca II IR triplet in emission confirms that V1647 Ori is a pre-main-sequence star. The long-term, post-outburst photometric observations of V1647 Ori suggest an EXor, rather than an FUor event. An optical/IR comparison of the region surrounding McNeil’s nebula shows that the optical nebula is more widely and predominantly extended to the north, whereas the IR nebula is relatively confined (diameter 60″), but definitely extended, to the south, too. The large colour gradient from north to south and the sudden absence of an optical nebula to the south is suggestive of a large scale disk-like structure (or envelope) surrounding the central source that hides the southern nebula.
keywords:
stars: formation — stars: pre-main-sequence – Reflection nebulae – ISM: individual (McNeil’s nebula) – stars: variables: other1 Introduction
On the night of 2004 January 23, Jay McNeil discovered a new reflection nebula in the L1630 cloud in Orion (McNeil 2004). The nebula, which now bears his name, is recognized as a reflection nebula surrounding a young stellar object (YSO). It appears to be a faint optical counterpart of the infrared (IR) source catalogued as IRAS 05436-0007 that had gone into outburst, producing a large reflection nebulosity (Reipurth and Aspin 2004; Ábrahám et al. 2004; Briceño et al. 2004; Vacca, Cushing and Simon 2004; Andrews, Rothberg and Simon 2004; Walter et al. 2004; Kun et al. 2004; Ojha et al. 2005). Later the McNeil’s object was designated as V1647 Orionis (Samus 2004). Reipurth and Aspin (2004) reported that NIR images taken with the Gemini 8m telescope show that the object has brightened by about 3 magnitudes in , relative to the 1998 2MASS measurements. Gemini spectra reveal strong features of CO and hydrogen Br in emission in the IR. In the optical, appears in emission with a P Cygni profile (Reipurth and Aspin 2004).
McGehee et al. (2004) described the change in optical and NIR colours of V1647 Ori from its “quiescent” state to its outburst. They concluded that the colour changes associated with brightening suggest an EXor like outburst rather than a simple dust clearing event. Kun et al. (2004) analyzed optical and NIR measurements of V1647 Ori and suggested that the outburst was due to an intrinsic increase in the luminosity of the central object (rather than a decrease in extinction), and identified the object as an FUor, rather than an EXor. Vacca, Cushing and Simon (2004) presented NIR spectroscopy of the object and suggested that V1647 Ori is a heavily embedded low-mass Class I protostar, surrounded by a disk, whose brightening is due to a recent accretion event. Ábrahám et al. (2004) described IR and sub-mm properties of V1647 Ori and concluded that the object has a disk of about 0.5 M⊙, a pre-outburst bolometric luminosity of 5.6 L⊙, and is probably a class II protostar of age about 0.4 Myr. Andrews, Rothberg and Simon (2004) presented the measurements of V1647 Ori in the mid-IR and sub-mm and concluded that the 12 m flux of this source has increased by a factor of 25 after the outburst, whereas the sub-mm continuum remains at its pre-outburst level. The infrared slope of the spectral energy distribution (SED) characterizes the illuminating source as a flat-spectrum protostar, in both its active and quiescent states. Muzerolle et al. (2005) report on Spitzer NIR photometry of V1647 Ori in its early post-outburst phase (March 2004). They found that the brightness of the star increased by roughly the same factor of 15–20 across the optical and NIR. Their results indicated that the outburst may be intermediate between FUor and EXor-type events. Aspin and Reipurth (2005) reported on observations made at the Gemini telescope and showed that V1647 Ori has faded by approximately one magnitude in -band since January 8, 2005. Kóspál et al. (2005) reported the most recent measurements of V1647 Ori obtained between 2005 October 4 and November 19 which show that V1647 Ori has started a very rapid fading ( 1 mag/month). They concluded that V1647 Ori is a unique (somewhat intermediate) object among FUors and EXors.
The McNeil’s source at the apex of the nebula was also observed to brighten dramatically in X-ray wavelength. The X-ray data from Chandra gives strong evidence that the probable cause of the outburst is the sudden infall of gas onto the surface of the star from an orbiting disk of gas (Kastner et al. 2004). Grosso et al. (2005) describe X-ray spectra of V1647 Ori taken with XMM-Newton on 2004 April 4. They find variations in both the brightness and hardness of the source. There is a very exciting hint of periodicity in the X-ray brightness, which might provide information on the physical nature of the X-ray luminosity. Vig et al. (2004, 2005) presented post-outburst radio continuum observations of the region around McNeil’s nebula and report no radio continuum emission from the nebula. They explored various scenarios to explain the radio upper limit of the nebula and suggested that the homogeneous HII region scenario is consistent with the radio, as well as X-ray measurements.
In this paper we present the optical and NIR morphologies of McNeil’s nebula and report on the optical/NIR photometric and optical spectroscopic monitoring of V1647 Ori beginning with the epoch of the recent outburst. Our results provide variability measurements of V1647 Ori for a duration of about 21 months and allow us to check if the central star has changed significantly since its emergence in early 2004. Our optical/NIR observations also show significant variations in the source brightness within periods of one week and one month. In §2 we present the details of observations and data reduction procedures, §3 deals with the results and discussion concerning the short and long time variability of V1647 Ori that illuminates McNeil’s nebula, and describes the optical/IR nebula in detail. We also discuss spectroscopic results in this section. We then summarize our conclusions in §4.
2 Observations and Data Reduction
2.1 Optical Photometry
Imaging observations of McNeil’s nebula region at optical wavelengths
(standard Bessel filters) were obtained on 19 nights during
2004 February – 2005 November
with the 2m
Himalayan Chandra Telescope (HCT) situated at the Indian Astronomical
Observatory (IAO), Hanle, India. The Himalaya
Faint Object Spectrograph Camera (HFOSC) instrument equipped with a
SITe 2K4K pixel CCD was used. The central 2K2K region,
used for imaging, corresponds to a field of view (FOV) of
10′10′,
with a pixel scale of 0.296″. Further details on the
telescope and the instrument can be found at
http://www.iiap.res.in/iao/hfosc.html.
The observations were carried out under good photometric sky conditions.
The average seeing (FWHM) in all the
bands was 1.6″ during the observations. Bias and flat frames were
obtained at the beginning and end of each observing night. Atmospheric
extinction and
transformation coefficients were obtained from the observations of photometric
standard stars around 98-556, 98-618, 98-961, PG 1525-071 and PG 0231+051
regions (Landolt 1992). The details of the observations are given in Table 1.
Landolt standard regions were not observed on five nights, hence
the magnitudes of V1647 Ori were obtained by using a reference star as
a secondary standard in the field (see Table 1).
During five nights, observations were carried out for the target in filter
only and a reference star (see §3) in the field was used to obtain the
differential magnitudes.
Data reduction was done using the NOAO’s IRAF111IRAF is distributed by the National Optical Astronomy Observatories, which are operated by the Association of Universities for Research in Astronomy, Inc., under contract to the National Science Foundation. package tasks. Flat-fielding with a median flat frame was applied. Identification and photometry of point sources were performed by using the DAOFIND and DAOPHOT packages in IRAF, respectively. Because of nebulosity around V1647 Ori, photometry was obtained using the point-spread function (PSF) algorithm ALLSTAR in the DAOPHOT package (Stetson 1987). The residuals to the photometric solution are 0.05 mag. The absolute optical photometry of V1647 Ori is presented in Table 2.
2.2 NIR Photometry
The NIR observations were carried out during 2004 February 12, October 18, November 19, 2005 November 28, 29 and 30 with the HCT NIR camera (NIRCAM), equipped with 512512 HgCdTe array of 18 m pixel size. For our observations, the NIRCAM was used in the Camera-B mode which has an FOV of 3.6′3.6′. Further details on NIRCAM can be found at http://www.iiap.res.in/iao/nir.html. We obtained several dithered exposures of the target centred at (, )2000 = (, -00) in each of the NIR bands. Typical integration times per frame were 20s, 15s and 5s in the , and -bands, respectively. The images were co-added to obtain the final image in each band. We also obtained several dithered sky frames close to the target position in each NIR band. Photometric calibration was done from the observations made on the same nights on the standard stars around AS13 region (Hunt et al. 1998) at air masses close to that of the target observations. We used an aperture radius of 18 pixels ( 7″) for photometry of V1647 Ori. The local sky was evaluated in an annulus with an inner radius of 128 pixels and a width of 12 pixels.
The NIR observations were also carried out on 2004 October 12, using TIFR Near-Infrared Camera (TIRCAM) at the f/13 Cassegrain focus of the Mount Abu 1.2m telescope belonging to PRL (India). TIRCAM is based on the SBRC InSb Focal Plane Array (5862 pixels) sensitive between 1–5 m. The details of the TIRCAM system is described in Ojha et al. (2002). Individual object frames were of 2s integration in , and -band. Photometric calibration was obtained by observing the standard star HR1852 from the list of UKIRT’s bright standards222http://www.jach.hawaii.edu/UKIRT/astronomy/calib/phot-cal/bright-stds.html.
We also made NIR photometric observations by using PRL NICMOS camera on Mount Abu 1.2m telescope. At the core of the NICMOS camera is a 256x256 HgCdTe array with pixel scale of 1.0″ and an FOV of 4′ x 4′. Photometric observations were made in -bands on 10 occasions, namely 2004 March 20 & 21, April 11, October 16 & 17, December 21 & 22, 2005 November 25 & 26 and December 3 under photometric conditions. Single frame integration times were 10/20 sec for , 5/10 sec for and 2 sec for -band. Overall integration times were 300–360s for , 200–300s for and 200–320s for -bands. Sufficient number of dithered sky frames were also taken along with dark frames. Photometric calibration was done by using the standard stars around AS13 region (Hunt et al. 1998) and HD 40335.
The data reduction was done using IRAF software tasks. All the NIR images went through the standard pipeline reduction procedures like dark/sky-subtraction and flat-fielding. Photometric magnitudes were extracted by using the IRAF DAOPHOT/PHOT and APPHOT/PHOT tasks. NIR photometry of V1647 Ori obtained on 17 nights (2004 February – 2005 December) with NIRCAM, TIRCAM and NICMOS cameras is listed in Table 3 along with other published results in the literature.
2.3 Optical Spectroscopy
Spectroscopic observations of V1647 Ori were carried out with the HFOSC instrument at the 2m HCT on 10 occasions beginning 2004 February 22. The log of observations is given in Table 4. To avoid the contamination from nebular emission around McNeil’s nebula, the slit was positioned on V1647 Ori in EW direction. The spectra were obtained at resolutions of 15Å and 7Å in the wavelength range 5000–9100Å. These resolutions are sufficient to resolve the line detected in the spectrum of V1647 Ori. The spectra were reduced using standard IRAF routines. The one-dimensional spectra were extracted from the bias-subtracted and flat-field corrected images using the optimal extraction method. Wavelength calibration of the spectra was done using the FeAr and FeNe lamp sources. Subsequently, the spectra were corrected for instrumental response using spectrophotometric standards (Hiltner 600, Feige 34 and G191B2B) observed on the same night and brought to a flux scale. For the nights of 2005 September 8 and 28, the multiple flux calibrated spectra were combined and scaled to a weighted mean.
3 Results and Discussion
3.1 Optical and IR Morphology of McNeil’s Nebula
A colour composite image was constructed from the HFOSC , and -band images ( represented in blue, in green and in red) obtained on 2004 February 12 and is shown in figure 1. The location of V1647 Ori is marked at the centre of the image. The well known Herbig-Haro (HH) objects, such as the HH 24 complex, are seen in green colour because of the emission. The diffuse emission due to HH 23 is highlighted by the box at top centre. The star associated with McNeil’s nebula was proposed as the exciting source of HH 23 (Eisloffel and Mundt 1997; Kastner et al. 2004). A bright knot HH 22 is marked by an arrow, which is seen as a “smoky cloud” covering part of the new object.
The enlarged view of McNeil’s nebula region is shown in figure 2. Figure 2a shows the central region of nebula in optical wavelengths. The right panel (figure 2b) shows the composite colour image (: blue, : green and : red) of McNeil’s nebula observed on 2004 October 18. The cometary infrared nebula is clearly seen extending towards north from the NIR source (V1647 Ori) and has a cavity structure with possibly two rims extending toward north-east and north-west (see also Ojha et al. 2005). The north-east rim is brighter and sharp, while the north-west rim is diffuse and is not seen clearly. The north-east rim can be traced out to 30″ or 12000 AU at a surface brightness of 18.0 mag arcsec-2 (where we assume that the distance to McNeil’s nebula is 400 pc; Anthony-Twarog 1982). Such kind of morphology can probably be seen when the eruption has cleared out some of the dust and gas in the envelope surrounding the young star, allowing light to escape and to illuminate a cone-shaped cavity carved out by previous eruptions (Reipurth and Aspin 2004).
In figure 3a, we show a contour diagram of the region around V1647 Ori, as seen in our -band image obtained on 2004 October 18. The star is surrounded by a compact reflection nebulosity and there is a southward continuation of the extended nebula in NIR, which is demonstrated in the PSF-subtracted -band image of figure 3b. This was confirmed by comparing the PSF of the NIR central source (V1647 Ori) with the PSF of the star located about 30″ south-west of V1647 Ori (figure 3b). We find that the compact IR nebula that encloses all of the nebular structure, including the two rims, has a diameter of about 60″.
An optical/IR comparison of the region surrounding McNeil’s nebula (see figures 2 and 4) shows that the position of the bright infrared source is coincident with that of an optical source at the apex of the nebula that is illuminating the fan-shaped cloud of gas, or nebula (Reipurth and Aspin 2004). The optical nebula is more widely and predominantly extended to the north, whereas the IR nebula is relatively confined, but definitely extended to the south, too. The greenest portion of the optical nebula is not seen in IR including the knot HH 22 to the north-east and the green patch to the north (see figures 1, 2 and 4). There is a clear colour gradient from north to south ( colour varies from 0.53 to 1.33 from north to south), as well as from inside to outside of the cavity. The gradient is very steep near the central star, and the southern extension of the nebula is seen only at IR. This large colour gradient and the absence of optical nebula to the south is suggestive of a large scale disk-like structure (or envelope) surrounding the central source that hides the southern nebula in optical. This is often the case for YSOs associated with a cometary nebula (e.g., Tamura et al. 1991).
3.2 Optical/IR Variability of V1647 Ori
Optical and NIR photometric results of V1647 Ori obtained on 27 nights (2004 February – 2005 December) are listed in Tables 2 and 3.
The optical photometry shows a general decline of brightness in V1647 Ori both in the beginning and later part of our observations with an intermediate brightening phase. In our dataset V1647 Ori is brightest on 2004 October 18 (see Table 2). McNeil’s nebula itself has now faded considerably (see Table 2). A significant variation in the source brightness ( = 3.43 mag, = 3.36 mag and = 3.14 mag) can be seen during a period of about 21 months (2004 February – 2005 November; Table 2). We can also see a considerable variation in the source brightness ( = 0.78 mag, = 0.44 mag and = 0.21 mag) during a period of one month (2004 October – November; Table 2). The difference in magnitudes is much larger than the photometric errors ( 0.05 mag). For comparison, the magnitudes of the reference star A ((, )2000 = , -00∘03′37″; marked in figure 1) are listed in Table 5 along with other results from the literature, which match quite well with our measurements. As can be seen in Table 5, we do not see any significant variation ( 0.05 mag, which is the estimated photometric error) in the magnitudes of the reference star A. Hence, the brightness variation seen in V1647 Ori during a period of one month (2004 October – November) is real. It is also seen that the variability is larger at shorter wavelengths compared to the longer ones (Table 2).
The differential light curve (2004 February – 2005 November) of V1647 Ori in -band is shown in figure 5. Semkov (2004) reported the photometric observations of V1647 Ori and found that the source varied with amplitude of 0.5 mag during the period 2004 August 18 – October 3. In figure 5 we have also plotted the -band light curve from Semkov (2004). The optical light curve shows a variable nature of V1647 Ori. After a significant increase in the brightness around 2004 October 18, a general decline in the source brightness can be seen in recent observations. Over the one and half year that we followed the star (2004 February – 2005 November), the brightness has decreased by more than 3 magnitudes in -band. The shapes of the light curves are similar in other optical bands.
A comparison of the magnitudes (see Table 3) of V1647 Ori shows that the source has varied over the time of observation between 2MASS (1998 October) and HCT/PRL (2005 November/December). We also see a significant variation in the source brightness ( = 0.13 mag, = 0.26 mag, and = 0.14 mag) during a period of one week (2004 October 12 – 18). A similar kind of weekly variation in NIR magnitudes of V1647 Ori during the early phase of outburst (2004 February 23 – 29) was reported by Ojha et al. (2004, 2005). The short time variability in optical and NIR wavelengths in V1647 Ori was also noticed by Walter et al. (2004). They found a general decline in brightness of about 0.3–0.4 magnitudes during 87 days (2004 February 11 – May 7).
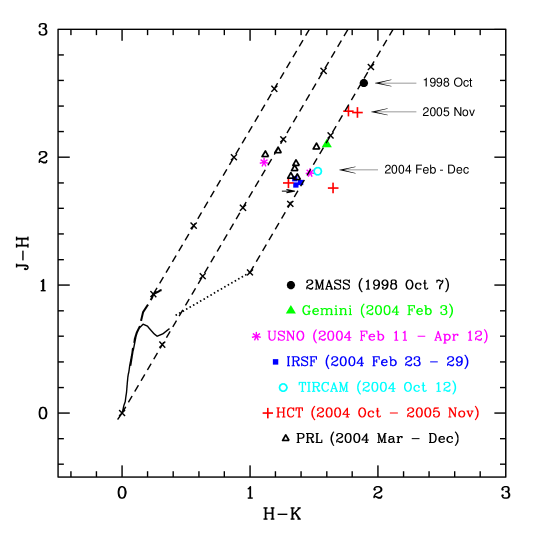
Figure 6 shows a colour-colour (CC) diagram. We notice changes of the infrared colours of V1647 Ori from before eruption (1998) to after the eruption (2004 - 2005). A general movement along a reddening vector can be seen during 1998 – 2005. The source had moved toward the tip of the locus of classical T Tauri stars (Meyer et al. 1997) during 2004. This suggests that V1647 Ori has NIR colour similar to a dereddened T Tauri star. The and colours indicate that the circumstellar matter of 8 mag was probably cleared in the eruption, in less than six years since the 2MASS observations. This scenario is consistent with the present IR morphology of the McNeil’s nebula region (see §3.1). There are colour changes between the most recent measurements (2005 November) and those close to peak brightness (2004). The source has now become redder and fainter and moved back along a reddening vector in the CC diagram.
The brightness increase in all the optical and NIR bands near the outburst peak (early 2004) tells that the accretion disk luminosity that depends directly on the accretion rate must have gone up. As the enhanced acceretion has decreased over a period of about two years the disk luminosity too has decreased. So it may be predominantly the stellar plus the original disk excess as seen in the infrared. The position in the CC diagram therefore is a combination of extinction and thermal dust emission. As the object is embedded in dust and gas there will also be some reflection effects.
3.3 Spectral Features
The optical spectra of V1647 Ori obtained with HCT are shown in figure 7. The spectra show a very red continuum with a number of emission features. The and Ca II IR triplet lines are in emission. The presence of the Ca II IR triplet in emission confirms that V1647 Ori is a pre-main-sequence star. We also identified a few lines of the Paschen series of hydrogen at low signal-to-noise ratio level (e.g. Pa 23, Pa 20, Pa 19, Pa 18, Pa 17, Pa 12, Pa 11 and Pa 10) in our deep spectra of 2005 September 8 and 28 in the wavelength range 8340 – 9020Å. In our spectra, the OI line is seen in absorption. The detection of OI 7773 line indicates that the optical light probably originates in the low-gravity, hot photosphere of the inner disk (Walter et al. 2004). Since our spectra are not corrected for telluric features, we see the absorptions at about 7600Å and 8230Å due to atmospheric O2-A and H2Oz bands, respectively. In the spectrum taken on 2005 September 8, we detected the Mg I line at 8807Å and Fe I at 8824Å rather marginally. Table 6 shows the equivalent width (EW) measurements of , OI 7773 and Ca II IR triplet from HCT spectra. We estimate the measurement uncertainties in the EW to be of the order of 2%. The EW of the Ca II triplet are nearly same which is in contrast with the results of Walter et al. (2004), where the ratio of the triplet EWs was shown to be 2:2:1. Interestingly Walter et al had used a resolution similar to ours. It must be noted here that in our data the Ca II triplet lines have not been de-blended for the HI Pa 13, 15 and 16 lines. Since the other Paschen lines are not seen as prominently as the towering Ca II triplet, we do not expect significant contamination in Ca II triplet by Pa 13, 15 and 16 lines.
Due to the somewhat low/medium resolution, we can not resolve the actual FWHMs and peak heights of the components of the triplet which would have probably thrown some light on the possible optical depth variations within the Ca II emission regions. In general the Ca II triplet arises from optically thick regions of electron densities of about 109–1010 cm-3, with temperatures between about 4000–10000 K (Ferland & Persson 1989). Following the arguments of Hamann & Persson (1992) for T Tauri stars, we infer from the nearly equal EWs of Ca II triplet lines that the collisional decay is more dominant process than radiative decay. This in turn implies that the product of optical depth and electron density needs to be more than or equal to about 1013 cm-3 (see Hamann & Persson 1992). Coupling this argument with the absence of the [Ca II] lines at 7300Å in the HCT spectra, we may conclude that the density of the Ca II region is very large and is optically very thick.
On one occasion, namely 2005 September 8, the HCT spectra show clearly the Ca II forbidden doublet at 8912/8927Å, while the other forbidden doublet at 7291/7323Å is still absent. These forbidden lines arise in optically thin regions in comparison with the Ca II permitted lines, otherwise they will be de-excited by collisions. The doublet 8912/8927Å is about 8.4 eV from the ground state while the doublet 7291/7323Å is only 1.7 eV (e.g., Lang 1978). This is probably indicative of the high temperature of the chromosphere of the T Tauri type star that we are monitoring. This region must also have a lower density than the triplet region in order not to get de-excited by collisions. Hamann & Persson (1992) noticed that [Ca II] lines occur rarely in T Tauri stars and in some cases where they did, they showed blue-shifted profiles. Since the HCT spectrum is rather spiky in the region near the doublet, it is difficult to say if the line peak is Doppler shifted.
The HCT spectra show prominent broad line on all occasions with varying EW (see figure 8). The line seems to arise from regions having large scale turbulent velocities in comparison to the narrow lines of Ca II. The FWHMs of the emission lines (after correcting for instrumental broadening by using quadrature formula) show variations ranging from 300 to 600 km/s. Such large widths are quite common in T Tauri stars (e.g., Hamann & Persson 1992). There appears to be a positive correlation between the and the Ca II EWs indicating that the two emitting regions are responsive to each other (Hamann & Persson 1992). We do not see this correlation in OI 7773 line (in absorption) which occurs in rather cooler regions in comparison.
The strong is in emission, with a P Cygni absorption feature seen in the early phase of outburst (2004 February 22 and 23; see figure 8), first reported by Reipurth and Aspin (2004). Similar P Cygni absorption features are also seen in the Ca II IR triplet in early outburst spectra of V1647 Ori. The pronounced P Cygni profile seen in is likely to be formed in a strong wind that has sufficient optical depth to produce the deep blue-shifted absorption trough. The well-defined blue edge of the absorption trough indicates a wind velocity of 420 – 460 km/s (figure 8; see also Maheswar and Bhatt 2004). This implies significant mass-loss in a powerful wind. We notice a significant decrease in the depth and the extent of this strong absorption component over the period of our observations (figure 8), as also reported by Aspin and Reipurth (2005). This suggests weakening of the powerful wind.
Figure 9 shws the time variation of the EW over a period of about 19 months, which includes data from Walter et al (2004). The data from Walter et al (2004) indicate an oscillatory or periodic variation of the EW. We also probably see such a variation in our dataset. Power spectrum analysis indicates the period of oscillations to be 40 days. This variation may probably be caused by temporal variations in the wind/accretion flow or by the rotational period of V1647 Ori. However, poor time sampling prevents us from making definitive conclusions about the periodic variation in EW.
From Table 6 we notice that the strength of the H emission line has increased, whereas the OI 7773 line in absorption appears quite strong in the early phase of outburst (2004 February – November) and has become weaker (in fact it is not seen clearly on 2005 September 28). Compared to the early outburst stages, Ca II IR triplet lines also show significant strengthening. Hamann and Persson (1992) have suggested that the OI 7773 absorptions are entirely due to warm gas in the envelope and the presence of this line suggests either a rotating disk or a highly turbulent envelope. If it were an outburst then turbulence in the envelope gas is expected initially which in turn gives stronger OI 7773 line. But as the time progresses, the turbulence may die down and the line becomes weaker. Hence variability in the OI 7773 line indeed indicates an outburst activity in the source.
3.4 Possible EXor Event ?
Two classes of erupting low-mass YSOs have emerged: FUors, which display outbursts of 4 magnitudes and more that last several decades and EXors, which show smaller outbursts ( 2–3 mag) that last from a few months to a few years and may occur repeatedly (Herbig 1977; Bell et al. 1995; Hartmann 1998). V1647 Ori had brightened by about 3 magnitudes in , relative to the 1998 2MASS measurements and is probably returning to its pre-outburst state. It is therefore possible that we had witnessed an EX Orionis kind of behavior, since the source has about the correct amplitude (Reipurth and Aspin 2004; Ojha et al. 2005). The time elapsed since the outburst of V1647 Ori is more than two years now. During this period our optical data show a significant variation in the source brightness (see Table 2); the latest optical images show that V1647 Ori has faded by more than 3 magnitude since February 2004. We also notice a significant weekly and monthly variations in the brightness of V1647 Ori over the period of our observations (2004 February – 2005 November/December; see Tables 2 and 3). Similar kind of variations are also seen from the light curves of Walter et al. (2004). This seems to suggest that we are probably witnessing a sporadic or episodic outburst (e.g., Herbig et al. 2001), which may indicate an EXor kind of eruption of V1647 Ori. However, further photometric monitoring of the object is required to settle the class of eruptive variables to which V1647 Ori belongs.
V1647 Ori has now started a very rapid fading. The object may indeed be returning to its pre-outburst characteristics though in the NIR it is still 1.3 – 1.4 mag brighter than the 2MASS (pre-outburst) brightness. At both optical and NIR, the object was bluer and brighter near the outburst peak brightness and is now redder and fainter. Such a behaviour would be expected if during the outburst a disk, hotter than the stellar photosphere, dominated the luminosity signifying high accretion rate. With the decline in the accretion, the luminosity is now dominated by the star (cool late type) and a less pronounced disk still emits some excess IR. This also shows that the outburst is essentially caused by accretion enhancement.
4 Conclusions
In this paper we have presented long-term, post-outburst photometric and spectroscopic monitoring of V1647 Ori. Following conclusions are drawn from our study:
1) The optical data show that V1647 Ori has faded by more than 3 magnitude since February 2004. We also see significant variations in the brightness of V1647 Ori within a period of one week ( 0.3 mag) and one month ( 0.8 mag). This shows the eruptive behaviour of McNeil’s nebula.
2) McNeil’s nebula has a cavity structure with possibly two rims as seen in NIR wavelengths. This kind of morphology might have been produced by the eruption that has cleared out a part of the envelope surrounding the young star. This scenario is supported by the and colours (near the outburst peak brightness) of V1647 Ori which indicate that the circumstellar matter of 8 mag was probably cleared in the eruption.
3) An optical/IR comparison of McNeil’s nebula shows that the optical nebula is more widely and predominantly extended to the north, while the IR nebula is relatively confined, but definitely extended, to the south, too. This colour gradient of the nebula is most likely due to the presence of a large scale disk-like structure (or envelope) around the young star.
4) The optical spectra show H line strongly in emission and display a pronounced P Cygni profile, with an absorption trough reaching a velocity of 460 km/s during the early phase of outburst. The depth and the extent of the strong absorption component have decreased significantly over the period of our observations, suggesting that the powerful wind is weakening. Variation in line strength on the time scale of 1 day is also seen.
5) The presence of strong emission lines, relatively fast fading rate and the low accretion rate (10-5 M⊙/yr; Muzerolle et al. 2005) of V1647 Ori suggest probably the evidence for a new EXor event.
5 Acknowledgements
The observations reported in this paper were obtained using the 2m Himalayan Chandra Telescope at IAO Hanle, the high altitude station of the Indian Institute of Astrophysics, Bangalore. We thank the staff at IAO and at the remote control station at CREST, Hosakote for assistance during the observations. It is a pleasure to thank the staff at Mount Abu IR observatory for their support during the observations. We especially thank to the referee Dr. William Sherry for the critical reading of our manuscript.
References
- (1) Ábrahám Ṕ., Kóspál Á., Csizmadia Sz., et al., 2004, A&A, 419, L39
- (2) Andrews S.M., Rothberg B., Simon T., 2004, ApJ, 610, L45
- (3) Anthony-Twarog B.J., 1982, AJ, 87, 1213
- (4) Aspin C., Reipurth B., 2005, IAU Circ., 8600
- (5) Bell K.R., Lin D.N.C., Hartmann L.W., Kenyon S.J., 1995, ApJ, 444, 376
- (6) Bessell M.S., Brett J.M., 1988, PASP, 100, 1134
- (7) Briceño C., Vivas A.K., Hernández J., et al., 2004, ApJ, 606, L123
- (8) Eisloffel J., Mundt R., 1997, AJ, 114, 280
- (9) Ferland G.J., Persson S.E., 1989, ApJ, 347, 656
- (10) Grosso N., Kastner J.H., Ozawa H., et al., 2005, A&A, 438, 159
- (11) Hamann F., Persson S.E., 1992, ApJS, 82, 247
- (12) Hartmann L. 1998, in Accretion Processes in Star Formation, Cambridge Univ. Press, Cambridge
- (13) Henden A., 2004, http://spiff.rit.edu/classes/phys440/lectures/new-star/mcneil.dat
- (14) Herbig G.H., 1977, ApJ, 217, 693
- (15) Herbig G.H., Aspin C., Gilmore A.C., et al., 2001, PASP, 113, 1547
- (16) Hunt L.K., Mannucci F., Testi L., et al., 1998, AJ, 115, 2594
- (17) Kastner J.H., Richmond M., Grosso N., et al., 2004, Nature, 430, 429
- (18) Kóspál Á., Ábrahám Ṕ, Acosta-Pulido J., et al., 2005, Information Bulletin on Variable Stars, 5661, 1
- (19) Kun M., Acosta-Pulido J.A., Moór A., et al., 2004, A&A (submitted) (astro-ph/0408432)
- (20) Landolt A.U., 1992, AJ, 104, 340
- (21) Lang K.R., in Astrophysical Formulae, Springer Verlag, Berlin, 1978, p. 141
- (22) Maheswar G., Bhatt H.C., 2004, IAU Circ., 8295
- (23) McGehee P.M., Smith J.A., Henden A.A., et al., 2004, ApJ, 616, 1058
- (24) McNeil J.W., 2004, IAU Circ., 8284
- (25) Meyer M.R., Calvet N., Hillenbrand L.A., 1997, AJ, 114, 288
- (26) Muzerolle J., Megeath S.T., Flaherty K.M., et al., 2005, ApJ, 620, L107
- (27) Ojha D.K., Ghosh S.K., Verma R.P., et al., 2002, Bull. Astron. Soc. India, 30, 827
- (28) Ojha D.K., Kusakabe N., Tamura M., 2004, IAU Circ., 8306
- (29) Ojha D.K., Kusakabe N., Tamura M., et al., 2005, PASJ, 57, 203
- (30) Reipurth B., Aspin C., 2004, ApJ, 606, L119
- (31) Rieke G.H., Lebofsky M.J., 1985, ApJ, 288, 618
- (32) Samus N.N., 2004, IAU Circ., 8354
- (33) Semkov E.H., 2004, Information Bulletin on Variable Stars, 5578, 1
- (34) Stetson P.B., 1987, PASP, 99, 191
- (35) Tamura M., Gatley I., Waller W., Werner M.W., 1991, ApJ, 374, L25
- (36) Vacca W.D., Cushing M.C., Simon T., 2004, ApJ, 609, L29
- (37) Vig S., Ghosh S.K., Ojha D.K., Kulkarni V.K., 2004, IAU Circ. 8354
- (38) Vig S., Ghosh S.K., Kulkarni V.K., Ojha D.K., 2005, A&A (accepted; astro-ph/0510458)
- (39) Walter F.M., Stringfellow G.S., Sherry W.H., Pollatou A.F., 2004, AJ, 128, 1872
| Date (UT) | JD | FWHM† | ±Filter(s) | Exposure time (in secs) | Notes |
|---|---|---|---|---|---|
| 2004 Feb 12 | 2453048.1 | 1.2″ | 480, 240 | 1 | |
| 2004 Feb 13 | 2453049.1 | 2.3″ | 90 | 2 | |
| 2004 Feb 14 | 2453050.2 | 1.5″ | 200, 270, 90, 900 | … | |
| 2004 Feb 22 | 2453057.9 | 1.4″ | 300, 150, 150 | … | |
| 2004 Feb 23 | 2453058.9 | 1.7″ | 1200, 150 | 1 | |
| 2004 Oct 18 | 2453297.4 | 2.3″ | 300, 300, 300, 300, 600 | … | |
| 2004 Nov 17 | 2453327.4 | 1.4″ | 600, 900, 540, 360, 900 | … | |
| 2004 Dec 7 | 2453347.3 | 1.8″ | 600, 720, 600, 480, 1200 | … | |
| 2005 Jan 8 | 2453379.1 | 1.5″ | 120 | 2 | |
| 2005 Jan 9 | 2453380.1 | 2.1″ | 60 | 2 | |
| 2005 Mar 28 | 2453458.1 | 1.7″ | 900 | 2 | |
| 2005 Sep 26 | 2453639.6 | 1.5″ | 1200, 600 | … | |
| 2005 Sep 29 | 2453643.5 | 1.4″ | 900, 450, 450 | … | |
| 2005 Nov 9 | 2453684.3 | 1.3″ | 300, 440, 420 | 1 | |
| 2005 Nov 20 | 2453695.2 | 2.0″ | 600, 450, 450 | 1 | |
| 2005 Nov 21 | 2453696.4 | 1.3″ | 420, 420, 420 | 1 | |
| 2005 Nov 28 | 2453703.2 | 1.5″ | 600, 1800, 720 | … | |
| 2005 Nov 29 | 2453704.2 | 1.7″ | 1200 | 2 | |
| 2005 Nov 30 | 2453705.2 | 1.6″ | 600, 1200, 720 | … |
†Measured average FWHM. This is a measure of the seeing.
±Observations were made in Bessel filters.
1Magnitudes of V1647 Ori were obtained by using a reference star as a secondary standard in the field.
2Only differential photometry was done.
| Date (UT) | V1647 Ori† | McNeil’s nebula§ | |||||||
|---|---|---|---|---|---|---|---|---|---|
| ±2004 Feb 12 | … | … | 16.91.02 | 14.82.02 | … | … | 13.18.02 | 12.13.02 | |
| 2004 Feb 14 | … | 18.68.04 | 16.83.02 | 14.86.02 | … | 13.98.04 | 13.19.02 | 12.19.02 | |
| 2004 Feb 22 | … | 18.85.01 | 16.92.02 | 14.81.01 | 14.54.01 | 13.62.01 | 12.98.02 | 11.94.01 | |
| ±2004 Feb 23 | 20.44.01 | … | 16.74.01 | … | 14.44.01 | … | 13.00.01 | … | |
| ∗2004 Oct 18 | … | 18.02.05 | 16.51.05 | 14.76.05 | 14.77.05 | 13.87.05 | 13.16.05 | 12.05.05 | |
| 2004 Nov 17 | 20.64.04 | 18.80.02 | 16.95.01 | 14.97.02 | 14.85.04 | 13.87.02 | 13.19.01 | 12.09.02 | |
| 2004 Dec 7 | 20.72.05 | 19.08.01 | 17.15.02 | 15.13.02 | 14.82.05 | 13.90.01 | 13.26.02 | 12.05.02 | |
| ∗2005 Sep 26 | … | 19.82.02 | 17.94.02 | … | … | 14.92.02 | 14.12.02 | … | |
| ∗2005 Sep 29 | … | 19.82.01 | 18.09.01 | … | 15.88.01 | 15.01.01 | 14.11.01 | … | |
| ±2005 Nov 9 | … | 21.45.05 | 19.46.04 | 17.34.05 | … | 16.02.05 | 14.94.04 | 13.57.05 | |
| ±2005 Nov 20 | … | 21.45∗∗ | 19.76.04 | 17.61.02 | … | 16.66.05 | 15.24.04 | 13.72.02 | |
| ±2005 Nov 21 | … | 21.45∗∗ | 19.83.02 | 17.56.02 | … | 16.96.04 | 15.19.02 | 13.58.02 | |
| 2005 Nov 28 | … | 22.11.05 | 20.02.03 | 17.93.05 | … | 16.90.05 | 15.14.03 | 13.60.05 | |
| 2005 Nov 30 | … | 22.11∗∗ | 20.10.05 | 17.95.02 | … | 16.62.05 | 15.18.05 | 13.78.02 | |
±Magnitudes are derived using star A (see text) as a secondary calibrator.
†PSF magnitudes.
§Magnitudes in 80″ aperture centred on V1647 Ori.
∗Too faint to be detected in -band.
∗∗Source is not detected in -band with exposure time of 600s.
| Date (UT) | FWHM | Telescope | |||
|---|---|---|---|---|---|
| 1998 Oct 7 | 14.74.03 | 12.16.03 | 10.27.02 | … | 2MASS |
| 2004 Feb 3 | 11.1.1 | 9.0.1 | 7.4.1 | 0.5″ | Gemini† |
| 2004 Feb 11 | 10.79.01 | 8.83.01 | 7.72.01 | … | USNO§ |
| 2004 Feb 12 | 10.68.04 | 8.78.04 | … | 1.2″ | HCT |
| 2004 Feb 23 | 10.74.05 | 8.93.01 | 7.40.02 | 1.6″ | IRSF∗ |
| 2004 Feb 25 | 10.79.05 | 8.95.01 | 7.47.01 | 0.9″ | IRSF∗ |
| 2004 Feb 29 | 10.90.06 | 9.11.01 | 7.62.02 | 1.4″ | IRSF∗ |
| 2004 Mar 20 | 10.85.07 | 8.83.02 | 7.71.05 | 1.7″ | PRL/NICMOS |
| 2004 Mar 21 | 10.76.02 | 8.91.01 | 7.59.03 | 1.8″ | PRL/NICMOS |
| 2004 Apr 11 | 11.09.03 | 9.01.02 | 7.49.03 | 2.5″ | PRL/NICMOS |
| 2004 Apr 12 | 10.94.02 | 9.06.02 | 7.59.02 | … | USNO§ |
| 2004 Oct 12 | 10.76.06 | 8.87.06 | 7.34.06 | 2.1″ | TIRCAM |
| 2004 Oct 16 | 11.15.01 | 9.24.02 | 7.89.01 | 1.7″ | PRL/NICMOS |
| 2004 Oct 17 | 11.18.02 | 9.23.01 | 7.87.02 | 1.7″ | PRL/NICMOS |
| 2004 Oct 18 | 10.89.04 | 9.13.04 | 7.48.04 | 2.3″ | HCT |
| 2004 Nov 19 | 11.13.04 | 9.33.04 | 8.03 | 1.0″ | HCT± |
| 2004 Dec 21 | 11.04.03 | 9.20.01 | 7.83.03 | 2.3″ | PRL/NICMOS |
| 2004 Dec 22 | 11.03.02 | 8.98.01 | 7.76.03 | 2.1″ | PRL/NICMOS |
| 2005 Nov 25 | … | 10.02.07 | … | 2.5″ | PRL/NICMOS |
| 2005 Nov 26 | 13.28.15 | 10.69.09 | … | 2.5″ | PRL/NICMOS |
| 2005 Nov 28 | … | 10.80.02 | 8.95.03 | 1.5″ | HCT |
| 2005 Nov 29 | 13.05.05 | 10.70.05 | 8.86.04 | 1.7″ | HCT |
| 2005 Nov 30 | 13.06.02 | 10.70.03 | 8.93.02 | 1.6″ | HCT |
| 2005 Dec 3 | 13.45.01 | 10.87.01 | … | 1.9″ | PRL/NICMOS |
†Reipurth & Aspin (2004): photometry is obtained in an aperture with radius 0.9″
§McGehee et al. (2004)
∗Ojha et al. (2005): IRSF photometry is obtained in an aperture with radius 7.2″.
±Upper limit in -band is given (source is saturated in -band).
| Date (UT) | JD | Resolution (Å) | Exposure (sec) |
|---|---|---|---|
| 2004 Feb 22 | 2453057.9 | 7 | 900 |
| 2004 Feb 23 | 2453059.2 | 7 | 900 |
| 2004 Nov 16 | 2453326.5 | 15 | 900 |
| 2004 Nov 19 | 2453329.4 | 15 | 900 |
| 2005 Jan 8 | 2453379.2 | 7 | 900 |
| 2005 Jan 9 | 2453380.2 | 7 | 900 |
| 2005 Jan 16 | 2453387.1 | 7 | 900 |
| 2005 Mar 28 | 2453458.2 | 7 | 900 |
| 2005 Sep 8 | 2453621.7 | 7 | 4500 |
| 2005 Sep 28 | 2453642.5 | 7 | 1800 |
| Reference star A | Date (UT) | ||||
|---|---|---|---|---|---|
| USNO-A2.0 0825-01669040 | … | 15.69.01 | 14.93.02 | 14.24.02 | 2004 Feb 14† |
| 16.89.01 | 15.65.01 | 14.88.02 | 14.23.01 | 2004 Feb 22† | |
| 16.93.04 | 15.67.03 | 14.88.03 | 14.20.03 | 2004 Oct 18† | |
| 16.93.02 | 15.63.02 | 14.88.01 | 14.23.02 | 2004 Nov 17† | |
| 16.92.02 | 15.68.01 | 14.86.02 | 14.23.01 | 2004 Dec 7† | |
| … | 15.65.01 | 14.89.01 | … | 2005 Sep 26† | |
| 16.94.01 | 15.66.01 | 14.89.01 | … | 2005 Sep 29† | |
| … | 15.67.01 | 14.91.01 | 14.23.01 | 2005 Nov 28† | |
| … | 15.69.01 | 14.92.01 | 14.25.01 | 2005 Nov 30† | |
| 16.92.01 | 15.66.01 | 14.87.01 | 14.21.01 | 2004 Feb§ | |
| … | 15.65 | 14.91 | 14.26 | 2004 Apr 24± | |
| … | 15.66.02 | 14.89.02 | 14.23.05 | 2004 Aug – Oct∗ |
†From HCT
§From Henden’s table (2004) of photometric measurements around McNeil’s nebula
±from Kun et al. (2004)
∗from Semkov (2004)
| Date (UT) | Wλ (6563) | Wλ (OI 7773) | Wλ (8498) | Wλ (8542) | Wλ (8662) |
|---|---|---|---|---|---|
| 2004 Feb 22 | -34.59 | 3.82 | -8.67 | -9.56 | -7.72 |
| 2004 Feb 23 | -33.62 | 2.63 | -7.67 | -7.84 | -6.58 |
| 2004 Nov 16 | -27.25 | 5.41 | -12.91 | -10.14 | -12.39 |
| 2004 Nov 19 | -41.73 | 4.02 | -15.62 | -14.79 | -12.16 |
| 2005 Jan 8 | -28.81 | 2.81 | -9.70 | -9.08 | -7.20 |
| 2005 Jan 9 | -27.72 | 2.74 | -9.34 | -9.09 | -7.17 |
| 2005 Jan 16 | -32.54 | 2.69 | -9.66 | -10.17 | -8.68 |
| 2005 Mar 28 | -20.34 | 2.98 | -10.66 | -9.62 | -11.23 |
| 2005 Sep 8 | -26.16 | 2.58 | -16.73 | -19.10 | -18.43 |
| ±2005 Sep 28 | -40.75 | … | -18.43 | -21.11 | -19.30 |
±OI line is not clearly seen.