Microwave emission from spinning dust in circumstellar disks.
Abstract
In the high density environments of circumstellar disks dust grains are expected to grow to large sizes by coagulation. Somewhat unexpectedly, recent near-IR observations of PAH features from disks around Herbig Ae/Be stars demonstrate that substantial amount of dust mass in these disks (up to several tens of per cent of the total carbon content) can be locked up in particles with sizes ranging from several to tens of nanometers. We investigate the possibility of detecting the electric dipole emission produced by these nanoparticles as they spin at thermal rates (tens of GHz) in cold gas. We show that such emission peaks in the microwave range and dominates over the thermal disk emission at GHz typically by a factor of several if of the total carbon abundance is locked up in nanoparticles. We test the sensitivity of this prediction to various stellar and disk parameters and show that if the potential contamination of the spinning dust component by the free-free and/or synchrotron emission can be removed, then the best chances of detecting this emission would be in disks with small opacity, having SEDs with steep sub-mm slopes (which minimizes thermal disk emission at GHz frequencies). Detection of the spinning dust emission would provide important evidence for the existence, properties, and origin of the population of small dust particles in protoplanetary disks, with possible ramifications for planet formation.
Subject headings:
accretion, accretion disks — circumstellar matter — stars: pre-main-sequence1. Introduction
Recent IR and sub-mm observations of disks around young stars strongly support the idea that dust grains in these disks are significantly evolved compared to their ISM counterparts. There is mounting evidence that in many young stellar systems dust grains have sizes reaching cm (Testi et al. 2003; Acke et al. 2004; Natta et al. 2004), in contrast to sub-micron sizes of the ISM dust particles, which is a natural consequence of grain growth by coagulation. This process is often accompanied by the change of the material properties of dust grains indicated by their increased chrystallinity (van Boekel et al. 2005) and by settling of dust towards the disk midplane inferred from the change of the shape of the spectral energy distribution (SED) of disks (Acke et al. 2004). Observational evidence for dust growth exists not only in protoplanetary disks around T Tauri stars (stellar mass ), but also in their analogs around higher mass () Herbig Ae/Be stars (van Kerckhoven, Tielens, & Waelkens 2002; Sloan et al. 2005; Schütz, Meeus, & Sterzik 2005; Habart et al. 2005), as well as in disks around substellar objects (Apai et al. 2005).
At the same time, recent observations of the polycyclic aromatic hydrocarbon (PAH) spectral features in disks of Herbig Ae/Be stars (Meeus et al. 2001; Acke & van den Ancker 2004) provide evidence for the presence of a significant population of very small dust grains (sizes Å) in these disks. Previously, the existence of a significant amount of carbonaceous nanoparticles in the ISM has been proposed to explain the IRAS observations of “unidentified infrared” emission features and strong mid-infrared emission component resulting from the starlight reprocessing by the ultrasmall grains (Boulanger & Pérault 1988). The proposed fraction of the ISM carbon mass locked up in very small grains considerably exceeds that implied by the extension of the conventional MRN dust size distribution (Mathis, Rumpl, & Nordsieck 1977) to very small sizes, below Å. This suggests the existence of a separate population of very small carbonaceous grains which is distinct from the MRN distribution and contains of C in the ISM (Leger & Puget 1984; Draine & Anderson 1985). Thus, it is not surprising that nanoscale dust particles should exist at some level in disks111Possible origin of observed PAH emission in the roughly spherical envelopes around stars rather than in disks is unlikely given the correlation between the strength of the PAH emission and the disk geometry inferred from the SED shape (Habart et al. 2004). around Herbig Ae/Be stars since the latter were originally part of the ISM. However, the detailed modeling of the IR emission features in these systems suggests that PAHs may contain as much as several tens of per cent of total C mass in disks (Habart, Natta & Krügel 2004). Thus, it appear that small dust population in these disks does not only withstand coagulation, but on the contrary may have gained some additional mass, presumably due to the fragmentation of larger particles. This suggests very interesting size-dependent evolution of the dust population in Herbig Ae/Be disks. In the case of disks around T Tauri stars and brown dwarfs it is difficult to make definite statements about the presence of small dust grains because of the lack of strong stellar UV fluxes needed for exciting PAH molecules (although see Gürtler et al. 1999).
In this paper we describe a new observational channel for probing the presence and properties of very small dust grains in disks around young stellar objects. In the outer parts of these disks, AU from the central star, nanometer-size dust particles spin at thermal rates of several tens of GHz. Because of their intrinsic dipole moments, these “macromolecules” emit electric dipole radiation in the microwave band where the thermal Rayleigh-Jeans emission of the circumstellar disk is rather weak. This makes it possible to disentangle the spinning dust contribution to the disk emission and study the properties of this dust component. We describe the physics of the spinning dust emission and analyze its observational signatures in §2. Applications of our results are discussed in §3.
2. Emission from spinning dust grains.
Ferrara & Dettmar (1994) proposed that charged ISM dust grains spinning at thermal rates can produce observable microwave emission via electric dipole radiation. This mechanism has been further investigated in detail by Draine and Lazarian (1998b; hereafter DL98) who considered, among other things, intrinsic dipole moments of grains, various processes governing the nonthermal spin rates of grains, and a size distribution of emitting nanoscale particles consistent with previous detections of PAH emission from the ISM. In this paper we will largely follow the approach adopted in these pioneering investigations.
2.1. Circumstellar disk model.
We describe the structure of the circumstellar disk using conventional two-temperature flared disk model of Chiang & Goldreich (1997) which states that the vertical extent of the disk can be split into two well-defined regions: upper exposed layer in which dust absorbs most of the incoming starlight and reradiates it in the infrared, and lower shielded region which is hidden from direct starlight and is warmed only by the reprocessed radiation of the outer layer. For our purposes both layers can be considered isothermal with different temperatures. Temperature of the shielded layer is lower than that of the overlaying exposed layer by a factor of several.
The amount of mass contained in the exposed layer is very small: fraction of the total disk surface density corresponding to this layer is , where is the disk flaring angle and is the Planck opacity at the stellar temperature. Since it is likely that even in the distant parts of the disk , shielded region must contain most of the disk mass. Thus, if small particles are well mixed throughout the disk (which is a reasonable assumption for very small grains having settling times longer than the disk lifetime) most of the small dust particles must be shielded from the direct stellar illumination by the outer exposed layer. This inference significantly simplifies our subsequent treatment.
We assume a simple power-law profile for the disk surface density
| (1) |
where is the distance from the star normalized by 1 AU, is the surface density at 1 AU, and is a parameter that we can vary. Midplane temperature profile needed for the calculation of the grain spin rates is computed in Appendix A according to the prescription of the flared disk model of Chiang & Goldreich (1997).
At the low temperatures of interest for us opacity is due to dust grains. At long wavelengths typically scales as a power law of and we adopt in this study (following the notation of Beckwith et al. 1990)
| (2) |
where is the radiation frequency normalized by Hz and is the opacity at Hz. Power law index can be directly measured from the disk SED in the submillimeter range and in protoplanetary disks it varies from to (Kitamura et al. 2002), while ISM emission is characterized by (Finkbeiner, Davis, & Schlegel 1999). Small values of in protoplanetary disks are interpreted as the evidence for grain growth (Natta et al. 2004; Draine 2005).
Normalization of opacity at a given frequency is rather poorly constrained. Beckwith et al. (1990) advocate using cm2 g-1 while Kramer et al. (1998) find cm2 g-1 which translates into cm2 g-1 for . Draine (2005) modeled absorbing properties of evolved dust populations composed of different materials with MRN size distributions extending to maximum size cm and found and cm2 g-1 (for the dust-to-gas ratio ). Thus, there is at least an order of magnitude spread in the possible values of .
2.2. Spinning dust emissivity.
Midplane regions of circumstellar disks have very low degree of ionization because of intrinsic low temperature and strong shielding of the ionizing stellar radiation and cosmic ray fluxes by the overlying disk layers. As a result, dust grains in the shielded layer are predominantly neutral and their dipole moments are intrinsic and not due to an asymmetric charge distribution. Following DL98 we assume very small dust grains to be composed of randomly oriented chemical substructures so that the total intrinsic dipole moment of the grain scales with the number of atoms in the grain as
| (3) |
Based on the available laboratory data on the dipole moments of the PAH-like particles DL98 have chosen debye in their study, and we adopt this estimate as well.
The power emitted by a grain of radius spinning at frequency is given by
| (4) |
where is the bulk density of grain material and is the mean mass of grain atom ( amu for C:H=3:1 carbonaceous material typical for PAHs). In deriving equation (4) we assumed that grains are spherical [so that ] and that their dipole moments are randomly oriented with respect to their rotational axes.
To calculate the spectrum of the dipole emission of spinning grains we also need to know the size distribution of nanoscale dust particles. Contrary to the expectation of small dust depletion222DL98 assumed that in dense interstellar clouds PAHs are depleted by a factor of . in circumstellar disks, recent observations of PAH features in Herbig Ae/Be disks suggest that very small grains may actually be more abundant in these systems than in the ISM (Habart et al. 2004). By analogy with DL98, we use the following functional form for the grain size distribution
| (5) |
where cm2.5 (Draine & Lee 1984) and are constants, is the typical size of very small carbonaceous grains, and is the width of their log-normal distribution. The first term is a conventional MRN contribution while the second accounts for very small grains. Coefficient is chosen in such a way that the fraction of C locked up in very small grains (with respect to the total abundance C/H=) is . Our baseline model uses (close to the ISM value), Å and , this distribution extends down to a minimum size Å.
2.3. Grain spin rates.
Rotation rates of small dust grains are in general governed by a combination of physical processes: collisions of grains with neutral molecules, Coulomb interactions with charged species, infrared and electric dipole emission, etc. (DL98). Since here we are mainly interested in obtaining reasonable estimate of the importance of the spinning dust emission in disks, we assume that grain rotation is determined by thermal equilibrium.
This assumption is reasonable in the midplane region of the circumstellar disk because of the high gas density and very low ionization fraction there. Consequently, interactions of predominantly neutral dust grains with extremely rare charged particles (plasma drag/excitation and rotational excitation by ion collisions, which are often the most important determinants of grain spin rates in the ISM, see the case of molecular cloud environment in DL98) are completely negligible in this part of disk. As a result, grain-neutral collisions bring particle spin rates in thermal equilibrium with the surrounding gas333Infrared emission by grains is unlikely to strongly affect their spin rates because of low midplane temperatures.. This implies that grain spin rates have Boltzmann distribution
| (6) |
with the rms rotation rate given by
| (7) |
where is the gas temperature normalized to K, is the grain radius in units of cm, and we take g cm-3. For simplicity, we assume grain shapes to be close to spherical implying that their moment of inertia is , although very small particles, like PAHs, are likely to be sheetlike (see DL98 for more refined treatment).
Within the upper exposed layer grains may spin at significantly non-thermal rates (corresponding to temperatures higher than the midplane temperature) but the amount of mass contained in this layer is very small meaning that its contribution to the total spinning dust emission can be neglected in the first approximation.
2.4. Spectrum of the spinning dust emission.

Combining equations (4), (5), and (6) we find the total spectrum of the spinning dust emission produced by the disk:
| (8) | |||||
where and are the inner and outer radii of the disk, is given by equation (7) as a function of , and the maximum grain size is irrelevant for this calculation since is dominated by small grains.
For a simple case of a power law temperature distribution and a dust population with a single characteristic size one finds that
| (9) |
where
| (10) |
are the frequencies determining the extent of the power law segment of . Outer regions of irradiated disks can often be well characterized by which yields slope of the power law section of quite different from characteristic for the thermal disk emission444This expression accounts for the fact that at long wavelengths is dominated by the cool shielded region and the contribution of the warm exposed layer is small.
| (11) |
in the optically thin Rayleigh-Jeans regime (here is a Planck function and is defined in Appendix A): power law index of is for and for ). As a result, one can hope to detect the spinning dust emission only at long wavelengths where may dominate over .
In Figure 1 we plot spectra of the spinning dust emission computed according to the prescription (8) for circumstellar disks with different central objects at different evolutionary stages – massive Herbig Ae/Be star, solar-type T Tauri star, and a brown dwarf. Adopted parameters of these systems are listed in Table 1 and are the same555Except the surface density normalization in the T Tauri model which in our case is comparable to the Minimum Mass Solar Nebula value. as in Dullemond & Natta (2003). In all models we use , , cm2 g-1 and adopt a baseline model of the grain size distribution (5) with parameters listed in §2.2. Disks are assumed to be located pc away from us.
One can see that all three models exhibit significant excesses due to the spinning dust emission around GHz. This component exceeds the thermal power law contribution by a factor ranging from to . Excess appears first at frequencies of about GHz – typical spin frequency of dust grains at low temperatures, see equation (7) – and extends all the way to lower frequencies.
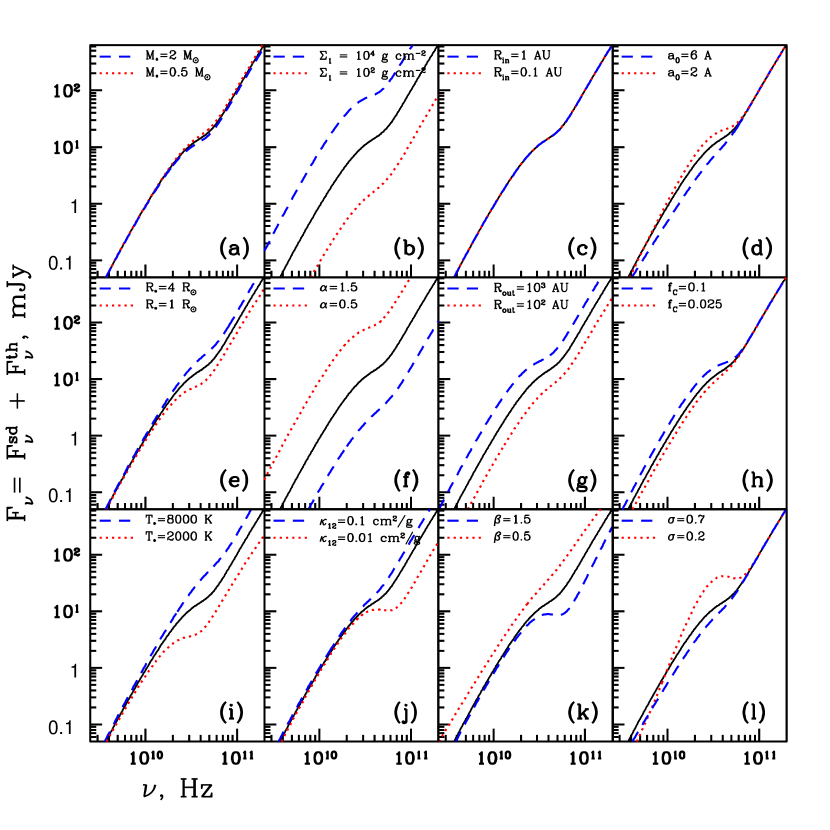
2.5. Sensitivity to stellar and disk parameters.
The appearance of the SED including the spinning dust component depends on a large number of stellar, dust, and disk parameters: , , , , , , etc. To test sensitivity to different parameters we have varied them one at a time to see how spectrum evolves with respect to a fixed fiducial model of the disk+star system. As a fiducial stellar model we have adopted T Tauri model 2 but with M⋆ and AU for the inner edge of the disk. Fiducial model also uses , , cm2 g-1. Parameters of the fiducial dust model are specified in §2.2.
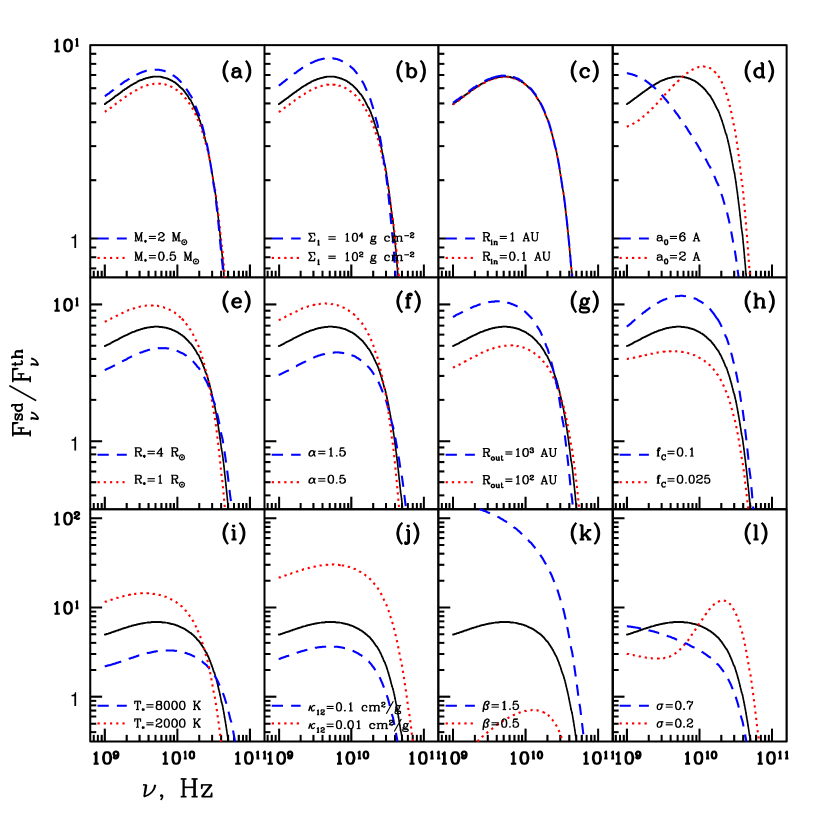
Figure 2 demonstrates how the total microwave spectrum of the disk changes due to the parameter variation. Figure 3 shows the same but for the ratio of fluxes . These plots demonstrate that the microwave spectrum is insensitive to either stellar mass or . The former appears only in the calculation of the radial temperature profile (see Appendix A) which depends on only weakly. The inner radius of the disk does not play any role since at cm wavelengths both the spinning dust emission and the thermal emission of the disk are dominated by the outer region, . Variation of changes mass of the emitting gas which mainly affects the overall flux level (Figure 2g) but also changes somewhat (Figure 3g). The same is true for the spectral sensitivity to and – variation of both parameters mainly affects the emitting dust mass, so the characteristic pattern of spectral evolution is similar to that caused by changing (Figures 2b,f and 3b,f). Spectral sensitivity to and is similar as both parameters determine the stellar luminosity. Changing the parameters of the small dust size distribution – , , and – affects both shape and normalization of the spinning dust spectrum leaving the thermal disk emission (dominated by large grains) unaffected.
Variations of do not affect the spinning dust emission but change the optical depth of the disk which then affects , see Figure 2j. As a result, for low enough opacity (e.g. cm2 g-1) spinning dust emission can dominate over the thermal disk emission by more than an order of magnitude at GHz (see Figure 3j). Similar effect is produced by the variation of the dust emissivity index – it changes the thermal flux of the disk by orders of magnitude since , see Figures 2k and 3k.
Total power produced by the disk determines whether it can be detected in a flux limited observation. But even if such a detection is made, one can disentangle the spinning dust component from the thermal disk emission only if . Examination of Figure 3 demonstrates that this is most easily done for small and/or large . Coagulation of dust particles in dense circumstellar disks environments generally tends to decrease (sometimes below 1), which would hide the spinning dust emission bump in the thermal power law component of the spectrum (see the curve for in Figure 2k). Thus, from the observational point of view the most favorable chances of detecting the spinning dust emission would be in systems having steep sub-mm slopes of the SED ().
3. Discussion.
There is strong evidence for the presence of the spinning dust emission in the data obtained by the CMB experiments (Draine & Lazarian 1998a; Finkbeiner 2004; although see Bennet et al. 2004 for the opposite conclusion) and by the recent Green Bank Galactic Plane Survey (Finkbeiner, Langston, & Minter 2004). It appears that the microwave emission of the spinning dust in the ISM is an established physical phenomenon with substantial observational support. For this reason there is little doubt that it should also be present in the circumstellar disk environments and the two remaining issues would then be of quantitative nature: what is the strength of this emission and whether it could be observed. Results presented in the previous section clearly demonstrate that the spinning dust contribution to the microwave emission is substantial and in many cases significantly exceeds the thermal dust emission at GHz.
The answer to the second question strongly depends on the presence of other spectral contributions in the microwave band. These include free-free emission from the gas heated by the central star or by the nearby massive stars and synchrotron emission from jets and outflows which accompany large fraction of the young stellar objects. Spinning dust emission can be discriminated from these components based on its intrinsic bell-like spectral shape since both free-free and synchrotron are characterized by power-law spectra. Power-law spectral tails at cm wavelengths extending sometimes for more than a decade in frequency have indeed been observed in some objects (Zapata et al. 2005; Eisner & Carpenter 2006) suggesting the contamination by free-free and synchrotron emission. Given broad enough frequency coverage in the radio one can detect these power law components at lower frequencies, extrapolate them to GHz and subtract from the total flux. Spinning dust emission will be present in the remaining flux provided that it dominates over such power law contaminants (its detection would be facilitated by its intrinsic spectral shape).
Another way of deducing possible free-free contamination is to look for H emission from the same object since both components originate in the same hot gas. This would give a useful handle on the expected strength of the free-free flux at low frequencies and demonstrate a priori whether it can compete with the spinning dust emission in the microwave domain. Synchrotron contribution can be identified based on its polarization and the morphology of the synchrotron emitting outflows (for which reasonable quality imaging would be required).
Provided that these difficulties can be successfully overcome, the potential detection (or nondetection) of the spinning dust emission can give us very interesting information on the small dust population in the circumstellar disks. There is already strong evidence for the existence of such population in disks around Herbig Ae/Be stars based on the detection of PAH emission features in the m band (van Kerckhoven et al. 2002; Shütz et al. 2005; Sloan et al. 2005; Habart et al. 2005) excited by copious UV flux of the central star. The total mass of nanoparticles producing near-IR emission features is very small ( M⊕, see van Kerckhoven et al. 2002) but one has to remember that the favorable PAH excitation conditions exist only in the very thin outermost layer of the disk where the stellar UV flux gets fully absorbed. As a result, emission in PAH bands shows only the very tip of the iceberg as it traces an insignificant fraction of the total population of small dust. Most of the nanoparticles must be hidden from stellar UV near the disk midplane (provided that they are homogeneously distributed) and constitute substantial fraction of the total dust population (containing up to of the total C abundance, see Habart et al. 2004). As the spinning dust emission is contributed by all small dust particles (disk is optically thin at microwave frequencies), its detection would give us a very useful probe of the total mass in nanoparticles. Combined with the model for the disk structure, the comparison of the near-IR PAH observations and the spinning dust emission would provide a very good consistency check for the two probes of the small dust population.
A nondetection of the spinning dust emission in Herbig Ae/Be systems may suggest that either (1) vertical mixing in disks around these stars is for some reason inhibited (which is unlikely given that the magnetorotational instability is expected to operate at least in the upper disk layers) or (2) PAH formation is catalyzed by stellar UV in the uppermost disk layer and they are rapidly destroyed in its interior. Both possibilities appear rather exotic. Note that because of the high stellar temperature the contamination with free-free emission may be especially severe in Herbig Ae/Be systems, potentially allowing only the upper limits to be set on the flux due to the spinning dust.
With only few exceptions (e.g. Gürtler et al. 1999) mid-IR PAH emission has not been detected in disks around T Tauri stars or brown dwarves. This fact is consistent with the lack of strong UV flux in this objects, which is necessary for efficient excitation of the PAH features (although see Li & Draine 2002 and Smith, Clayton, & Valencic 2004 for a different opinion), and should not be immediately interpreted as the evidence for the absence of the nanoparticle dust component in these systems. Because of lack of the PAH emission, the microwave emission of spinning dust may be the only666The contribution of very small particles to opacity is degenerate with that of large grains. way in which the small dust could be probed in T Tauri and brown dwarf disks.
Unlike the mid-IR PAH features, spinning dust emission reveals the whole nanoparticle dust population of the disk, which is important in many respects. Small particles affect the ionization balance within the disk since they dominate the dust surface area and are very efficient at immobilization of free charges. This works against the operation of the magnetorotational instability in protoplanetary disks (Fleming & Stone 2003) which, in turn, affects the sizes and positions of the so-called “dead zones” of quiescent non-turbulent material (Gammie 1996), with potential consequences for the planet formation (Matsumura & Pudritz 2005, 2006). Small grains also affect heating of gas in the upper rarefied disk layers due to the higher yield of electrons from PAHs (Kamp & Dullemond 2004).
The very existence of substantial amounts of nanoparticles is very interesting from the evolutionary point of view since dust grains are expected to grow as disks age. Recent discoveries of PAHs in Herbig Ae/Be disks in amounts exceeding those in the ISM (Habart et al. 2005) are at odds with this expectation but may be in line with the recent work of Dullemond & Dominik (2005) who found that dust fragmentation, in addition to coagulation, has to be an important ingredient of the dust evolution. It may also be the case that the material properties of small and large grains (e.g. sticking coefficient) are completely different leading to divergent evolutionary paths of the two extremes of the grain size distribution. Detection of the spinning dust emission from circumstellar disks may shed enough light on the properties of the small dust population to resolve this puzzle.
Calculations presented in §2 were intended to provide us with the rough idea for the importance of the spinning dust emission and as such they neglected a number of details. Among them are the realistic distribution of shapes of the nanoscale dust particles, emission of spinning dust in the exposed layer associated with the nonthermal grain rotation rates, possible ionization of small dust particles, and so on. In the future observational demands may warrant a more refined study including these details.
4. Summary.
We have studied the electric dipole emission produced by spinning dust grains of very small size (several to tens nm) in circumstellar disks. At the temperatures characteristic for these environments spinning grains emit in the microwave range with the peak of the emission occurring at GHz. For typical parameters of disks around Herbig Ae/Be stars, T Tauri stars, and brown dwarves we find spinning dust emission to dominate over the thermal disk emission by a factor of at least several at GHz (if nanoparticles contain of the total C abundance). We have studied the sensitivity of this emission component to various stellar, disk, and dust parameters and found it to be strongest for variations of the total dust opacity — both normalization of and the slope of its frequency dependence. Provided that the contamination of the spinning dust emission by the free-free and/or synchrotron emission can be mitigated, the best chances of detecting this emission component should be in systems with steep sub-mm spectral indices minimizing the contribution of the thermal disk emission. Detection (or non-detection) of the spinning dust emission will provide important information about the existence, properties, and origin of the nanoscale dust particles in circumstellar disks.
Appendix A Radial temperature profile in the disk midplane.
Thermal balance of the shielded region is set by , where and are the characteristic temperatures of the shielded and exposed regions respectively and and are the fractions of the radiative flux with blackbody temperatures and absorbed by the disk. In the optically thick case while in the optically thin regime . Flaring angle is determined by the height of the disk surface , where is the gas sound speed and is the angular frequency of the disk. Factor is roughly constant throughout the disk and we set in this study. Power law scaling of implied by equation (2) results in the following expression for the low temperature Planck opacity:
| (A1) |
where is the same as the power law index in equation (2). Opacity dependence given by (A1) applies to the emission of both the disk interior and the exposed layer, but not to the stellar radiation, so that is significantly different from . In our case is calculated for a population of small m dust grains (Draine & Lee 1984; Dullemond & Natta 2003). Using (A1) one finds that
| (A2) |
This information allows one to derive the temperature profile in the shielded layer in different parts of the disk. Inner disk is optically thick to radiation at both and , which results in
| (A3) |
In the intermediate region disk is optically thin to the radiation of its interior [] while still optically thick to the reprocessed emission of the exposed layer (). As a result,
| (A4) |
where is a value of obtained by extrapolation of (1) to . Finally, in the outer disk, which is optically thin to the radiation at both and , one finds
| (A5) |
Transition between the inner and intermediate regions occurs at
| (A6) |
and between the intermediate and outer regions at
| (A7) |
In a particular case of , our results agree with Chiang & Goldreich (1997). The profile of used in §2 is found by extrapolation between expressions (A3)-(A5).
References
- (1)
- (2) Acke, B. & van den Ancker, M. E. 2004, A&A, 426, 151
- (3) Acke, B., van den Ancker, M. E., Dullemond, C. P., van Boekel, R., & Waters, L.B.F.M. 2004, A&A, 422, 621
- (4) Apai, D. et al. 2005, Science, 310, 834
- (5) Beckwith, S. V. W., Sargent, A. I., Chini, R. S., & Guesten, R. 1990, AJ, 99, 924
- (6) Bennett, C. L., et al. 2004, ApJS, 148, 97
- (7) Boulanger, F. & Pérault, M. 1988, ApJ, 330, 964
- (8) Chiang, E. I. & Goldreich, P. 1997, ApJ, 490, 368 (CG97)
- (9) Draine, B. T. 2005, submitted to ApJ, astro-ph/0507292
- (10) Draine, B. T. & Anderson, N. 1985, ApJ, 292, 494
- (11) Draine, B. T. & Lazarian, A. 1998a, ApJL, 494, L19
- (12) Draine, B. T. & Lazarian, A. 1998b, ApJ, 508, 157 (DL98)
- (13) Draine, B. T. & Lee, H. M. 1984, ApJ, 285, 89
- (14) Dullemond, C. P. & Dominik, C. 2005, A&A, 434, 971
- (15) Dullemond, C. P. & Natta, A. 2003, A&A, 405, 597
- (16) Eisner, J. A. & Carpenter, J. M. 2006, astro-ph/0601033
- (17) Ferrara, A. & Dettmar, R.-J. 1994, ApJ, 427, 155
- (18) Finkbeiner, D. P. 2004, ApJ, 614, 186
- (19) Finkbeiner, D. P., Davis, M., & Schlegel, D. J. 1999, ApJ, 524, 867
- (20) Finkbeiner, D. P., Langston, G. I., & Minter, A. H. 2004, ApJ, 617, 350
- (21) Fleming, T. & Stone, J. M. 2003, ApJ, 585, 908
- (22) Gammie, C. F. 1996, ApJ, 457, 355
- (23) Gürtler, J., Schreyer, K., Henning, Th., Lemke, D., & Pfau, W. 1999, A&A, 346, 205
- (24) Habart, E., Natta, A. & Krügel, E. 2004, A&A, 427, 179
- (25) Habart, E., Natta, A. Testi, L, & Carbillet, M. 2005, astro-ph/0503105
- (26) Kamp, I. & Dullemond, C. P. 2004, ApJ, 615, 991
- (27) Kramer, C. et al. 1998, A&A, 329, L33
- (28) Kitamura, Y., Momose, M., Yokogawa, S., Kawabe, R., Tamura, M., & Ida, S. 2002, ApJ, 581, 357
- (29) Leger, A. & Puget, J. L. 1984, A&A, 137, L5
- (30) Li, A. & Draine, B. T. 2002, ApJ, 572, 232
- (31) Li, A. & Lunine, J. I. 2003, ApJ, 594, 987
- (32) Matsumura, S. & Pudritz, R. E. 2005, ApJL, 618, L137
- (33) Matsumura, S. & Pudritz, R. E. 2006, MNRAS, 365, 572
- (34) Mathis, J. S., Rumpl, W., & Nordsieck, K. H. 1977, ApJ, 217, 427
- (35) Meeus, G. et al. 2001, A&A, 365, 476
- (36) Natta, A., Testi, L., Neri, R., Shepherd, D. S. & Wilner, D. J. 2004, A&A, 416, 179
- (37) Schütz, O., Meeus, G., & Sterzik, M. F. 2005, A&A, 431, 165
- (38) Sloan, G. C. et al. 2005, ApJ, 632, 956
- (39) Smith, T. L., Clayton, G. C., & Valencic, L. 2004, AJ, 128, 357
- (40) Testi, L., Natta, A., Shepherd, D. S., & Wilner, D. J. 2003, A&A, 403, 323
- (41) van Boekel, R. et al. 2005, astro-ph/0503507
- (42) van Kerckhoven, C., Tielens, A. G. G. M., & Waelkens, C. 2002, A&A, 384, 568
- (43) Zapata, L. A., Rodríguez, L. F., Ho, P. T. P., Beuther, H., Zhang, Q. 2005, astro-ph/0510761
| Model | [K] | [AU] | [AU] | [g cm-2] | Object | ||
|---|---|---|---|---|---|---|---|
| 1 | 10000 | 1 | 300 | 1000 | Herbig Ae/Be | ||
| 2 | 4000 | 0.1 | 300 | 1000 | T Tauri | ||
| 3 | 2600 | 0.033 | 30 | 100 | Brown Dwarf |