No Higher Criticism of the Bianchi Corrected WMAP Data
Abstract
Motivated by the success of the Bianchi model in addressing many of the anomalies observed in the WMAP data (Jaffe et al.), we present calculations in real and in wavelet space of the Higher Criticism statistic of the Bianchi corrected Wilkinson Microwave Anisotropy Probe (WMAP) first year data. At the wavelet scale of 5 degrees the Higher Criticism of the WMAP map drops from a value above the c.l. to a value below the c.l. when corrected by the Bianchi template. An important property of the Higher Criticism statistic is its ability to locate the pixels that account for the deviation from Gaussianity. The analysis of the uncorrected WMAP data pointed to a cold spot in the southern hemisphere centered at , . The Higher Criticism of the Bianchi corrected map indicates that this spot remains prominent, albeit at a level completely consistent with Gaussian statistics. Consequently, it is debatable how much emphasis should be placed on this residual feature, but we consider the effect of modestly increasing the scaling of the template. A factor of only 1.2 renders the spot indistinguishable from the background level, with no noticeable impact on the results published in Jaffe et al. for the low-l anomalies, large-scale power asymmetry or wavelet kurtosis. A trivial interpretation would be that the Bianchi template may require a small enhancement of power on scales corresponding to the wavelet scale of 5 degrees.
1 Introduction
The first year of observations of the Wilkinson Microwave Anisotropy Probe (WMAP) satellite has provided us with a data set of unprecedented accuracy (Bennett et al. 2003). It is exciting to see that we are still far from understanding all the information that is encoded in the data. Among the many papers that have been published based on analyses of the WMAP data, a large section of them points to possible deviations from the standard model. Different so called anomalies have been detected and possible explanations have been offered by several authors: (1) Low value of the quadrupole, its alignment with the octopole and other multipole alignments (De Oliveira-Costa et al. 2004, Schwarz et al. 2004, Vale 2005, Land & Magueijo 2005a), (2) Asymmetries (Park 2004, Eriksen et al. 2004a, Eriksen et al. 2004b, Larson & Wandelt 2004, Hansen et al. 2004a, Hansen et al. 2004b, Donoghue & Donoghue 2005, Tojeiro et al. 2005, Bielewicz et al. 2005, Tomita 2005, Freeman et al. 2005), (3) Deviations from Gaussianity, in particular, detections in wavelet space pointing to a cold spot as the source of non-Gaussianity (Vielva et al. 2004, Cruz et al. 2005, Cayón et al. 2005).
Several works have explored the possibility of accounting for some or all of the anomalies observed in the WMAP data by introducing some shear and vorticity in the universe (Jaffe et al. 2005a,b, Land & Magueijo 2005b, McEwen et al. 2005b). Models introducing these anisotropic characteristics fall under the class of Bianchi models (Barrow et al. 1985). In this paper we confirm the validity of the Bianchi model obtained as a best fit to the WMAP data by Jaffe et al. 2005b, as a possible explanation of all the observed anomalies. Following the same procedure as in Cayón et al. 2005 we show that the Higher Criticism statistic (Donoho Jin 2004) of the Bianchi corrected WMAP map is compatible with Gaussianity (at the c.l.) at all the wavelet scales.
This paper is organized as follows. We present the formalism in Section 1. Section 2 is dedicated to introduce the analyzed data and simulations. Results are presented in Section 3 and they are discussed in Section 4 (conclusions also included in this section).
2 Formalism
As indicated above we here follow the formalism presented in Cayón et al. 2005. The statistical study is based on the statistic proposed in Donoho & Jin 2004, Jin 2004. For a set of individual observations from a certain distribution, is defined as follows. The observed values are first converted into -values: . After sorting the -values in ascending order , we define the at each pixel by:
Unusually large values of imply deviations from Gaussianity. The fact that the statistic is calculated at every pixel will allow for the location of the source of any detected deviation. In order to quantify the statistical level of any detection the maximum of the for a given map (generally denoted ) will be compared to the distribution of values obtained from Gaussian simulations (see discussion in the next section). has been shown to capture the unusual behavior of the few most extreme observations as well as any unusually large number of moderately high value observations. One should note that this is a completely different test to one based on the kurtosis statistic. The kurtosis enhances any deviation from Gaussianity hidden in the fourth order moment and it depends on the bulk of the data.
The of the Bianchi corrected WMAP data is estimated in real and in wavelet space. Several groups have presented analyses of the WMAP data in wavelet space (Vielva et al. 2004, Cruz et al. 2005, Mukherjee & Wang 2004, McEwen et al. 2005a,Liu & Zhang 2005, Cayón et al. 2005). In particular, the Spherical Mexican Hat (SMH) wavelet has been shown to be sensitive to the presence of non-Gaussianity in the WMAP data. Analyses based on kurtosis and on show detections above the c.l. at a scale of five degrees. A cold spot in the southern hemisphere seems to be accounting for these detections. Our aim in this paper is to study what is the effect on the results caused by the subtraction of a Bianchi based template from the WMAP data. is therefore calculated not only for the Bianchi corrected WMAP map but also for the convolution of this map with the SMH wavelet at fifteen scales ranging from to arcmins.
3 Bianchi corrected WMAP Data and Simulations
The first year of WMAP observations is available at the Legacy Archive for Microwave Background Data Analysis (LAMBDA) website222http://lambda.gsfc.nasa.gov/. For the purpose of cosmological studies the Foreground Cleaned Intensity Maps at bands Q,V and W are used. A combined map (the so called WMAP data/map in this work) is built following Komatsu et al. 2003. The weighted combination is given by,
The temperature at pixel , results from the ratio of the weighted sum of temperatures at pixel at each radiometer divided by the sum of the weights of each radiometer at pixel . The radiometers Q1, Q2, V1, V2, W1, W2, W3 and W4 are sequentially numbered from 3 to 10. The weights at each pixel, for each radiometer , are the ratio of the number of observations divided by the square of the receiver noise dispersion . The resulting map is downgraded from resolution to resolution (the total number of pixels being ).
The Bianchi template that is used in this work is the best fit found by Jaffe et al. 2005b. They considered Bianchi type models characterized by the values of and , where is the scale on which the basis vectors change orientation. The best fit was obtained for and . We present here an analysis of the Bianchi corrected WMAP data set obtained after subtraction of this template (and multiples of it) from the original WMAP data. The final analysis is performed on a masked version of this map that includes the so called mask (released by the WMAP team and available at the LAMBDA website). An extension of this mask is applied to the wavelet convolved maps as discussed in Vielva et al. 2004.
The confidence levels of the statistic corresponding to the Gaussian assumption are drawn from 5000 simulations were the power spectrum is the one that best fits the WMAP, CBI and ACBAR CMB data, plus the 2dF and Lyman-alpha data. The simulations take also into account the beam transfer functions, the number of observations and the noise dispersion for each receiver. All these are provided by the WMAP team through the LAMBDA website.
4 Results
The values of the statistic for the WMAP and the Bianchi corrected WMAP data are presented in Figure 1. Solid, dotted-dashed and dashed lines show the and confidence levels respectively. These are obtained from the 5000 Gaussian simulations described above. Since the statistic of a map is a maximum value (), the confidence regions are one-sided. As one can see, there is no detection of deviations from Gaussianity in the Bianchi corrected WMAP data (factor of in the figure). This corroborates the results obtained by Jaffe et al. 2005b. Subtraction of the Bianchi template corrects most of the anomalies that have been observed in the first year WMAP data.
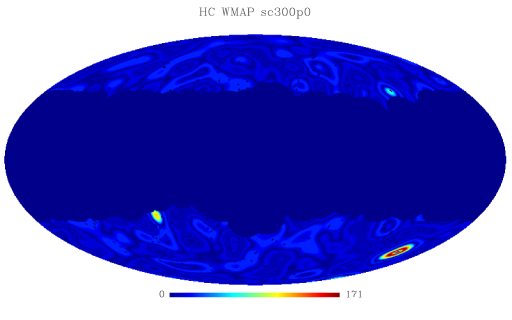
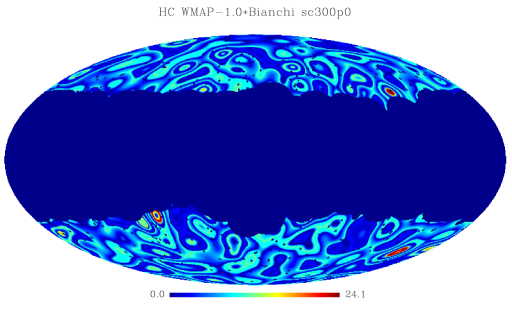
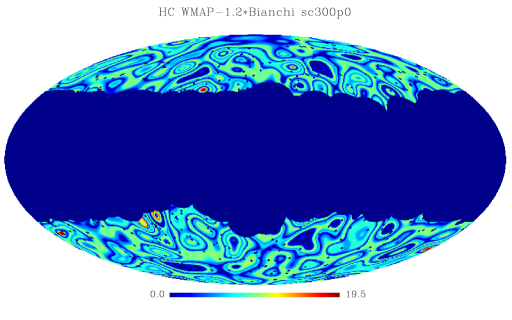
The maps of values for the WMAP and the Bianchi corrected WMAP data at a wavelet scale of 5 degrees are presented in Figures 2 and 3. As one can immediately see the detected non-Gaussianity in the WMAP data is dominated by the values of a ring of pixels at the spot centered at , (note that the ring structure is likely to be caused by the convolution with the wavelet). Subtraction of the Bianchi template drops the values of the statistic at that spot below the c.l. (see Figure 1). However, the spot still appears as one of the most prominent regions. Even if the relevance of this feature is debatable we decided to see whether different normalizations of the subtracted template can influence its amplitude. A factor of reduces the amplitude of the spot making it comparable with the surrounding values as can be seen in Figure 4. We have also studied whether this normalization factor affects the other anomalies observed in the WMAP first year data. The effect on the alignment between the quadrupole and the octopole and the planarity as defined in Oliveira-Costa et al. 2004 is presented in Table 1. These large scale anomalies are not very much affected by a change in the normalization factor of the Bianchi template. The ratio of power between two hemispheres for a certain range of was calculated as in Eriksen et al. 2004a. The probability of having a maximum power asymmetry ratio larger than that of a given map (either the WMAP or the Bianchi corrected WMAP maps) is shown in Table 2. This probability is slightly affected by the normalization factor. There is no much of a difference between the results for a factor of 1 and a factor of . However, above this, an increase in the normalization factor starts worsening the results. This agrees with the trend observed for the statistic as can be seen in Figure 1.
| 0.0 | 61.9 | 247.8 | 63.4 | 232.8 | 7.0 | 0.992 | 0.89 | 0.001 | 0.98 |
| 0.5 | 8.3 | 57.1 | 73.7 | 253.3 | 82.7 | 0.127 | 0.73 | 0.003 | 0.99 |
| 1.0 | 3.3 | 44.5 | 56.8 | 323.5 | 82.3 | 0.134 | 0.55 | 0.05 | 0.98 |
| 1.2 | 0.3 | 40.6 | 45.6 | 327.2 | 78.3 | 0.203 | 0.62 | 0.10 | 0.97 |
| 2.0 | 9.0 | 212.2 | 26.9 | 317.3 | 80.9 | 0.159 | 0.86 | 0.37 | 0.92 |
| 0.0 | 1.0 | 0.7 |
| 0.5 | 9.8 | 6.0 |
| 1.0 | 17.0 | 22.0 |
| 1.2 | 15.9 | 28.9 |
| 2.0 | 4.3 | 13.6 |
5 Discussion and Conclusions
Several explanations have been discussed in the literature to account for the different anomalies observed in the first year of WMAP data ( Schwartz et al. 2004, Vale 2005, Freeman et al. 2005, Land & Magueijo 2005b, Jaffe et al. 2005a,b, Tomita 2005). These anomalies include: (1) The low value of the quadrupole, its alignment with the octopole and other multipole alignments, (2) The asymmetries observed in the distribution of large scale power, (3) The non-Gaussianity detected in wavelet space which source seems to be centered at a cold spot in the southern hemisphere. However, much of this work has concentrated on explaining the anomalous low-l structure. Jaffe et al, however, serendipitously discovered that at least part of the large angular scale structure of the WMAP data was described by a particular Bianchi VIIh model, and that correcting the data for this contribution provided a potential resolution for each of the above anomalies. We here confirm their results by estimating the effect of subtracting the proposed Bianchi template from the WMAP data, on the HC statistic. A detection of non-Gaussianity localized in a cold spot at , was found by the estimation of the statistic of the WMAP data (Cayón et al. 2005). Subtraction of the Bianchi template renders the WMAP data statistically compatible with the expected levels based on Gaussian simulations.
The map of values for the Bianchi corrected WMAP data (see Figure 3) still shows the cold spot in the southern hemisphere as one of the most prominent regions. Although no special consideration should now be given to the spot on a statistical basis, it remains interesting given that the original detection of non-Gaussianity was intimately associated with the region. We have determined that a modest increase in the amplitude of the Bianchi template (by a factor 1.2) renders the spot indistinguishable from the background level. Importantly, such a change in amplitude does not perturb the effect of the template in resolving issues related to the low-l multipole features and power asymmetry. There is no compelling statistical reason, therefore, to believe that the Bianchi template amplitude derived in Jaffe et al should be considered underestimated. The HC results presented here, however, may be interpreted as implying that the Bianchi template may require a small enhancement of power on scales corresponding to the wavelet scale of 5 degrees. One could create a Bianchi template with more power on small scales by reducing the matter density, but this would also affect the large-scale structure and therefore the significance of the fit to the data. The most pragmatic interpretation of Jaffe et al - that the best-fit Bianchi model provides a template temperature pattern which alternative models would need to reproduce in order to resolve the observed anomalous anisotropy structure - remains valid.
Acknowledgements
We thank P. Vielva for providing the extended masks used at different wavelet scales. We acknowledge the use of the Legacy Archive for Microwave Background Data Analysis (LAMBDA). Support for LAMBDA is provided by the NASA Office of Space Science. Some of the results in this paper have been derived using the HEALPix (Górski, Hivon, and Wandelt 1999) package.
References
- [1] Barrow, J.D., Juszkiewicz, R. & Sonoda, D.H. 1985, MNRAS, 213, 917
- [2] Bennett, C.L. et al. 2003, ApJS, 148, 1
- [3] Bielewicz, P., Eriksen, H.K., Banday, A.J., Gorski, K.M. & Lilje, P.B. 2005, astro-ph/0507186
- [4] Cayón, L., Jin, J. & Treaster, A. 2005, MNRAS, 362, 826
- [5] Cruz, M., Martínez-González, E., Vielva, P. & Cayón, L. 2004, astro-ph/0405341
- [6] De Oliveira-Costa, A., Tegmark, M., Zaldarriaga, M. & Hamilton, A. 2004, PhRvD, 69, 063516
- [7] Donoghue, E.P. & Donoghue, J.F. 2005, PhRvD, 71, 043002
- [8] Donoho, D. & Jin, J. 2004, Ann. Statist., 32, 962
- [9] Eriksen, H.K., Hansen, F.K., Banday, A.J., Górski, K.M. & Lilje, P.B. 2004a, ApJ, 605, 14
- [10] Eriksen, H.K., Novikov, D.I., Lilje, P.B., Banday, A.J. & Górski, K.M. 2004b, ApJ, 612, 64
- [11] Eriksen, H.K., Banday, A.J., Gorski, K.M. & Lilje, P.B. 2004c, ApJ, 612, 633
- [12] Freeman, P.E., Genovese, C.R., Miller, C.J., Nichol, R.C. & Waserman, L. 2005, astro-ph/0510406
- [13] Górski, K.M., Hivon, E. & Wandelt, B.D. 1999, in Proceedings of the MPA/ESO Cosmology Conference ”Evolution of Large-Scale Structure”, eds. A.J. Banday, R.S. Sheth and L. Da Costa, PrintPartners Ipskamp, NL, pp. 37-42 (also astro-ph/9812350)
- [14] Hansen, F.K., Banday, A.J. & Gorski, K.M. 2004a, MNRAS, 354, 641
- [15] Hansen, F.K., Balbi, A., Banday, A.J. & Gorski, K.M. 2004b, MNRAS, 354, 905
- [16] Jaffe, T.R., Banday, A.J., Eriksen, H.K., Gorski, K.M. & Hansen, F.K. 2005a, ApJ, 629, L1
- [17] Jaffe, T.R., Banday, A.J., Eriksen, H.K., Gorski, K.M. & Hansen, F.K. 2005b, ApJ, submitted
- [18] Jin, J. 2004, Institue of Mathematical Statistics Monograph, No. 45, 255
- [19] Jin, J., Starck, J.-L., Donoho, D.L., Aghanim, N. & Forni, O. 2004, submitted to EURASIP Journal on Applied Signal Processing, special issue on “Applications of Signal Processing in Astrophysics and Cosmology”
- [20] Komatsu, E. et al. 2003, ApJS, 148, 119
- [21] Land, K. & Magueijo, J. 2005a, PhRvL, 95, 071301
- [22] Land, K. & Magueijo, J. 2005b, astro-ph/0509752
- [23] Larson, D.L. & Wandelt, B.D. 2004, ApJ, 613, L85
- [24] Liu, X. & Zhang, S.-N. 2005, ApJ, 633, 542
- [25] McEwen, J.D., Hobson, M.P., Lasenby, A.N. & Mortlock, D.J. 2005b, astro-ph/0510349
- [26] McEwen, J.D., Hobson, M.P., Lasenby, A.N. & Mortlock, D.J. 2005a, MNRAS, 359, 1583
- [27] Mukherjee, P. & Wang, Y. 2004, astro-ph/0402602
- [28] Park, C.-G. 2004, MNRAS, 349, 313
- [29] Schwarz, D.J., Starkman, G.D., Huterer, D. & Copi, C.J. 2004, PhRvDL, 93, 221301
- [30] Tojeiro, R., Castro, P.G., Heavens, A.F. & Gupta, S. 2005, astro-ph/0507096
- [31] Tomita, K. 2005, PhRvD, 72, 103506
- [32] Vale, C. 2005, astro-ph/0509039
- [33] Vielva, P., Martínez-González, E., Barreiro, R.B., Sanz, J.L. & Cayón, L. 2004, ApJ, 609, 22