Diffuse Far-ultraviolet Observations of the Taurus Region
Abstract
Diffuse far-ultraviolet (FUV: 1370–1670 Å) flux from the Taurus molecular cloud region has been observed with the SPEAR/FIMS imaging spectrograph. An FUV continuum map of the Taurus region, similar to the visual extinction maps, shows a distinct cloud core and halo region. The dense cloud core, where the visual extinction is 1.5, obscures the background diffuse FUV radiation, while a scattered FUV radiation is seen in and beyond the halo region where 1.5. The total intensity of H2 fluorescence in the cloud halo is photons cm-2 s-1 sr-1 in the 1370–1670 Å wavelength band. A synthetic model of the H2 fluorescent emission fits the present observation best with a hydrogen density = 50 cm-3, H2 column density (H2) = 0.8 cm-2, and an incident FUV intensity = 0.2. H2 fluorescence is not seen in the core presumably because the required radiation flux to induce fluorescence is unable to penetrate the core region.
1 INTRODUCTION
There are two major components in the Galactic diffuse far-ultraviolet (FUV) emission: scattered starlight from interstellar dust and H2 fluorescent emissions (Bowyer 1991). Both the diffuse FUV and infrared (IR) backgrounds are important tracers of interstellar dust. Much of the current information on the large-scale distribution of dust has been obtained from IR missions such as IRAS and COBE (see Sodroski et al. 1997). Luhman et al. (1994) observed vibrationally excited H2 emissions in the near-IR, and Luhman & Jaffe (1996, hereafter LJ96) argued that there was a significant correlation between the H2 line intensity and the far-IR (FIR) continuum, the origin of which they attributed to the ultraviolet illumination of molecular hydrogens and dust on cloud surfaces. Scattering in the FUV wavelengths may also give complementary information to that of the IR emission, and the combination of these two wavebands can lead to a unique determination of interstellar dust parameters (Murthy & Sahnow 2004, hereafter MS04). Haikala et al. (1995) observed a Galactic cirrus cloud near the north Galactic pole with the FUV imaging telescope FAUST, and showed a good correlation between the FUV and IRAS 100 m surface brightness. Based on the FUSE observations, MS04 argued that even at low Galactic latitudes, the diffuse FUV ( 1200 Å) sky should be patchy with regions of intense continuum, mostly near bright stars, and dark regions. They found a weak correlation between the FUV flux and the 100 m emissions, but with large variations. Hurwitz, Bowyer & Martin (1991) pointed out that for a fully clumped dust model, the scattered FUV continuum should fall as the FUV optical depth exceeds 1, while the 100 m radiation continues to increase with a neutral hydrogen column density.
FUV photons play an important role in the physical and chemical processes in the interstellar medium (ISM). They ionize atoms, dissociate molecules, and heat gases both by ejecting electrons from dust grains and by directly exciting atoms and molecules (see, e.g., Tielens & Hollenbach 1985; Black & van Dishoeck 1987, hereafter BvD87; van Dishoeck & Black 1988; Sternberg 1989). Hydrogen molecules are electronically excited by absorbing FUV photons in the Lyman and Werner bands while their spontaneous decay back to the electronic ground states results in the emission of FUV lines, cascading down to the lower vibration-rotation levels by emitting near-IR lines (BvD87; Luhman et al. 1997). Since the FUV radiation field in a cloud decreases rapidly with an increasing optical depth, both the abundance and the excitation of H2 are significantly optical-depth-dependent (BvD87), which enables us to model the physical conditions of a cloud from the observation of the H2 UV fluorescence (Witt et al. 1989). Molecular hydrogen fluorescent emissions in the IR bands have been observed from various star-forming regions, such as the Galactic center (Pak, Jaffe & Keller 1996) and the Orion nebula (Luhman et al. 1994). In the FUV bands, H2 fluorescence was first discovered near IC 63, which resides in the intense FUV radiation field of a nearby B-star (Witt et al. 1989). H2 fluorescence in the diffuse interstellar medium excited by a general interstellar radiation field was first detected by Martin, Hurwitz & Bowyer (1990).
The Taurus region is a local complex of molecular clouds where active star formation is in progress. With a relatively short distance of 140 pc from Earth (Kenyon et al. 1994) and being sufficiently far from the Galactic plane, it suffers negligible foreground and background extinction (Padoan, Cambresy & Langer 2002, hereafter PCL02). Hence, the Taurus cloud region is a useful laboratory for understanding the relationship between interstellar gas, dust, and FUV radiation. The FUV continuum and H2 fluorescence spectra ( Å) have been obtained from a 0.13∘ 3.8∘ field in the Taurus region and analyzed in detail (Hurwitz 1994).
In this paper, we report the results of new observations in the Taurus region taken with the FUV imaging spectrograph, SPEAR/FIMS, onboard the Korean micro-satellite STSAT-1, launched on September 27, 2003. Particularly, we present the first FUV continuum image (10∘ 24∘) of the Taurus region mapping the scattered starlight from the dust. The FUV continuum image is compared with the visual extinction map, as well as with the FIR emission map. The observations also reveal that H2 fluorescent emission is present in the halo regions, but not in the core region. The physical parameters of the H2-fluorescent region are obtained using the synthetic H2 model developed by BvD87.
2 FAR-ULTRAVIOLET OBSERVATIONS AND ANALYSIS
The SPEAR/FIMS mission employs an imaging spectrograph with two channels (Short and Long) which is optimized for the observation of diffuse emission lines at FUV wavelengths. We utilized the Long channel data only in this study, while the analysis of the Short channel ( 900–1150 Å) data is proceeding. The Long channel covers 1350–1700 Å, with a resolving power of 550. The field of view of the Long channel is , with a 5–10′ imaging resolution along the slit, and the spectral half-energy line width, averaged over the angular field, is 3.2 Å. The instrument, its in-orbit performance, and the data analysis procedures are described in Edelstein et al. (2005a, b).
Our data set is composed of 21 scanning observations made during the sky survey and 3 orbits of a dedicated pointing observation toward the Taurus cloud. The total exposure time of the 21 scanning orbits is around 300 seconds per pixel, on average, while that of the pointing observations is 1629 seconds. The internal detector background, measured during the observation for 5 s at 25 s intervals by closing the shutter, is 0.01 counts s-1 Å-1 and subtracted from the data. Only the data from 1370 to 1670 Å, excluding the intense O I airglow line at 1356 Å, are used for the present analysis.
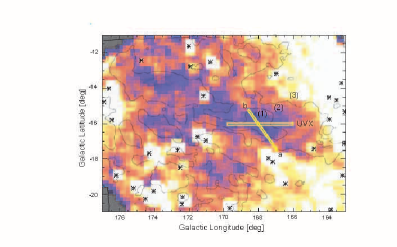
Figure 1 shows the observed FUV (1370–1670 Å) continuum map with 0.2∘ 0.2∘ pixels, smoothed with 3 pixels to reduce statistical fluctuations. The two narrow rectangles represent the fields of the present pointed observation and the UVX target of Hurwitz (1994) centered at () = (168, -16). Bright TD-1 catalog stars ( ergs cm-2 s-1 sr-1 Å-1) from Gondhalekar, Philips & Wilson (1980) are also marked. It is apparent that the map is divided into distinctive FUV intensity regions, represented by colors: the blue region with 0–1250 photons cm-2 s-1 sr-1 (hereafter CU) corresponds to the core, the red (1250–2500 CU) to the halo region, and the white ( 2500 CU) to the stars and the diffuse background region beyond the Taurus cloud. We have also overplotted the contours of the visual extinction obtained from the map in PCL02: (1) , (2) , and (3) . We can easily note that the FUV intensity is well related with the contours of . The FUV intensity of each pixel may have an uncertainty of 25 % due to the systematic error in estimating the effective area (see Edelstein et al. [2005a] for instrumental issues). Nevertheless, we believe this continuum map certainly shows that the Taurus cloud is obscuring a more distant diffuse FUV background source, consistent with the picture of Hurwitz (1994), whose results were based on the limited UVX observation. We will discuss this further in the next section.
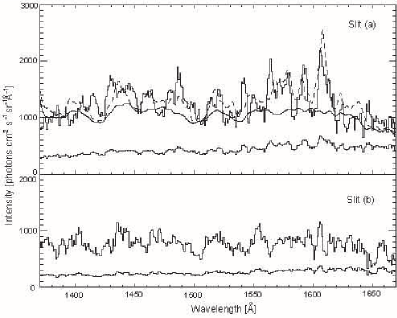
The pointed observation includes the Taurus halo region (field a) as well as the core region (field b). Fields a and b are 4.31∘ and 4.3 1.7∘, and centered at () = (167.3, -17.3) and (168.1, -16.2), respectively. Figure 2 shows the spectra obtained from these two regions. Each spectrum is made with 1 Å bins and a boxcar smoothed by 3 bins. The Poisson statistical uncertainty levels are also indicated. It is clear from this figure that the H2 fluorescence is significant in the halo region (field a), while it is not significant in the core region (field b). It should also be noted that the systematic uncertainty in the effective area may affect the overall intensity but not the spectral shape.
We modeled the H2 fluorescence spectrum of the halo region using CLOUD, a plane parallel H2 model program for the photo-dissociation regions (PDRs). The basic concepts, physical backgrounds, and the application of the model are described in BvD87. While many input parameters were required for detailed modeling, we focus on only three main parameters: the enhancement factor of the incident FUV intensity () compared with the mean interstellar value adopted by Draine (1978), the cloud density , and the total H2 column density (H2). We have generated 3200 synthetic models with = (10, 50, 100, 500) cm-3, (H2) = (0.1 20) 1020 cm-2, and = (0.01 2) to find the best fit to the observed FUV fluorescence. We use the spectrum of the core region (smoothed by 21 bins and scaled) as a model continuum assuming that the spectral shapes of the background continuum in the core region and in the halo region are similar. Though this might be a source of uncertainty, it should be noted that no significant spectral features are apparent in the spectrum of the core region (field b). The scale factor of the model continuum and the cloud parameters were chosen to minimize the value. The final result of the model continuum (solid line) and the fit (dashed line) is overplotted in Figure 2a. The parameters we obtained for the halo region are = 50 cm-3, (H2) = 0.8 1020 cm-2, and = 0.2, with = 0.899. The corresponding molecular hydrogen fluorescent intensity in the 1370–1670 Å wavelength band is 6.5 photons cm-2 s-1 sr-1 or 8.4 ergs cm-2 s-1 sr-1. The current results are generally consistent with those obtained by Neufeld & Spaans (1996, hereafter NS96) for the UVX 1400–1700 Å data: = 50 cm-3 and = 0.4 for the observed fluorescence intensity of 7 ergs cm-2s-1 sr-1. Although is different by a factor of 2, the increase of the enhancement factor from 0.2 to 0.4 changes by 10 % in our model because the absolute FUV flux increment is small and the increased is offset by the decrease of the fit background. When we apply a flat background for the model continuum instead of the core spectrum, the best fit results in similar parameters within 10 % variations, except , which increases 2.5 times, with the value 0.713.
3 DISCUSSION
Observations in different wavebands of the Taurus region show similar pictures that the clouds appear as diffuse filaments with dense clumps of molecular gas embedded (Whittet et al. 2004, and references therein). The FUV map shown in Figure 1, together with the 2MASS visual extinction map in PCL02, and the FIR maps of and (see Abergel et al. 1994), provide an excellent opportunity for a comparative study of the dust scattering observed in different wavelength bands. The FUV color map clearly shows an anti-correlated structure when compared with the visual extinction map and the cold component map () of Abergel et al. (1994): the FUV intensity decreases toward the Taurus core region while the visual extinction and the FIR intensity increase. This anti-correlation is contradictory to the general correlation between FUV and IR in optically thin () regions (Hurwitz 1994; LJ96).
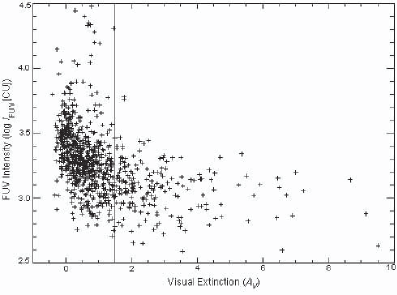
To further explore the relationship between the FUV continuum intensity and the visual extinction , we rescaled the visual extinction map to 0.2∘ 0.2∘ pixels to match our FUV map and compared the maps pixel by pixel in Figure 3. The visual extinction used has an uncertainty of 0.49 magnitude, according to PCL02, which causes for some data points, as seen in the figure. As expected, is low for high extinctions ( 1.5) since the clouds block the background radiation. Also, is more or less flat in this high extinction region, which indicates comes mainly from the foreground radiation and its scattered light. For low extinctions, 1.5, on the other hand, the present result shows scattered . This is inconsistent with the general notion that increases with due to dust scattering in optically thin conditions. We believe the ambiguity in the present case arises as the scattered photons of the foreground FUV lights are mixed with those of the background; though the uncertainty of might also have some effects. Nevertheless, it should be noted that some of the data points used by Murthy & Sahnow (2004) to study the relationship between and deviate significantly from the simple linear relationship, which may be more appropriate for optically thin regions. This is not unexpected as the study was based on the measurements that include targets in the region where exceeds 10 MJy, and therefore, 1 (Hurwitz, Bowyer & Martin 1991). Figure 3 shows that the relation between and should be compound when moving from an optically thin region to an optically thick region. The current observation of FUV intensity over a broad range of opacities within a single field, where the local interstellar radiation field should be fairly constant, provides a valuable data set that we intend to explore further in future studies by using more detailed 3-dimensional optical-transfer modeling to study the scattering properties of dust grain, as well as the nature of the foreground and background illumination.
The present observation shows a more intense FUV continuum averaged over 1370–1670 Å in the halo region (1079 375 CU) than in the core region (769 267 CU), as Hurwitz (1994) described it: a dark core with a bright rim structure (based on limited UVX observations). The contours in Figure 1 indicate that the visual extinction of the core region is about 15 times larger than that of the halo region. Assuming a simple linear relationship between the visual extinction and the hydrogen column density, this implies that there is about 15 times more gas in the core region than in the halo region. If we further assume that the dust FUV scattering properties are constant over the Taurus region, we expect the incident FUV intensity in the core region to be 21 times lower than that of the halo region, with 0.01, which is insufficient to excite significant H2 fluorescence.
4 CONCLUSION
We observed the FUV (1370–1670 Å) emission from the Taurus region using the FUV imaging spectrograph, SPEAR/FIMS, onboard the Korean micro-satellite STSAT-1. Our map of the FUV continuum is consistent with the picture in which the cloud both obscures a more distant diffuse background source, as well as scatters the foreground radiation. We found H2 fluorescence only from the cloud’s halo, not from its core region, as the incident FUV intensity in the core region is not sufficient to excite significant H2 fluorescence. A simple plane parallel H2 model fits the halo spectrum best with = 6.5 photons cm-2 s-1 sr-1, the cloud density = 50 cm-3, H2 column density (H2) = 0.8 1020 cm-2, and the incident FUV intensity = 0.2. It is seen that a mixed relationship exists between and with a transition point at (), dividing optically thin regions from optically thick regions in the FUV band.
We thank Dr. Paolo Padoan and Dr. Laurent Cambresy who provided the raw data of the Taurus regions visual extinction map for this analysis. This publication makes use of data products from SPEAR/FIMS, which is a joint project of Korea Astronomy and Space Science Institute, Korea Advanced Institute of Science and Technology, and University of California at Berkeley, funded by the Ministry of Science and Technology (Korea) and the National Aeronautics and Space Administration (USA).
References
- (1) Abergel, A., Boulanger, F., Mizuno, A. & Fukui, Y. 1994, ApJL, 423, 59
- (2) Black, J. H. & van Dishoeck, E. F. 1987, ApJ, 322, 412
- (3) Bowyer, S. 1991, ARA&A, 29, 59
- (4) van Dishoeck, E. F. & Black, J. H. 1988, ApJ, 334, 771
- (5) Draine, B. T. 1978, ApJS, 36, 595
- (6) Edelstein et al. 2005a, submitted
- (7) Edelstein et al. 2005b, submitted
- (8) Gondhalekar, P. M., Phillips, A. P. & Wilson, R. 1980, A&A, 85, 272
- (9) Haikala et al. 1995, ApJ, 443, L33
- (10) Hurwitz, M., Bowyer, S. & Martin, C. 1991, ApJ, 372, 167
- (11) Hurwitz, M. 1994, ApJ, 433, 149
- (12) Kenyon, S. J., Dobrzycka, D. & Hartmann, L. 1994, AJ, 108, 1872
- (13) Luhman, M. L., Jaffe, D. T., Keller, L. D. & Pak, S. 1994, ApJ, 436, L185
- (14) Luhman, M. L. & Jaffe, D. T. 1996, ApJ, 463, 191
- (15) Luhman, M. L., Luhman, K. L., Benedict, T., Jaffe, D. T. & Fischer, J. 1997, ApJ, 480, L133
- (16) Martin, C., Hurwitz, M. & Bowyer, S. 1990, ApJ, 354, 220
- (17) Murthy, J. & Sahnow, D. 2004, ApJ, 615, 315
- (18) Neufeld, D. A. & Spaans, M. 1996, ApJ, 473, 894
- (19) Padoan, P., Cambresy, L. & Langer, W. 2002, ApJ, 580, 57
- (20) Pak, S., Jaffe, D. T. & Keller, L. D. 1996, ApJ, 457, L43
- (21) Sodroski, T. J., et al. 1997, ApJ, 480, 173
- (22) Sternberg, A. 1989, ApJ, 347, 863
- (23) Tielens, A. G. G. M. & Hollenbach, D. J. 1985, ApJ, 291, 722
- (24) Whittet, D. C. B., Shenoy, S. S., Clayton, G. C. & Gordon, K. D. 2004, ApJ, 602, 291
- (25) Witt, A. N., Stecher, T. P., Boroson, T. A. & Bohlin, R. C. 1989, ApJ, 336, L21