The age dependence of galaxy clustering
Abstract
We construct mock galaxy catalogues to analyse clustering properties of a cold dark matter (CDM) universe within a cosmological dark matter simulation of sufficient resolution to resolve structure down to the scale of dwarfs. We show that there is a strong age-clustering correlation for objects likely to host luminous galaxies, which includes the satellite halo (subhalo) population. Older mock galaxies are significantly more clustered in our catalog, which consists of satellite haloes as well as the central peaks of discrete haloes, selected solely by peak circular velocity. This age dependence is caused mainly by the age-clustering relation for discrete haloes, recently found by Gao et al. , acting mostly on field members, combined with the tendency for older mock galaxies to lie within groups and clusters, where galaxy clustering is enhanced. Our results suggest that the clustering age dependence is manifested in real galaxies. At small scales (less than 5 Mpc), the very simple assumption that galaxy colour depends solely on halo age is inconsistent with the strength of the observed clustering colour trends, where red galaxies become increasingly more clustered than blue galaxies toward smaller scales, suggesting that luminosity weighted galaxy ages do not closely trace the assembly epoch of their dark matter hosts. The age dependence is present but is much weaker for satellite haloes lying within groups and clusters than for the global population.
keywords:
galaxies: haloes – galaxies: formation – methods: N-body simulations – cosmology: theory – cosmology:dark matter1 introduction
A critical test of the CDM model is whether it accurately predicts the clustering properties of galaxies formed within dark matter haloes and “subhaloes” that are satellite clumps withing larger host haloes. Subhaloes serve as hosts for visible galaxies within clusters, groups, or larger galaxies, and so provide a natural basis for constructing simulated mock catalogs, whose clustering properties can then be compared with observed galaxies.
Clustering of haloes depends on halo age, a phenomenon recently measured in CDM simulations by Gao, Springel, & White (2005), who found that older haloes are more strongly clustered than younger haloes. The likely explanation is that haloes of a given mass generally form earlier within denser regions. Thus, older haloes tend to populate denser regions, which naturally leads to stronger clustering with halo age. Sheth & Tormen (2004) measured such a trend between mean halo formation epoch and local over-density in simulation data, which was recently confirmed in larger simulations by Harker et al. (2005). The precise physical origin, however, of the age dependence is a subject of recent debate (see discussion by e.g. Zentner 2006). Wang, Mo & Jing (2007), use numerical simulations to suggest that accretion onto low mass haloes in high density regions is inhibited by competition with massive neighbours via tidal interactions and local dynamical heating, creating a correlation with halo age and environment. Sandvik et al. (2006) suggest that the formation history and the current epoch environment of low mass haloes may be affected by their presence in massive pancakes and filaments at high redshift. The clustering age dependence, which has been confirmed by a number of authors (Harker et al. 2005; Wechsler et al. 2006; Gao & White 2006; Jing, Suto & Mo 2006; Wang, Mo & Jing 2007), is strong for haloes of masses of 1011-12 (Gao et al. 2005, Wechsler et al. 2006), which are likely to host galaxies, and decreases with halo mass, becoming insignificant for haloes more massive than 1013 (Gao et al. 2005). There is evidence that the age-clustering dependence may reverse sign for larger haloes (Wetzel et al. 2006; Jing, Suto & Mo 2006; Gao & White 2006; Zentner 2006).
Previous studies have focussed on the age dependence of clustering of discrete virialized haloes, and did not consider directly the contribution of satellite populations to the age dependence of clustering. Because a large fraction of galaxies belongs to groups and clusters, the clustering of the general galaxy population could have a strong dependence on subhalo ages. Galaxies of a given circular velocity will have formed earlier if they lie in groups or clusters today. Thus, we can expect that the contribution of group and cluster members will increase the tendency for older objects to be more strongly clustered. Also, recent studies relating subhalo numbers and distribution to age and to host halo properties hint that subhalo clustering could depend on subhalo age. Recent simulations have shown that older haloes tend to host fewer subhaloes (e.g. Gao et al. 2004; Zentner et al. 2005; Taylor & Babul 2005; Zhu et al. 2006). Additionally, the clustering strength of virialized haloes is correlated with the numbers of their satellite haloes (Wechsler et al. 2006). Furthermore, subhaloes tend to lie nearer their host centres if they were either formed earlier (Willman et al. 2004) or were accreted earlier (Gao et al. 2004; Taylor & Babul 2005; see however Moore, Diemand, & Stadel 2004).
In order to understand more fully the age dependence of subhalo clustering and its potential effects on observable galaxies, we analyze the relation between age and clustering within halo catalogs that include both the satellite haloes that populate group and cluster haloes as well as the discrete virialized haloes likely to host only a single galaxy. We construct a simple mock galaxy catalog wherein haloes are selected by peak circular velocity to roughly match the galaxy luminosities and abundances in large surveys. Our catalog is selected from a high resolution dark matter simulation that resolves structures within a cosmological volume down to the scale of dwarf galaxies. We stress that we are not attempting to create a realistic catalog of “simulated galaxies”, but rather that we are merely using observationally relevant circular velocities as a convenient means of assessing the potential dependence of clustering on age of haloessubhaloes over a range that has the potential to host galaxies in the CDM model. In § 2, we describe the simulations and the construction of the halosubhalo catalog. In § 3, we detail the age dependence of clustering in our mock catalog, the implications of which we discuss in § 4.
2 numerical techniques
2.1 the simulations
We use the parallel k-D (balanced binary) Tree (Bentley 1975) gravity solver PKDGRAV (Stadel 2001; Wadsley, Stadel & Quinn 2004) to model a 50 Mpc cube, consisting of 4323 dark matter particles of equal mass (the CUBEHI run of Reed et al. (2003; 2005ab). By modelling a relatively small cosmological volume, we are able to probe down to the small masses needed to resolve satellites within groups. The particle mass is 1.3. A starting redshift of 69 and a force softening of 5 kpc (comoving) are used. This run adopts a CDM cosmology with 0.3 and 0.7, and the initial density power spectrum is normalised to 1.0, consistent with WMAP (e.g. Bennett et al. 2003; Spergel et al. 2003). We use a Hubble constant of , in units of 100 km s-1 Mpc-1, and assume no tilt (i.e. a primordial spectral index of 1). To set the initial conditions, we use the Bardeen et al. (1986) transfer function with .
2.2 mock catalog construction
Mock galaxies are chosen from a catalog of haloes selected by circular velocity using the Spline Kernel Interpolative DENMAX (SKID) halo finder (Stadel 2001; http://www-hpcc.astro.washington.edu/tools/skid.html). SKID haloes are identified using local density maxima to identify bound mass concentrations independently of environment. Note that SKID identifies discrete virialized haloes as well as subhaloes (satellite haloes). The radial extent of each SKID halo is determined by the distribution of bound particles, and no predetermined subhalo shape is imposed. The peak circular velocity of each subhalo, , is computed from the peak of the rotation curve . The formation epoch is defined as the time at which of the largest progenitor (amongst all branches of the merger tree at a given epoch) reaches 75 of its maximum value. A progenitor is defined as a halo with at least 30 of its particles incorporated into its descendent. Further detail on formation and accretion times of subhaloes can be found in a number of prior studies (e.g. De Lucia et al. 2004; Gao et al. 2004).
The mock galaxies are selected to have a magnitude range similar to that of the Sloan Digital Sky Survey (SDSS) sample analyzed by Zehavi et al. (2002), , though our results are not sensitive to the precise range. The absolute r-band magnitude of each SKID halo is estimated by applying to the Tully & Pierce (2000) variant of the Tully-Fisher (Tully & Fisher 1977) relation:
| (1) |
where the linewidth is approximately twice (Tully & Fouque 1985). We select approximately 6,000 mock “galaxies” with . In practice, our faintest simulated galaxies are SKID haloes of several hundred particles. While the Tully-Fisher magnitude assignment is subject to a number of uncertainties, including the fact that we apply this to ellipticals as well as spirals (see e.g. Desai et al. 2004), it provides a convenient method for building a catalog of mock galaxies with magnitudes comparable to those in galaxy surveys. The spatial abundance of the mock catalog is 4.8 10-2 Mpc-3, which is 2.6 times that of the SDSS sample selected from the same magnitude range. However, we stress that our results are not sensitive to the abundance or to the limits used for inclusion into the mock catalog; i.e. , we are able to detect a clustering-age dependence for a range of -selected catalogs in addition to the one presented here, as we show later. Thus, even though the objects in our catalog are not expected to describe precisely the galaxy population, we can still capture many of the important clustering properties of the dark hosts of galaxies.
2.3 correlation functions
The spatial pairwise correlation function of galaxies is an important cosmological test, as it quantitatively measures basic clustering properties (see e.g. Peebles 1980). The spatial correlation function is calculated using the direct estimator (as in e.g. Governato et al. 1999):
| (2) |
where is the number of pairs in radial bins of volume , centred at ; is the mean space density of the catalog; and is the volume of the simulation. We take into account our periodic boundary conditions when finding pairs. The correlation function is often approximated by a simple power law:
| (3) |
with , where is the correlation length. The relative clustering amplitude between haloes and the mass distribution is referred to as bias:
| (4) |
For all error estimates, we use 1 poisson errors (equal to the square root of the number of pairs in each bin), which are likely to underestimate the true errors because they do not take into account clustering and sample variance (e.g. Croft & Efstathiou 1994). However, because we are interested primarily in the relative clustering between age-selected objects, and not the true clustering strength, poisson errors are adequate for this study.
3 results
3.1 correlation functions of mass and haloes
In Fig. 1, we plot and the bias factor () for SKID haloes with 50, 100, 150, and 200 . Larger SKID haloes have steeper correlation functions and larger correlation lengths. The largest SKID haloes are “antibiased” () with respect to the mass on small scales, but on large scales they are slightly more clustered than the mass. In general, haloes are “antibiased” with respect to the mass, particularly on small scales for small haloes. This is consistent with small scale “antibias” found in previous simulations (e.g. Jenkins et al. 1998; Colin et al. 1999; Kravtsov & Klypin 1999; Yoshikawa et al. 2001; Diemand et al. 2004; Reed et al. 2005b) and may be caused by merging or destruction of subhaloes in high density regions (e.g. Jenkins et al. 1998; Klypin & Kravtsov 1999). However, previous similar studies have found that the correlation function slope does not become shallower at small scales (Colin et al. 1999; Kravtsov et al. 2004; Neyrinck, Hamilton & Gnedin 2004; Conroy, Wechsler & Kravtsov 2006). The reasons for the difference are not clear, but we we note that the correlation function is a combination of a number of non-powerlaw components (central-satellite, central-central, and satellite-satellite), so there is no a priori expectation that should follow a power-law (e.g. Benson et al. 2000; Berlind & Weinberg 2002; Kravtsov et al. 2004). In fact, the small scale departure from a power law that we see begins approximately where the satellite-satellite term begins to dominate . At these scales, could be sensitive to a number of issues that affect the relative contributions of these components. For example, the number of massive clusters, which can dominate the satellite-satellite term, can be affected by run to run “sample variance” or box size (see e.g. Reed et al. 2007 and references therein). Differences in halo finder behavior at small scales could also be important. Further study is warranted, though our conclusions are not dependent on the smallest scales. It is difficult to quantify the precise scale below which the correlation function will no longer be robust. However, Reed et al. (2005b) indicate that the subhalo distribution is robust down to 100 kpc for simulations of similar resolution. For this reason, we have plotted all correlation functions only down to 100 kpc.

3.2 the age dependence of the mock galaxy catalog correlation function
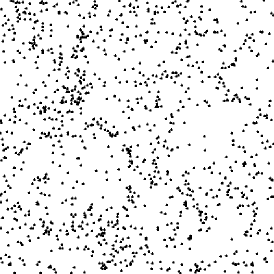
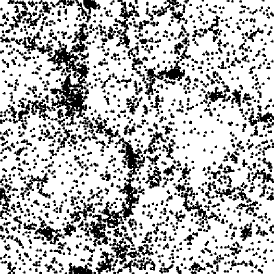
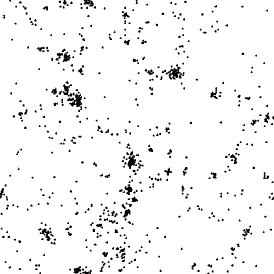
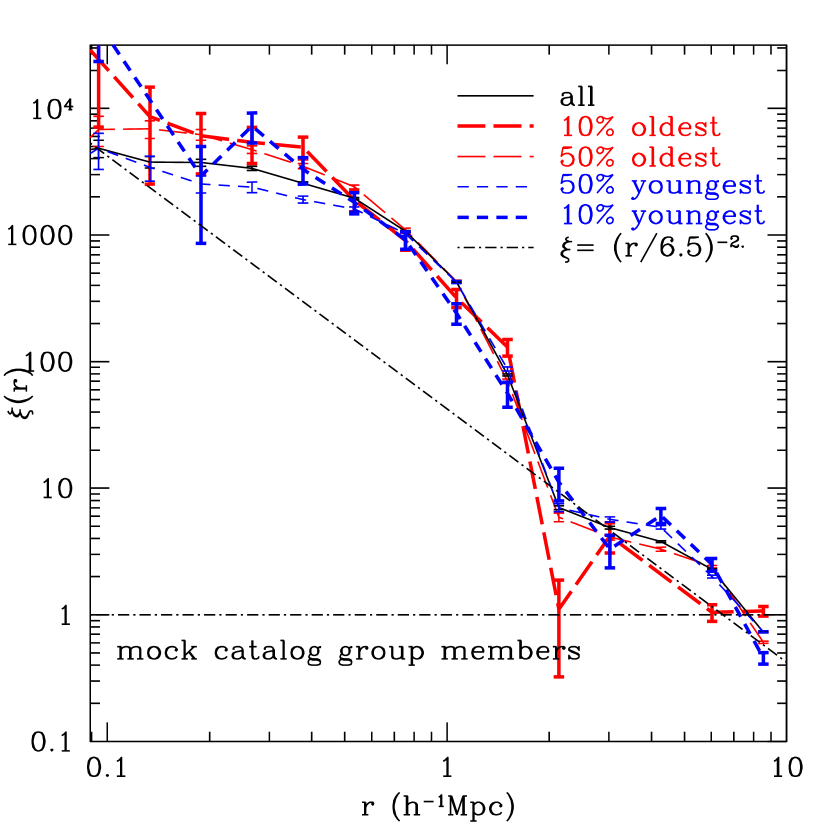
We plot for our mock galaxy sample in Fig. 2, binned according to formation times. Older catalog members are significantly more clustered for all pair separations. The oldest 10 is most preferentially clustered at small scales, with a clustering amplitude of 10 that of the full mock catalog for separations less than 1 Mpc. The differences between the clustering of the young samples and the full catalog are smaller, but are significant. There is little difference in the spatial correlations of the youngest 10 and the youngest 50. The striking visual appearance of the age-clustering dependence is seen in Fig. 3, which shows the redshift zero simulation snapshot divided into the youngest and oldest 20 subsets of the mock catalog.
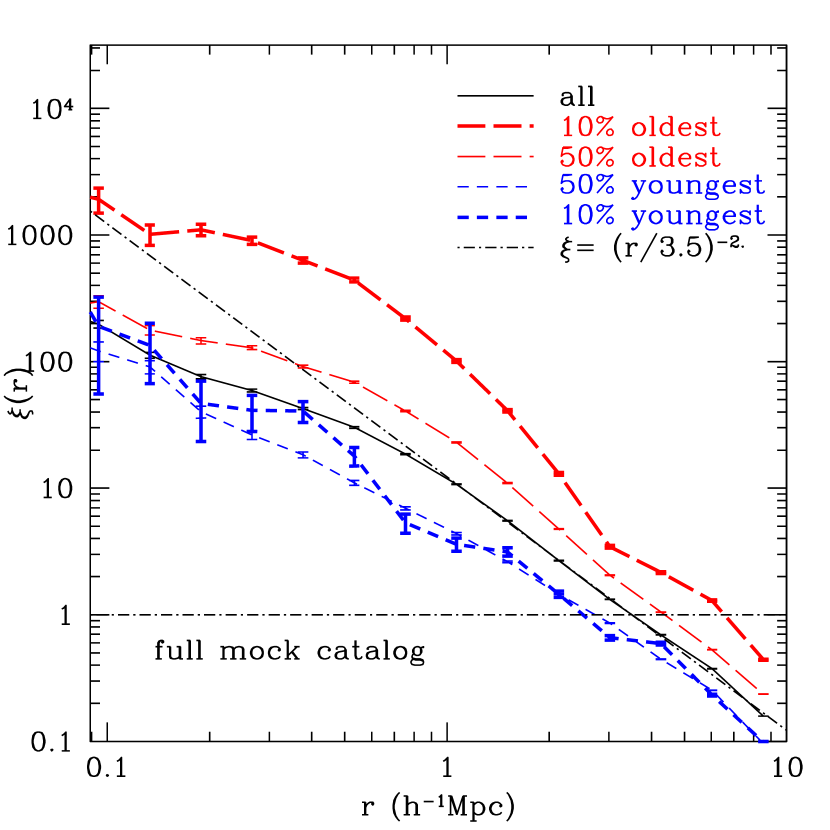
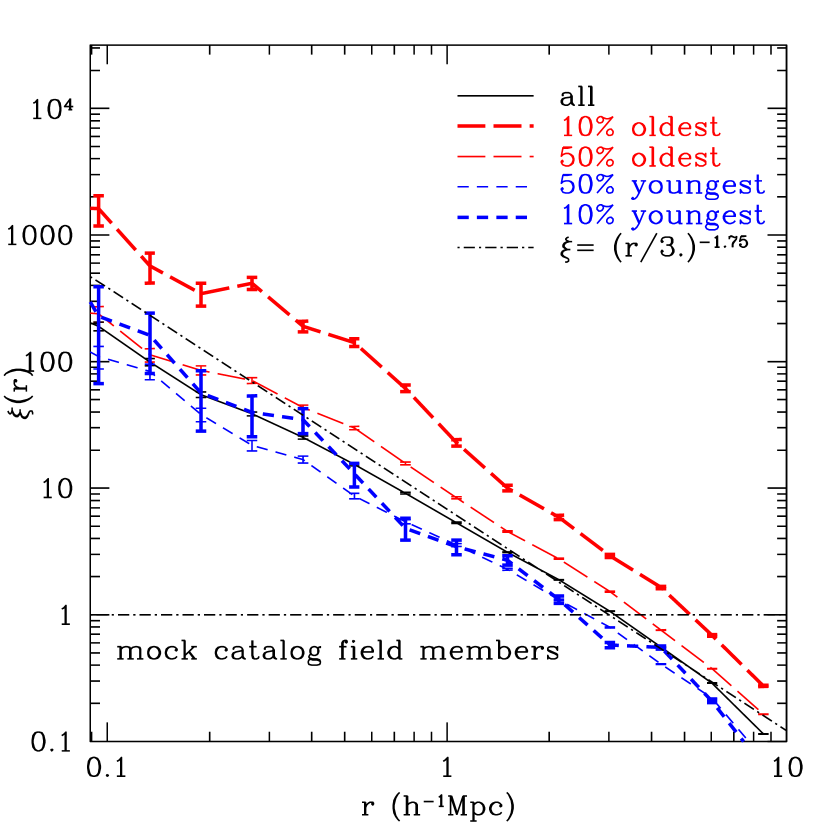
Fig. 4 shows the correlation function for members of groups or clusters larger than . There is some age dependence of the clustering of group members, but it is limited mainly to small pair separations, and is significantly weaker than that found for the full mock catalog. Clustering of field objects, shown in Fig. 5, has a strong age dependence, though not as strong found in the complete sample. To determine group membership, groups are identified using friends-of-friends (FOF; Press & Davis 1982; Davis et al. 1985), wherein the FOF haloes consist of particles of separated by less than 0.2 times the mean inter-particle separation. The group extent is subsequently computed assuming a virial overdensity of approximately 100 times the critical density (Eke, Cole, & Frenk 1996), and mock catalog members whose centre of mass lies within this region are assigned membership to that group. The overall correlation amplitude is a significantly higher for group members than for field members, an unsurprising result given that group members are selected deliberately from within regions of high density, and belong to massive haloes, which are strongly clustered due to the well-known mass-clustering relation.
The age-clustering relation in our mock catalog is likely due to a combination of causes. For the field sample, the obvious mechanism is the Gao et al. age-clustering correlation for discrete virialized haloes. For the full field plus group and cluster catalog (Fig. 2), the age dependence is stronger than that of the field sample alone (Fig. 5) because group and cluster members, which are found in highly clustered environments, tend to be old. Even though group and cluster members comprise only of the full sample, their contribution to the clustering age-dependence is significant due to the strong age correlation with environment. For example, 80 of our group and cluster members are older than the median mock galaxy age; and group and cluster members are 10 times more likely to belong to the 10 oldest subset than to the 10 youngest subset.
On small scales (less than Mpc), dynamical interactions become important for group and cluster members. Upon accretion onto a group or cluster halo, the subhalo will spiral in via dynamical friction, undergoing tidal stripping in the process. This leads to a subhalo distribution where centrally located group and cluster members were accreted earlier and are older. This is the likely cause of the small scale age-dependence within the group and cluster subsample. Finally, for mock galaxies belonging to groups or cluster of similar mass, the age dependence of their host group-group clustering may produce some effect on the correlation function, but it should be mild because our group and cluster hosts are larger than the mass threshold above which the age-clustering relation of discrete haloes becomes weak (Gao et al. 2005).
3.3 can the age-clustering relation cause the observed colour-clustering dependence?
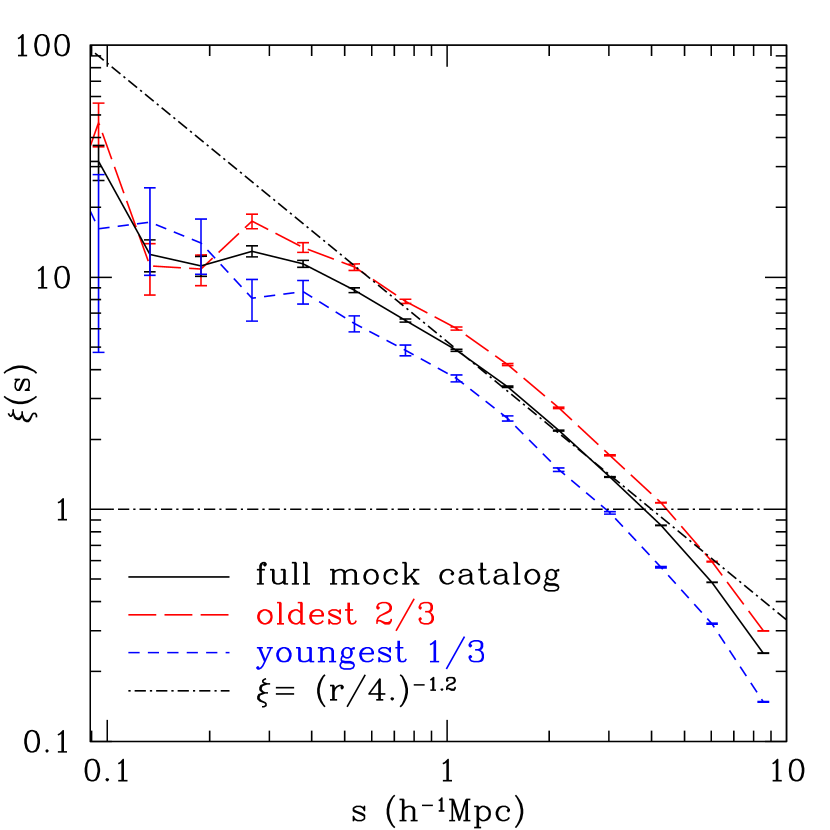
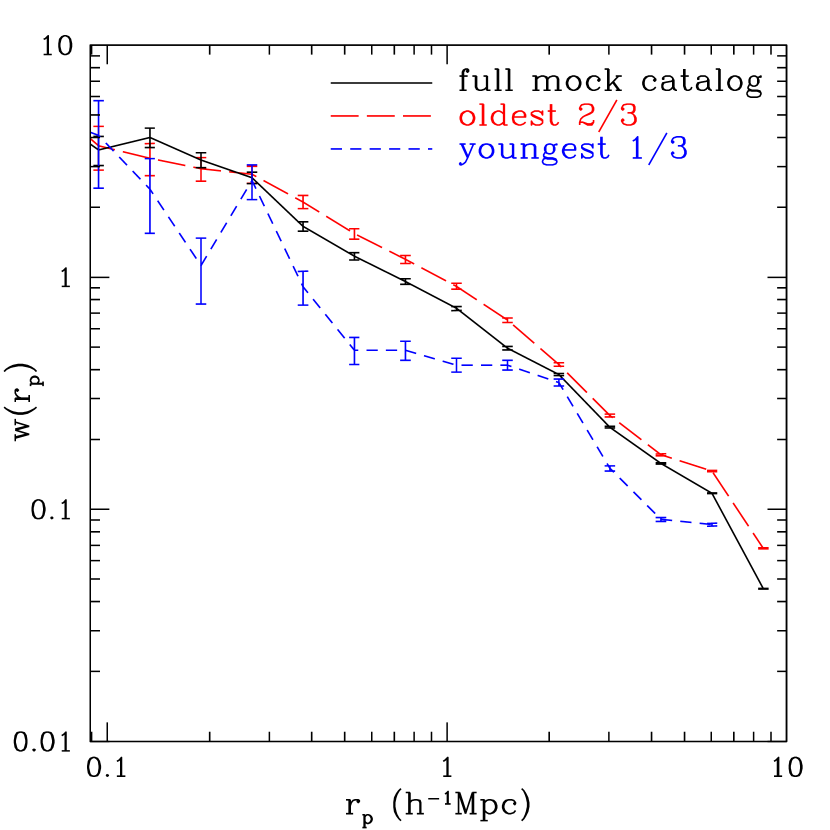
In this section, we perform a simple test to determine whether the magnitude of the age-clustering dependence seen in simulations could be sufficient to account for the observed colour-clustering dependence under the simple assumption that halo age is a proxy for galaxy colour. Here, we have split the catalog into an “old” and a “young” subsample with a 2:1 ratio of old to young haloes, which matches the ratio of red to blue galaxies of the Zehavi et al. (2002) SDSS sample. In Fig., 6, we plot the redshift space two-point correlation function for these catalog subsamples. The magnitude of the age dependence in the mock catalog sample is comparable to the clustering colour-dependence in SDSS for pair separations larger than 5 Mpc; see Fig. 11 of Zehavi et al. (2002) for the SDSS comparison. However, the age-effect is much weaker relative to the observed colour trends for smaller separations, and is insignificant (within the uncertainties) for pairs separated by 200 kpc or less. The observed galaxy clustering colour-dependence, however, extends down to 100 kpc (e.g. Zehavi et al. 2002; 2005, Madgwick et al. 2003; Li et al. 2006). The redshift space correlation function suggests that the age dependence has the potential to account for the observed colour-clustering trends only at large galaxy pair separations. This provides an independent argument that galaxy luminosity-weighted ages, indicated by colour, are different from the ages of the host dark matter subhaloes in which they lie.
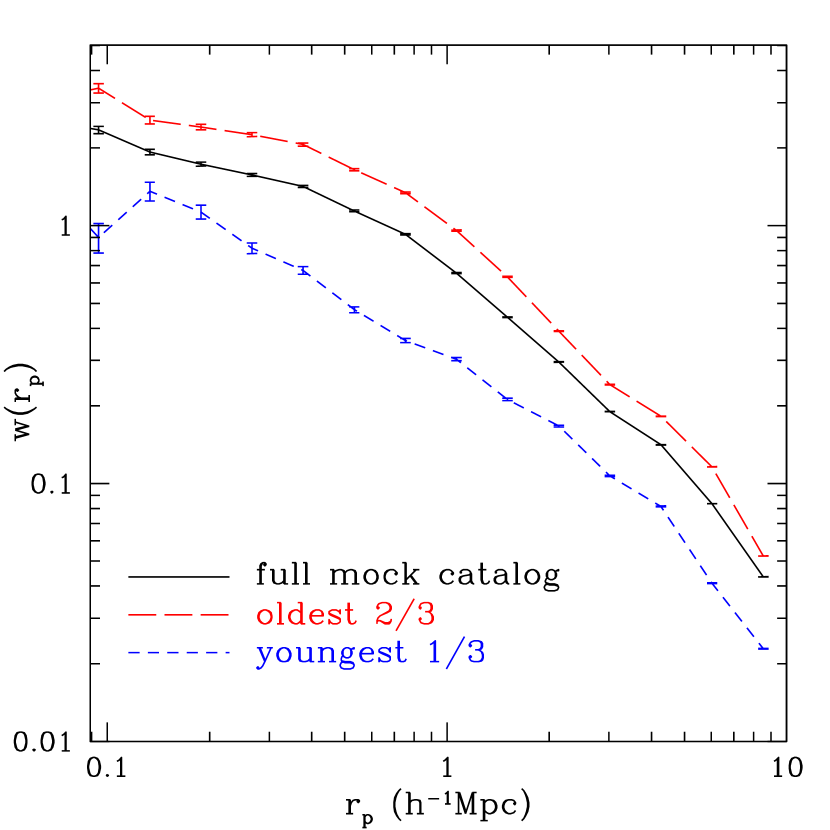
Qualitative differences between age selected simulated haloes and colour-selected observed haloes are also apparent in the projected-space two-point correlation function,
| (5) |
where is the pair excess over random with projected separation binned with area , and is the mean projected density of haloes over the projected simulation area (see e.g. Peebles 1980). In Fig. 7, the differences between the overall slope and small scale amplitude of are relatively small between the young and old simulation samples. However, observed red galaxies have a much steeper and larger amplitude than blue galaxies (see e.g. Zehavi et al. 2002, Fig. 13; Zehavi et al. 2005, Fig. 13) for a wide range of luminosity selected samples (e.g. Li et al. 2006).
We note that our overall correlation amplitude is significantly smaller than that of the SDSS sample. This is due, at least in part, to our finite box size, which means that large scale density fluctuations are not fully and accurately represented (e.g. Bagla & Ray 2005; Sirko 2005; Power & Knebe 2006; Reed et al. 2007), and should not be interpreted as an indication of a conflict with observations. A further contribution to our lower clustering amplitude may be the higher spatial abundance of our mock catalog, which implies that we are selecting smaller, and hence less strongly clustered, objects than in the SDSS sample.
A caveat here is that the mock catalog is inherently different from the SDSS sample. Because the correlation function of the full mock catalog is not a power law, as is generally observed in real galaxies, one should question whether the relative correlations of age-selected samples will display the same properties as real galaxies. A truly realistic simulated galaxy sample would of course require modelling correctly all baryon physics, including star formation and feedback at small scales, a task that is not feasible at this time. However, it is prudent to consider how the details of our mock catalog construction could affect the measured age-clustering signal. To enable better statistics, our mock catalog was selected to contain smaller galaxies than the SDSS sample. It is clear from Fig. 1 that a sample of mock galaxies with higher results in a correlation function that is closer to a power law, better matching observations. We thus make a test to show whether the age-dependence of the correlation function is sensitive to (or abundance). In Fig 8, we show that the clustering dependence on age has similar qualitative behavior, although the age dependence is somewhat weaker, for a sample of larger mock galaxies selected purely by . This indicates that the scale dependence of age-clustering relation in our simulation is relatively insensitive to our specific choice of range.
3.4 age dependence of the pairwise velocity dispersion
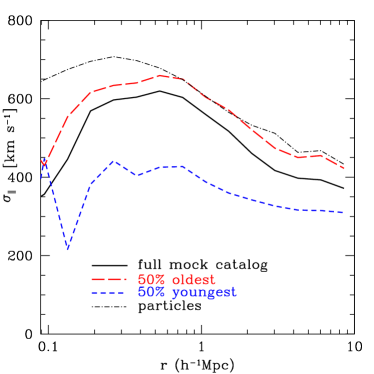
Galaxy peculiar velocities, as measured by the pairwise velocity dispersion, also provide a valuable probe of galaxy clustering, as well as providing an important component for dynamical probes of the dark energy equation of state (e.g. Governato et al. 1997; Baryshev, Chernin & Teerikorpi 2001). The 1-D pairwise velocity dispersion, (r), is the velocity dispersion for particle pairs in the direction parallel to the line of separation. In Fig. 9a, we plot for our mock catalog and for a random subsample of particles. Old mock galaxies have substantially higher pairwise velocities than young mock galaxies, as expected given their higher degree of spatial clustering. The old galaxy (r) is 50 “hotter” than the combined sample, and the young sample is “cooler” by up to 200 . The lower pairwise velocities for the mock catalog with respect to the dark matter particles is consistent with its spatial “antibias”, shown in Fig. 1.
3.5 age dependence in a mass-selected sample
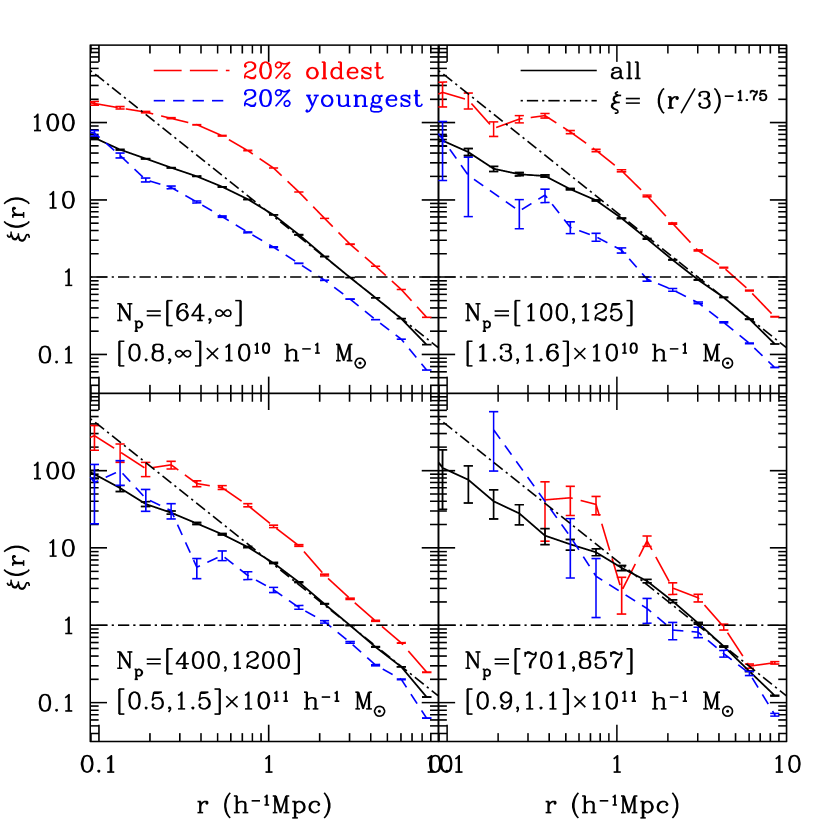
One important difference between our -selected haloes and the Gao et al. age dependence of clustering strength in friends-of-friends haloes is that our sample has a large range in masses whereas the Gao et al. study considered clustering at fixed mass. Because there is both a mass-age dependence and a mass-clustering dependence in CDM models, it is useful to consider what is the relation between age and clustering for SKID haloes at fixed mass. It should be noted that there are nontrivial dependencies of SKID masses on environment; for example, less mass will be found to be gravitationally self-bound in high density environments due mainly to tidal stripping, but also affected to some degree by the addition of the external potential in the computation of self-bound mass. Thus, it is not obvious that there should be a similar age dependence among SKID haloes at fixed mass as there is for friends-of-friends haloes. We show in Fig. 10 that the age dependence of clustering strength is indeed present for SKID haloes. This effect has a strong dependence on pair separation and on halo mass wherein the oldest 20 of the haloes have a clustering amplitude approximately 10 times larger than that of the the youngest 20 at scales of 0.5 Mpc. At , the effect is much weaker, consistent with little or no age dependence, though our uncertainties are large in this higher mass range due to the smaller number of haloes.
4 discussion
We have shown that the clustering age dependence found for discrete friends-of-friends haloes by Gao et al. is also present in a mock galaxy catalog that consists of dark haloes plus satellites selected by to correspond to probable galaxy hosts. This provides strong evidence that galaxy clustering properties depend on the assembly epoch of the dark matter hosts for a population that includes field galaxies as well as galaxies within groups.
It has been suggested by e.g. Gao et al. that the age dependence of the clustering amplitude may be a problem for the models of galaxy formation (e.g. Kauffmann, Nusser, & Steinmetz 1997; Benson et al. 2000; Wechsler et al. 2001) and the models of galaxy clustering in the halo model (e.g. Seljak 2000; Cooray & Sheth 2002; Berlind et al. 2003; van den Bosch, Yang, & Mo 2003) that assume that statistical galaxy properties depend only upon halo mass. The result that the age dependence on clustering is weaker among group members suggests that any impact on these models will likely be strongest for the low mass haloes that typically host 1 luminous galaxy.
Though the clustering age dependence is very strong for the extremes of the mock galaxy population, the age dependence is generally weaker, and has a different scale dependence than the colour dependence observed in recent large surveys. We expect that these qualitative differences are not sensitive to the precise selection criteria of the simulated sample. The different behavior of the simulated clustering age dependence suggests that luminosity-weighted galaxy ages, i.e. colour, do not trace halo age. An apparent observed lack of correlation of stellar ages and halo ages is evident by the general trend that massive (luminous) galaxies tend to have old (red) stellar populations, in apparent contradiction to the inverse mass-age relation present in hierarchical structure formation. This naively suggests that local environmental effects may have a strong influence on galaxy stellar populations. However, the different merger rates of haloes in regions of different density are also important because progenitor haloes of a given mass will have been assembled earlier in more massive present day haloes, leading to earlier star formation (e.g. Mouri & Taniguchi 2006; Neistein, van den Bosch & Dekel 2006).
In any case, ages and colours of galaxies are expected to be influenced by a large number of astrophysical phenomena, including the suppression of star formation by winds, AGN, or ram pressure stripping (see e.g. Berlind et al. 2005; Bower et al. 2005). It may thus be difficult to decrypt a halo age-clustering signal in the real universe, as many of the influences on galaxy properties may depend on mass, environment, or other parameters (see e.g. Abbas & Sheth 2006; Cooray 2006). However, there may still exist some correlation between stellar population and halo age, if for example, major mergers trigger major starbursts, or if the age of the oldest stars in a galaxy is correlated with halo age. A recent semi-analytical study by Croton, Gao, & White (2007) suggests that that the clustering of group or cluster central galaxies should correlate with group host dark matter halo assembly age. Some evidence for an age-clustering trend of group haloes has recently been found by observing that groups of similar mass, whose central galaxies have more passive star formation, which may indicate earlier group assembly, are more strongly clustered (Yang, Mo & van den Bosch 2006). See however, an apparently opposite relation found by Berlind et al. (2006), who find that massive groups tend to be less strongly clustered if they have redder central galaxies. To measure this effect in individual galaxies, one would need to measure accurately star formation histories of galaxies hosted by a narrow ranges of halo masses (see e.g. Heavens et al. 2004 for discussion of age measurements in SDSS stellar populations). Comparisons between the clustering age dependence among simulated haloes and the age dependence among galaxy stellar populations could then provide clues to the physics of galaxy formation.
4.1 Summary
Within a high resolution cosmological dark matter simulation, we have examined the clustering properties of a mock galaxy catalog selected by to match approximately the luminosity range and number density of observable galaxies.
A strong clustering age dependence is found for mock galaxy catalogs that include both central haloes and satellite haloes, and is reflected in both spatial and in kinematic clustering measures. It is caused primarily by 1) the age clustering relation for discrete virialized haloes, acting on field mock galaxies, and 2) the contribution of group and cluster members, which tend to be older, and are highly clustered due to their presence within massive dark matter hosts, thereby increasing the tendency for old members of the full sample to be highly clustered.
The strength of the clustering age dependence implies that it is likely to be manifested in real galaxies. The clustering age dependence is weaker than the clustering colour dependence in 2dF and SDSS for pair separations less than 5 Mpc, and has a different scale dependence. This means that the observed clustering colour-dependence cannot be fully explained by assuming that stellar population ages trace halo ages. That is, one cannot simply assume that red galaxies lie in old haloes and blue galaxies lie in young haloes. The clustering colour dependence must be influenced by additional processes that affect the baryons.
The clustering age dependence is weaker among group and cluster mock catalog members than for the general galaxy population.
Acknowledgments
DR has been supported by PPARC, and acknowledges early funding by a NASA GSRP fellowship while at the University of Washington. FG was supported as a David E. Brooks Research Fellow, and was partially supported by NSF grant AST-0098557 at the University of Washington. TQ was partially supported by the NSF grant PHY-0205413. We thank Geraint Harker, Carlos Frenk, and Richard Bower for useful discussion. Simulations were performed on the Origin 2000 at NCSA and NASA Ames, the IBM SP4 at the Arctic Region Supercomputing Center (ARSC), and the NASA Goddard HP/Compaq SC 45. We thank Chance Reschke for dedicated support of our computing resources, much of which were graciously donated by Intel.
References
- (1) Abbas U., Sheth R., 2006, MNRAS, 372, 1749
- (2) Bagla J., Ray S., 2005, MNRAS, 358, 1076
- (3) Bardeen J.M., Bond J.R., Kaiser N., Szalay A.S., 1986, ApJ, 305, 15
- (4) Baryshev Y., Chernin A., Teerikorpi P., 2001, A & A, 378, 729
- (5) Bennett C. L., et al. , 2003, ApJS, 148, 1
- (6) Benson A., Cole S., Frenk C.S., Baugh C., Lacey C., 2000, MNRAS, 311, 793
- (7) Bentley J. L., 1975, Communication of the ACM 18, 9
- (8) Berlind A., et al. , 2003, ApJ, 593, 1
- (9) Berlind A., Weinberg D., 2002, ApJ, 575, 587
- (10) Berlind A., Blanton M., Hogg D., Weinberg D., Dave R., Eisenstein D., Katz N., 2005, ApJ, 629, 625
- (11) Berlind A., Kazin E., Blanton M., Pueblas S., Scoccimarro R., Hogg D., 2006, astro-ph/0610524
- (12) Colin P., Klypin A., Kravtsov A., Khokhlov A., 1999, ApJ, 523, 32
- (13) Conroy C., Wechsler R., Kravtsov A., 2006, ApJ, 647, 201
- (14) Cooray A., 2006, astro-ph/0601090
- (15) Cooray A., Sheth R., 2002, Physics Reports, 372, 1
- (16) Croft R., Efstathiou G., 1994, MNRAS, 268, 23
- (17) Croton D., Gao L., White S.D.M., 2007, MNRAS, 374, 1303
- (18) Davis, M., Efstathiou, G., Frenk, C.S., White, S.D.M., 1985, ApJ, 292, 381
- (19) De Lucia G., Kauffmann G., Springel V., White S.D.M., Lanzoni B., Stoehr F., Tormen G., Yoshida N., 2004, MNRAS, 348, 333
- (20) Desai V., Dalcanton J. J., Mayer L., Reed D. S., Quinn T., Governato F., 2004, MNRAS, 351, 265
- (21) Diemand J., Moore B., Stadel J., 2004, MNRAS, 352, 535
- (22) Eke, V.R., Cole, S., Frenk, C.S., 1996, MNRAS, 282, 263
- (23) Gao L., White S.D.M., Jenkins A., Stoehr F., Springel V., 2004, MNRAS, 355, 819
- (24) Gao L., Springel V., White S.D.M., 2005, MNRAS, 363, 66.
- (25) Gao L., White S.D.M., 2006, astro-ph/0611921, MNRAS, in press
- (26) Governato F., Moore B., Cen R., Stadel J., Lake G., Quinn T., 1997, NewA, 2, 91
- (27) Governato F., Babul A., Quinn T., Tozzi P., Baugh C. M., Katz N., Lake G., 1999, MNRAS, 307, 949
- (28) Harker G., Cole S., Helly J., Frenk C., Jenkins A., 2005, MNRAS, 367, 1039
- (29) Heavens A., Panter B., Jimenez R., Dunlop J., 2004, Nature, 428, 625
- (30) Jenkins A., et al. , 1998, ApJ, 499, 20
- (31) Jing Y.P., Suto Y., Mo H.J., 2006, astro-ph/0610099, ApJ, in press
- (32) Kauffmann G., Nusser A., Steinmetz M., 1997, MNRAS, 286, 795
- (33) Klypin A., Kravtsov A., 1999, ApJ, 520, 437
- (34) Kravtsov A. Klypin A., 1999, ApJ, 520, 437
- (35) Kravtsov A., Berlind A., Wechsler R., Klypin A., Gottlober S., Allgood B., Primack J., 2004, ApJ, 609, 35
- (36) Li C., Kauffmann G., Jing Y., White S.D.M., Boerner G., Cheng F., (2006), MNRAS, 368, 21
- (37) Madgwick D., et al. , 2003, 344, 847
- (38) Mouri H., Taniguch Y., 2006, astro-ph/0601042
- (39) Moore B., Diemand J., Stadel J., 2004, IAU Coll. 195, Diaferio A., ed.
- (40) Neistein E., van den Bosch F., Dekel A., 2006, MNRAS, 372, 933
- (41) Neyrinck M., Hamilton A., Gnedin N., 2004, MNRAS, 348, 1
- (42) Peebles P., 1980, The Large Scale Structure of the Universe, Princeton Univ. Press, Princeton.
- (43) Power C., Knebe A., 2006, MNRAS, 370, 691
- Press & Davis (1982) Press, W. H. & Davis, M. 1982, ApJ, 259, 449
- (45) Reed D.S., Gardner J., Quinn T., Stadel J., Fardal M., Lake G., & Governato F., 2003, MNRAS, 346, 565
- (46) Reed D.S., Governato F., Verde L., Gardner J., Quinn T., Merritt D., Stadel J., Lake G., 2005a, MNRAS, 357, 82
- (47) Reed D.S., Governato F., Quinn T., Gardner J., Stadel J., Lake G., 2005b, MNRAS, 359, 1537
- (48) Reed D.S., Bower R., Frenk C., Jenkins A., Theuns T., 2007, MNRAS, 374, 2
- (49) Sandvik H.B., Moeller O., Lee J., White S.D.M., 2006, astro-ph/0610172
- (50) Seljak U., 2000, MNRAS, 313, 203
- (51) Sheth R., Tormen G., 2004, MNRAS, 350, 1385
- (52) Sirko E., 2005, ApJ, 2005, 634, 728
- (53) Spergel D., et al. , 2003, ApJS, 148, 175
- (54) Stadel, J, 2001, PhDT, University of Washington, Seattle.
- (55) Taylor J., Babul A., 2005, MNRAS, 364, 535
- (56) Tully R.B., Fisher J.R., 1977, A&A, 54, 661
- (57) Tully R.B., Fouque P., 1985, ApJ, 58, 67
- (58) Tully R.B., Pierce M.J., 2000, ApJ, 533, 744
- (59) van den Bosch F., Yang X., Mo H., 2003, MNRAS, 340, 771
- (60) Wadsley J., Stadel J., Quinn T., 2004, NewA, 9, 137
- (61) Wang H.Y., Mo H.J., Jing Y.P., 2007, MNRAS, 375, 633
- (62)
- (63) Wechsler R. H., et al. , 2001, ApJ, 554, 85
- (64) Wechsler R., Zentner A., Bullock J., Kravtsov A., Allgood B., 2006, ApJ, 652, 71
- (65) Wetzel A., Cohn J., White M., Holz D., Warren M., 2006, astro-ph/0606699
- (66) Willman B., Governato F., Dalcanton J., Reed D., Quinn T., 2004, MNRAS, 353, 639
- (67) Yang X., Mo H.J., van den Bosch F., 2006, ApJ, 638, L55
- (68) Yoshikawa, K., Taruya, A., Jing, Y., Suto, Y., 2001, ApJ, 558, 520
- (69) Zehavi I., et al. , 2002, ApJ, 571, 172
- (70) Zehavi I., et al. , 2005, ApJ, 630, 1
- (71) Zentner A., Berlind A., Bullock J., Kravtsov A., Wechsler R., 2005, ApJ, 624, 505
- (72) Zentner A., 2006, astro-ph/0611454
- (73) Zhu G., Zheng Z., Lin W., Jing Y., Kang X., Gao L., 2006, ApJ, 639, L5