The Properties and Redshift Evolution of Intermediate-Luminosity Off-Nuclear X-ray Sources in the Chandra Deep Fields
Abstract
We analyze a population of intermediate-redshift (), off-nuclear X-ray sources located within optically-bright galaxies in the Great Observatories Origins Deep Survey (GOODS) and Galaxy Evolution from Morphology and SEDs (GEMS) fields. A total of 24 off-nuclear source candidates are classified using deep Chandra exposures from the Chandra Deep Field-North, Chandra Deep Field-South, and Extended Chandra Deep Field-South; 15 of these are newly identified. These sources have average X-ray spectral shapes and optical environments similar to those observed for off-nuclear intermediate-luminosity ( erg s-1 in the 0.5–2.0 keV band) X-ray objects (IXOs; sometimes referred to as ultraluminous X-ray sources [ULXs]) in the local universe. This sample improves the available source statistics for intermediate-redshift, off-nuclear sources with erg s-1, and it places significant new constraints on the redshift evolution of the off-nuclear source frequency in field galaxies. The fraction of intermediate-redshift field galaxies containing an off-nuclear source with 1039 erg s-1 is suggestively elevated (80% confidence level) with respect to that observed for IXOs in the local universe; we calculate this elevation to be a factor of 1.9. A rise in this fraction is plausibly expected as a consequence of the observed increase in global star-formation density with redshift, and our results are consistent with the expected magnitude of the rise in this fraction.
1 Introduction
Intermediate-luminosity X-ray objects (IXOs) in the local universe are off-nuclear X-ray sources having 0.5–8.0 keV luminosities exceeding 1039 erg s-1 (e.g., Colbert & Ptak 2002). X-ray sources making up the high-luminosity end (i.e., 2 1039 erg s-1) of the IXO population are commonly referred to as ultraluminous X-ray sources (ULXs); they are referred to as “ultraluminous” because their inferred isotropic luminosities exceed that expected for an 10 black hole accreting at the Eddington limit. Investigations of this enigmatic population suggest that many IXOs may be intermediate-mass black holes (IMBHs) with masses exceeding 10 (e.g., Colbert & Miller 2004; Miller et al. 2004) and/or normal high mass X-ray binaries (HMXBs) anisotropically beaming X-rays into our line-of-sight (e.g., King et al. 2001). Recent observations indicate IXOs may be a natural high-luminosity extension of the HMXB X-ray luminosity function, suggesting that these sources trace relatively young stellar populations (e.g., Gilfanov et al. 2004). Indeed, analyses of the physical and environmental properties of IXOs have shown that the number and cumulative X-ray luminosities of IXOs are correlated with star-formation rate (e.g., Kilgard et al. 2002; Swartz et al. 2004). As a consequence of this, IXOs are more commonly observed in late-type spiral and irregular galaxies than in early-type ellipticals. Furthermore, investigations of X-ray populations in early-type galaxies find that luminous ( erg s-1) IXOs (i.e., ULXs) are generally absent (e.g., Irwin et al. 2003); however, exceptions have been noted (e.g., Loewenstein et al. 2005).
Recently, the fraction of galaxies in the local universe containing IXOs (as a function of X-ray luminosity) has been constrained statistically using ROSAT observations of a sample of 766 relatively nearby ( Mpc) galaxies (Ptak & Colbert 2004; hereafter PC04) from the Third Reference Catalog of Bright Galaxies (RC3; de Vaucouleurs et al. 1991). PC04 report that, after correcting for expected background sources, 12% and 1% of all local RC3 spiral and irregular galaxies have one or more IXOs with 2–10 keV luminosities erg s-1 and erg s-1, respectively. Here, 2–10 keV luminosities were estimated from the 0.2–2.4 keV flux with an assumed IXO power-law photon index of .
At increasing redshifts, it is plausibly expected that the fraction of galaxies hosting IXOs will increase as a result of the observed rise in global star-formation density with redshift (e.g., Madau et al. 1998; Ghosh & White 2001). Evidence for the global evolution of star-formation activity has also been observed as an increase in the average X-ray luminosity from normal galaxies out to (e.g., Hornschemeier et al. 2002); IXOs likely play an important role in this evolution. Thus far, low X-ray flux levels and limited angular resolution have restricted the study of relatively distant (; Mpc) IXOs. However, deep multiwavelength extragalactic surveys that combine the optical imaging capabilities of the Hubble Space Telescope (HST) and the sub-arcsecond X-ray imaging of the Chandra X-ray Observatory (Chandra) have made the detection and classification of intermediate-redshift (; lookback times of 0.7–3.4 Gyr) off-nuclear sources possible. Hornschemeier et al. (2004; hereafter H04) isolated and characterized ten off-nuclear source candidates in optically-bright field galaxies with redshifts in the range (). This investigation utilized HST observations with Advanced Camera for Surveys (ACS) filters , , , and from the Great Observatories Origins Deep Survey (GOODS; Giavalisco et al. 2004) and deep Chandra observations coincident with these fields through the 2 Ms Chandra Deep Field-North (CDF-N; Alexander et al. 2003) and 1 Ms Chandra Deep Field-South (CDF-S; Giacconi et al. 2002) surveys. H04 found that the fraction of field galaxies with detectable off-nuclear X-ray sources ( erg s-1) at is , suggestively larger than that observed for galaxies in the local universe. Moreover, due to an angular-resolution bias, this “observed” fraction was only considered to be a lower limit to the true fraction, which would include off-nuclear sources with offsets smaller than the Chandra positional error circles. Unfortunately, a study of the dependence of this fraction upon off-nuclear source X-ray luminosity fraction was not possible due to limited source statistics, most notably for sources with 0.5–2.0 keV luminosities erg s-1.
In this investigation, we estimate the true fraction of intermediate-redshift field galaxies hosting off-nuclear X-ray sources as a function of 0.5–2.0 keV luminosity and compare it with that observed for local galaxies (from PC04). We improve the source statistics available for intermediate-redshift, off-nuclear sources by combining the multiwavelength data within the 2 Ms CDF-N and 1 Ms CDF-S with new HST and Chandra observations of the Extended Chandra Deep Field-South (E-CDF-S; Lehmer et al. 2005a). The E-CDF-S is composed of four contiguous 250 ks Chandra fields covering an 0.3 deg2 region, which flanks the 1 Ms CDF-S. A large fraction of the E-CDF-S (80%) has been observed with HST in two ACS filters, and , through the Galaxy Evolution from Morphology and SEDs (GEMS; Rix et al. 2004) survey. The E-CDF-S Chandra observations can detect off-nuclear sources with projected physical offsets of 2 kpc and 0.5–2.0 keV luminosities of erg s-1 in the most sensitive regions. Furthermore, sources with physical offsets of 3 kpc and 0.5–2.0 keV luminosities erg s-1 can be detected over the entire 0.3 deg2 E-CDF-S field.
The Galactic column densities are 1.3 1020 cm-2 for the CDF-N (Lockman 2003) and 8.8 1019 cm-2 for the CDF-S and E-CDF-S (Stark et al. 1992). All of the X-ray fluxes and luminosities quoted throughout this paper have been corrected for Galactic absorption using these column densities. Often we quote Poisson errors with values indicating 1 significance levels; these are computed following Gehrels (1986). = 70 km s-1 Mpc-1, = 0.3, and = 0.7 are adopted throughout this paper (Spergel et al. 2003), and the coordinates are J2000.0.
2 Off-Nuclear Source Sample Construction
2.1 Sample Selection
As discussed above, the combination of the high spatial resolution of HST imaging and sensitive X-ray observations with Chandra is effective in detecting and classifying off-nuclear X-ray sources out to . The 2 Ms CDF-N, 1 Ms CDF-S, and 250 ks E-CDF-S (hereafter CDFs) are currently the deepest extragalactic X-ray surveys conducted with Chandra (see, e.g., Brandt & Hasinger 2005 for a review), and all of these surveys have good HST coverage. These observations reach 0.5–2.0 keV sensitivity limits ranging from 1.8 erg cm-2 s-1 in the CDF-N to 1.1 erg cm-2 s-1 in the E-CDF-S. However, as demonstrated in 3.4.2 of Alexander et al. (2003) and 3.3.2 of Lehmer et al. (2005a), legitimate lower-significance X-ray sources below these quoted sensitivity limits can be identified by matching such sources to associated optically bright galaxies. We therefore searched for off-nuclear sources using both the published main Chandra catalogs of Alexander et al. (2003; CDF-N and CDF-S) and Lehmer et al. (2005a; E-CDF-S) as well as additional lower-significance X-ray sources detected in these fields by running the
IAO \ source-searching algorithm \verb wavdetect \ (Freeman et~al. 2002)
at a false-positive probability threshold of $1 \times 10^{-5}$.  A total of
933, 689, and 1085 \hbox{X-ray} sources in the \hbox{
DF-N, CDF-S, and
E-CDF-S, respectively, were thus used in our searching; these numbers do
not take into account the overlapping regions of the CDF-S and
E-CDF-S.
We searched for and classified off-nuclear X-ray source candidates in
the CDFs using the following criteria:
-
1.
An X-ray source is considered to be an off-nuclear candidate if its position is offset from the optical nucleus of an optically-bright galaxy (ACS magnitudes of ; see below for a description of how this limit was selected) by 1.5 the radius of the Chandra positional error circle (see equations (2) and (3) of Alexander et al. (2003) and Lehmer et al. (2005a), respectively) but is still observed to lie within the optical extent of the candidate host galaxy. The radius of the positional error circle (80–90% confidence) for Chandra sources detected in the CDFs ranges from 03–15 and is dependent on the Chandra point-spread function (PSF) size and the number of observed counts. Our required minimum offset of 1.5 the radius of the Chandra positional error circle was chosen empirically based on histograms showing the number of sources with X-ray-to-optical flux ratios similar to those of active galactic nuclei (AGNs) (i.e., sources with ) versus their X-ray-to-optical positional offsets; we found that 98% of AGN-like sources with were matched to within 1.5 the radius of the Chandra positional error circle. For illustrative purposes, we provide Figure 1, which shows the logarithm of the X-ray-to-optical flux ratio () versus positional offset in units of the Chandra positional error for 0.5–2.0 keV detected sources with optical counterparts having . On the basis of our analysis, the number of nuclear sources in our sample expected to have offsets larger than 1.5 the radius of the Chandra positional error circle is calculated to be 0.91.
-
2.
We required that candidate host galaxies have redshifts in the range of . We used spectroscopic redshifts for 98% of the field galaxies in the CDF-N (e.g., Barger et al. 2003; Wirth et al. 2004) and 6% of the field galaxies in the CDF-S and E-CDF-S (e.g., Szokoly et al. 2004). For the remaining field galaxies in the CDF-N (2%) and CDF-S and E-CDF-S (94%), we used high-quality photometric redshifts from GOODS (Mobasher et al. 2004) and COMBO-17 (Wolf et al. 2004), respectively. We note that in the CDF-S and E-CDF-S, where the majority of the field galaxies have only photometric redshifts via the 17-filter photometry from COMBO-17, the redshift uncertainties are small (i.e., ). The selected redshift range was chosen empirically by considering the observed number of off-nuclear sources detected as a function of redshift. Furthermore, for redshifts larger than 0.3, the projected linear distance corresponding to the typical Chandra positional error (7 kpc) becomes unreasonably large for detecting many off-nuclear sources.
-
3.
In an effort to minimize confusion with unrelated background X-ray sources, we further required that each off-nuclear source candidate is detected in either the 0.5–2.0 keV or 0.5–8.0 keV bands and has a 0.5–2.0 keV luminosity 1041 erg s-1. These restrictions are based on the observed spectral and luminosity properties of local IXOs. X-ray luminosities were computed using the equation
(1) where is the luminosity distance, is the X-ray flux of each source, and is the X-ray photon index assuming a power-law Spectral Energy Distribution (SED). We adopt a photon index of throughout this paper (see 2.2 for justification).
The sky density of optically-bright galaxies is relatively low, and thus the probability of finding an unrelated background X-ray source within the optical extent of these galaxies is also low. In order to estimate the total number of background sources that may be contaminating our sample and to determine the optimal optical-magnitude limit down to which we search for off-nuclear sources, we followed a similar methodology to that outlined in 2 of PC04. We first chose a tentative optical magnitude limit down to which we search for off-nuclear sources. For each candidate host galaxy, we then visually estimated the galactic area within which we would consider an X-ray source to be off-nuclear. This area was approximated by defining an ellipse with a semimajor and semiminor axis and position angle for each galaxy with a circle of radius 1.5 the radius of the Chandra positional error circle removed. Next, we calculated the average 0.5–2.0 keV sensitivity limit over the relevant area of each galaxy using empirically calculated sensitivity maps that were calibrated appropriately for sources detected by
avdetect \ using a false-positive
probability threshold of $1 \times 10^{-5}$.  We chose to use the
\hbox{0.5--2.0~keV} band because of its lo
background and correspondingly high
sensitivity. The number of expected background 0.5–2.0 keV sources per
galaxy was estimated using the galactic area, galaxy sensitivity limit, and
best-fit number-counts relation presented in 4 of Bauer et al. (2004).
Finally, the total number of expected contaminating background sources was
computed by summing the contributions from each galaxy. We found that when
restricting our search to galaxies with , the number of expected
contaminating background sources in the entire survey is reasonably low
(2.22), so we chose as our optical magnitude
limit. For galaxies brighter than this limit, the median (mean) number of
expected background X-ray sources was 0.0029 (0.0064) galaxy-1.
We appropriately correct for contaminating background sources in our analyses
below.
2.2 X-ray and Optical Properties of Off-Nuclear Sources and Host Galaxies
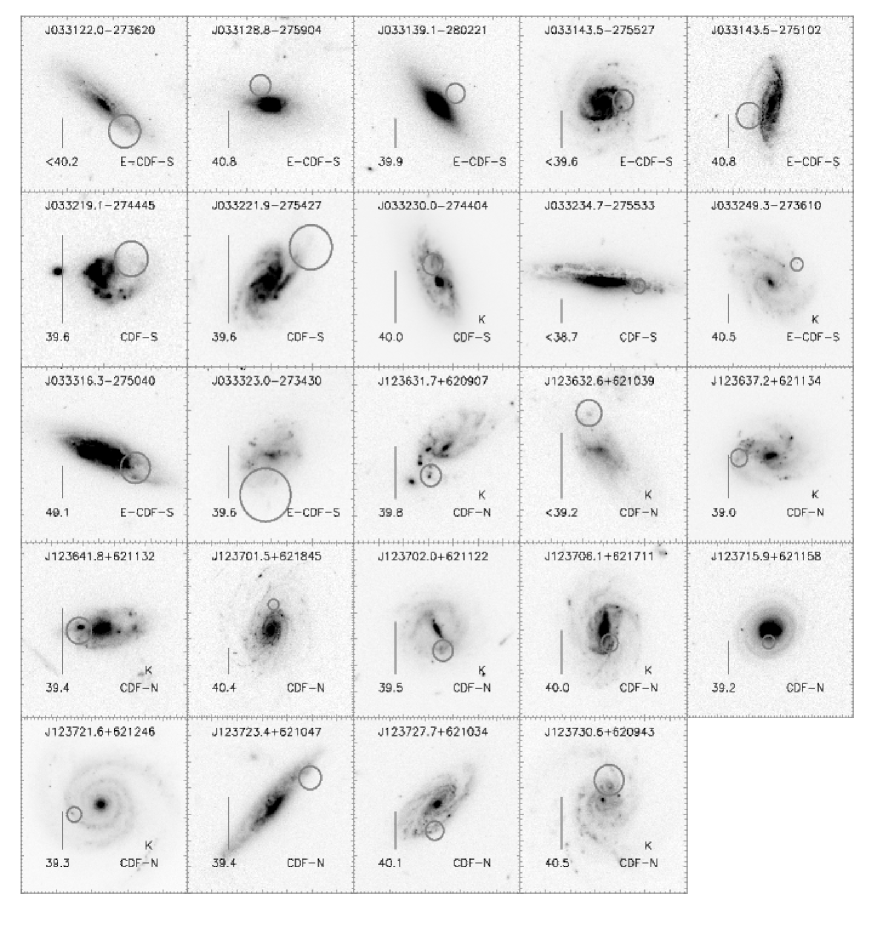
Using the criteria presented above, we identified a total of 24 off-nuclear source candidates (see Figure 2); nine of these were previously detected by H04. The additional source presented in H04 that is not included here (CXOCDFS J033220.35274555.3) was within 1.5 the Chandra positional error and was only detected in the 0.5–1.0 keV band. All of the off-nuclear source candidates are coincident with late-type galaxies (i.e., spirals and irregulars); this is generally consistent with studies of IXOs in the local universe (see 1). We also note that two of the off-nuclear sources (CXOHDFN J123701.99+621122.1 and CXOHDFDN J123706.12+621711.9) are located in galaxies having discernable bars of optical emission. The X-ray properties of the off-nuclear sources are summarized in Table 1 and additional properties, including those of the host-galaxies, are summarized in Table 2; median properties of are listed in the last rows of these Tables. The median off-nuclear source is offset by 2.1 the Chandra positional error, and only two sources (CXOCDFS J033230.01274404.0 and CXOECDFS J033322.97273430.7) have offsets near our required minimum offset of 1.5 the Chandra positional error (see Figure 1). CXOCDFS J033230.01274404.0 was detected and classified as being off-nuclear in both the CDF-S and E-CDF-S data sets independently, lending additional support to its off-nuclear classification. The off-nuclear X-ray sources span a 0.5–2.0 keV luminosity range of erg s-1 to erg s-1 and have a median luminosity of erg s-1. The host galaxies have a median redshift of , which corresponds to a lookback time of 1.8 Gyr, and a median magnitude of 19.1. In Figure 3a, we show the X-ray luminosities of these 24 off-nuclear sources as a function of redshift. The fifteen new objects (filled symbols) presented here significantly improve the source statistics at erg s-1 and ; many of these sources are from the relatively wide solid-angle E-CDF-S survey. All sources with 0.5–2.0 keV upper limits are detected in the 0.5–8.0 keV band. We constrained the average X-ray spectral shape of our off-nuclear sources by stacking the 0.5–2.0 keV and 2–8 keV source counts and exposures. We then computed a vignetting-corrected band ratio by taking the ratio , where is defined to be the X-ray count rate in units of counts s-1. The band ratio was converted into a mean effective photon index using the Chandra X-ray Center’s Portable, Interactive, Multi-Mission Simulator (PIMMS). For the 24 off-nuclear X-ray sources, the mean effective photon index is , a value consistent with that for IXOs observed in the local universe (e.g., Liu & Mirabel 2005 and references therein). We therefore adopted when computing X-ray luminosities for our off-nuclear sources using equation (1). Since all of our off-nuclear sources are coincident with late-type galaxies (see Figure 2), we chose to restrict further comparative analyses to galaxies with late-type morphologies. We selected galaxies in the ACS-covered regions of the CDFs and required in the redshift range . At the quoted optical-magnitude limit, roughly half of the objects detected are Galactic stars; these were characterized visually as point-like sources with diffraction spikes and removed from our list of candidate field galaxies. In total, 385 objects were selected as being non-stellar extragalactic sources with and . We visually classified each galaxy as being either an elliptical (48 galaxies) or a spiral or irregular (337 galaxies). Figure 3b shows the estimated rest-frame 6000 Å luminosities ( [6000 Å]) for all of the 337 spiral and irregular galaxies in our sample (small filled circles). Galaxies hosting off-nuclear sources are plotted with larger open and filled symbols (for H04 and new sources, respectively); most of these occupy the high-luminosity end of the distribution. Optical luminosities were estimated using the magnitude and applying a -correction assuming an Scd spiral-galaxy optical SED (Coleman et al. 1980); this SED was chosen since it is commonly observed for star-forming galaxies. We chose to use the band to compute the 6000 Å luminosities because (1) it is availabile over all of the CDFs and (2) the 6000 Å continuum traces the emission from relatively old stellar populations. The -corrections for the galaxies are small ( mag) and have little dependence on galaxy SED choice. The median 6000 Å luminosities (6000 Å absolute magnitudes, ) of the intermediate-redshift field galaxies and the host galaxies of off-nuclear X-ray sources are (6000 Å) 1.9 erg s-1 (19.8) and 2.7 erg s-1 (20.2), respectively. Ten of our 24 (41%) off-nuclear X-ray sources appear to be coincident with optical knots of emission (see column 8 of Table 2 and the images in Figure 2). In the local universe, IXOs often appear to be located within or near star-forming regions, ranging from small ( pc diameter) diffuse H emission complexes to giant (500 pc diameter) H II regions (e.g., Pakull & Mirioni 2002; Liu & Bregman 2005; Ramsey et al. 2006). The optical knots in our sample have apparent diameters of 500–1000 pc and optical luminosities of (6000 Å) erg s-1. These optical properties are broadly consistent with those of giant H II regions in the local universe (e.g., Kennicutt 1984), suggesting these off-nuclear sources trace distant star-formation regions. In the GOODS fields, high-resolution ACS imaging is available over four optical bands (, , , and ); for the eight off-nuclear sources with optical knots located in these ACS regions, we analyzed the colors in the immediate vicinity of the knots. Figure 4 shows the relative color difference between the optical knots and their host galaxies. These relative colors are defined as follows:
| (2) |
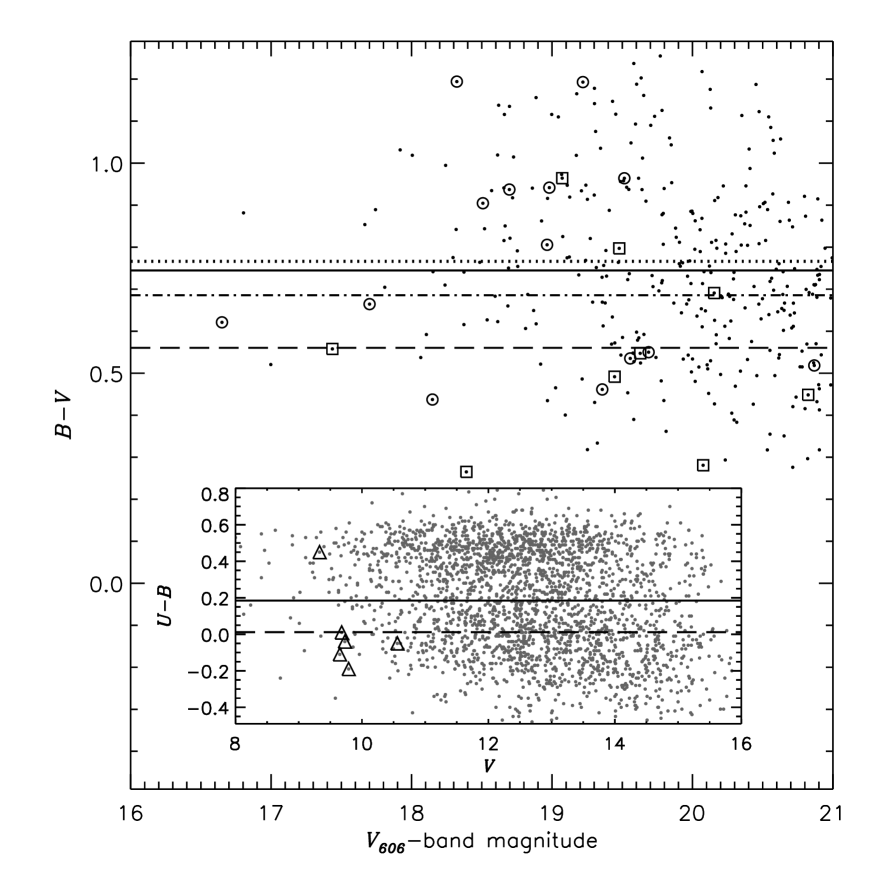
We find that the optical knots are relatively blue compared to their host galaxies (i.e., mean values of and are observed). We stacked the 0.5–2.0 keV and 2–8 keV counts from our off-nuclear sources with and without optical knots to see if we could distinguish between the mean effective photon indices (; see text above) of these two populations. We found that the average spectral shapes of these two populations are statistically consistent (i.e., and , for sources with and without optical knots, respectively). We also investigated the optical colors of the host galaxies to see if the off-nuclear sources are found in more actively star-forming galaxies. We utilized - and -band magnitudes from ground-based observations of the CDF-N with the Subaru 8.2 m telescope (Capak et al. 2004), and of the CDF-S and E-CDF-S with the Wide Field Imager of the MPG/ESO telescope at La Silla (see 2 of Giavalisco et al. 2004); small corrections for the differing bandpasses were applied to the CDF-S and E-CDF-S magnitudes to match those in the CDF-N. Optical emission lines produced by star-forming galaxies can influence the observed broad-band fluxes. At the median redshift of our off-nuclear source sample (), the strong nebular emission line due to [O II] 3727 is located in the -band and the redder emission lines from the [O III] 4959, 5007 doublet and H 4861 are located in the -band. In Figure 5, we show the colors vs. -band magnitudes for our 337 spiral and irregular galaxies in the CDFs. Field galaxies hosting off-nuclear sources have been outlined with open squares and circles, which distinguish between sources with and without optical knots, respectively. The mean optical colors have been plotted for the galaxies (solid line), galaxies hosting off-nuclear sources (dot-dashed line), and galaxies hosting off-nuclear sources with (dashed line) and without (dotted line) optical knots. The typical galaxy hosting an off-nuclear X-ray source shows somewhat bluer optical colors than typical galaxies in the field. We utilized the two-sample Kolmogorov-Smirnov (K-S) test on the unbinned samples of field galaxies and galaxies hosting off-nuclear sources, and repeated the test to compare the sample of field galaxies with off-nuclear sources with and without optical-knot counterparts. We found that, at the 89% confidence level (i.e., K-S probability 0.11), the colors of galaxies hosting off-nuclear sources are statistically different from typical field galaxies in the CDFs. Furthermore, the colors of galaxies hosting off-nuclear sources with optical knots are statistically different from those of typical field galaxies at the 96% confidence level, but galaxies hosting off-nuclear sources without optical knots have colors statistically consistent with those of typical field galaxies. These tests suggest that off-nuclear sources are indeed preferentially located in galaxies undergoing intense star formation; the optical knots directly trace star-forming complexes in such galaxies. For comparison, we plotted the distribution of Johnson colors versus -band magnitude for RC3 galaxies (inset to Figure 5) and highlighted six local galaxies (NGC 1566, NGC 1672, NGC 3623, NGC 4088, NGC 4303, and NGC 4490) observed to host IXOs coincident with distinct, luminous optical knots from Liu & Bregman (2005). These galaxies appear to be notably bluer than typical RC3 galaxies, and using the K-S test, we find that the colors of these galaxy samples are statistically different at the 96% confidence level. Locally, the - and -band magnitudes sample the strong emission features expected in the - and -bands, respectively, at .
3 Analysis and Results
A primary goal of this investigation is to determine whether the “true” luminosity-dependent fraction of galaxies containing off-nuclear X-ray sources () evolves with cosmic time (see 1). Below, we describe our procedure for computing this fraction for our intermediate-redshift galaxy sample and a matched comparison sample of local galaxies from PC04. We assess observational constraints on the X-ray luminosity detection limit and angular resolution for both our sample and that of PC04. To this end, we first describe the computation of the luminosity-dependent “observed” fraction of galaxies hosting off-nuclear sources (); this takes into account the spatially varying sensitivity of the Chandra observations. We then estimate the true fraction () by calculating correction factors to , which account for (1) the number of off-nuclear sources we expect to miss due to angular-resolution limitations (i.e., the number of off-nuclear sources with offsets smaller than the resolution limit) and (2) the multiplicity of these sources within host galaxies (i.e., the expected number of off-nuclear sources within a galaxy having at least one off-nuclear source).
3.1 The Observed Fraction ()
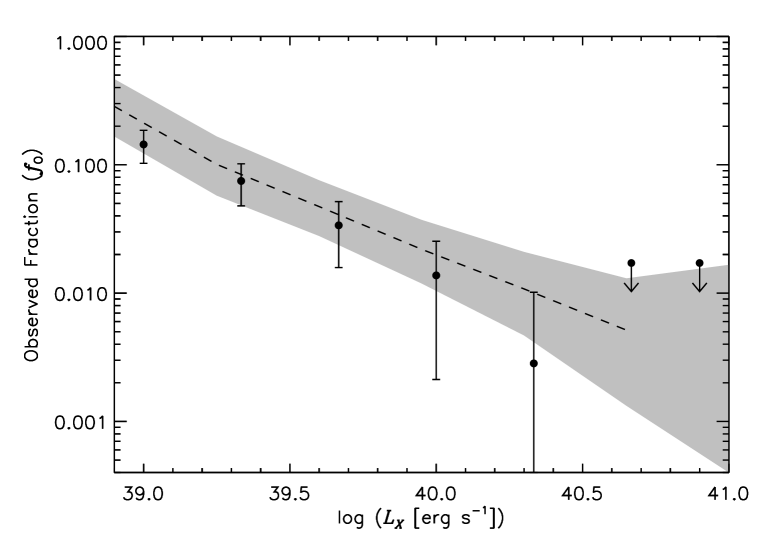
To compute the observed fraction of intermediate-redshift galaxies hosting off-nuclear X-ray sources, we followed a procedure similar to that outlined in 2 of PC04. For each of our 337 spiral and irregular galaxies, we used the 0.5–2.0 keV sensitivity maps described in 2.1 and corresponding redshift information to compute an X-ray luminosity limit above which we could detect an off-nuclear source. All luminosities were calculated using equation (1), adopting . In Figure 6a, we show the number of galaxies with X-ray coverage sensitive enough to detect an off-nuclear source of a given 0.5–2.0 keV luminosity, . For example, there are 20 galaxies with X-ray coverage sensitive enough to detect an off-nuclear source with erg s-1 (i.e., the leftmost bin of Figure 6a), and there are 337 galaxies with coverage sensitive enough to detect an off-nuclear source with erg s-1 (i.e., the rightmost bin of Figure 6a). Figure 6b shows the number of galaxies in each bin of Figure 6a observed to host an off-nuclear source of or greater. In Figure 6b, the number of galaxies included in a given bin versus its neighboring lower-luminosity bin is affected by both the addition of galaxies hosting off-nuclear sources with less sensitive X-ray coverage and the subtraction of galaxies hosting off-nuclear sources that fall below . In order to aid in the understanding of this progression, we have created Figures 6c and 6d, which show the number of added and subtracted galaxies (in ascending order from erg s-1 to erg s-1), respectively. For example, six galaxies in the first bin of Figure 6a that host off-nuclear sources with erg s-1 are added to the first erg s-1 bin of Figure 6b. In the next higher bin (i.e., erg s-1), two new galaxies hosting off-nuclear sources with erg s-1 are added to the appropriate bin of Figure 6b, and two galaxies with off-nuclear source luminosities erg s-1 are subtracted from the same bin. Thus the total number of galaxies with off-nuclear sources of erg s-1 remains at six. In order to calculate the observed fraction of intermediate-redshift galaxies hosting off-nuclear sources (), we divide the histogram entries of Figure 6b, with the estimated number of background sources subtracted (see 2.1), by those of Figure 6a; the observed fraction is presented in Figure 7 as a dashed line with shaded 1 error envelope (computed following Gehrels 1986). The dashed line terminates for erg s-1 due to the fact that there are no off-nuclear sources in our sample with luminosities exceeding erg s-1; the shaded region therefore represents the 3 upper limit to for erg s-1. To make comparisons between the observed fraction of our intermediate-redshift sample and that of the local sample of PC04, we matched the optical-luminosity distribution of the PC04 spiral and irregular galaxies (i.e., Hubble type 0) to that of our 337 spiral and irregular galaxies. At the median redshift () of our off-nuclear X-ray source sample, the requirement on the inclusion of galaxies in our analyses equates to requiring the rest-frame optical luminosity of a particular galaxy to be (6000 Å) erg s-1 (; see Figure 3b). We created a matched PC04 subsample by applying the same optical luminosity cut to the original PC04 spiral and irregular sample. In total, 329 spiral and irregular galaxies were selected for comparison from the original PC04 sample of 766 galaxies. Figure 8 shows the (6000 Å) luminosity distributions of galaxies for both our sample (solid histogram) and the matched subsample of PC04 (dotted histogram). The two luminosity distributions span roughly the same (6000 Å) range and have similar overall shapes; a K-S test indicates that these two distributions are statistically consistent for (6000 Å) erg s-1 (i.e., K-S probability 0.6). Using the matched PC04 subsample and the procedure described above, we recomputed the relevant observed fraction of local galaxies hosting IXOs (); this is shown in Figure 7 as filled circles with 1 error bars and 3 upper limits.
3.2 The True Fraction ()
As noted above, the angular resolution of Chandra, while superb, is limited to the classification of off-nuclear sources at intermediate-redshifts that are offset by more than 1.5 the Chandra positional error from the optical position of the galactic nucleus. Furthermore, the classification of IXOs in the PC04 sample is also limited to X-ray sources offset by 10′′ (Colbert & Ptak 2002). Therefore, the observed fractions for both our sample and the matched PC04 subsample can only be considered to be lower limits on the true fractions of galaxies hosting off-nuclear sources, and therefore direct comparison between these two samples is not meaningful. To address this problem, we have computed the relevant scaling between the observed and true fractions (for both our sample and the matched PC04 subsample) through simulations using a sample of local IXO-hosting galaxies observed with Chandra; we describe these simulations below. We calculated the distribution of projected physical offsets of 65 IXOs from 29 Chandra-observed local ( Mpc) galaxies (compiled by Liu & Mirabel 2005; see references therein). Observations of IXOs in local galaxies with Chandra should be statistically complete for sources with offsets 0.1 kpc, assuming a positional accuracy of 05 and a maximal galactic distance of 50 Mpc. The normalized distribution of offsets for the 65 IXOs used here is shown in Figure 9 (solid histogram). Similar distributions were calculated using subsets of these IXOs with 0.5–2.0 keV luminosities erg s-1; no strong luminosity dependence was observed in the shape of these curves. The overall offset distribution shown in Figure 9 indicates that IXOs are often located relatively close to their host-galaxy nucleus, which is considerably different from the scenario where IXOs are distributed throughout galaxies with constant density (dotted curve). This observed distribution is likely due to the high circumnuclear star-formation activity commonly found in normal and starburst galaxies (e.g., Kennicutt 1998) and is consistent with the IXO offset distribution noted by Swartz et al. (2004). The median physical offset for the 65 Chandra-observed local IXOs is 3 kpc (vertical dashed line) and the expected resolution for CDF sources at the median redshift () of our off-nuclear source sample is 2.6 kpc (vertical dot-dashed line); to first order, this suggests that our observed off-nuclear sources only make up 50% of the physical offset distribution, and we are plausibly missing about half of the off-nuclear sources. Next, we computed the fraction of galaxies in which an X-ray source of a given linear offset would be classified as “off-nuclear” for galaxies in both our intermediate-redshift galaxy sample and the matched PC04 subsample. The relevant fractions for each sample are shown as solid curves in the top panels of Figure 10; dotted curves show the case where there is no resolution limitation. These offset-dependent fractions are constrained by both the projected physical resolution (the observed rise in the fraction near small offsets) and the projected optical size of the galaxies (the observed decline in the fraction at larger offsets). The angular resolution was taken to be 1.5 the Chandra positional error for our galaxy sample and was fixed at 10′′ for the matched PC04 subsample. The angular size of each galaxy was assumed to be the apparent optical semimajor axis (see 2.1) and 0.5 the RC3 major-axis diameter () for our sample and the matched PC04 subsample, respectively. The solid curves presented in the top panels of Figure 10 for each sample are significantly different in the small-offset regime, showing that our sample is more heavily affected by angular-resolution limitations than the matched PC04 subsample. We simulated the expected observable offset distribution of each galaxy sample by convolving the local offset distribution presented in Figure 9 (solid histogram) with the detectable fraction curves (top panels of Figure 10; solid curves); these are displayed as solid histograms in the bottom panels of Figure 10. For comparison, we have shown the actual observed offset distributions of off-nuclear sources in our sample and the matched PC04 subsample (dashed histograms in the bottom panels of Figure 10, respectively). By inspection, we find that the observed and simulated distributions are consistent. In order to estimate the number of off-nuclear sources that were missed due to instrumental-resolution limitations, we simulated the expected distributions of offsets for off-nuclear sources in each galaxy sample for the case where there is no resolution limitation. This was done by convolving the local offset distribution function (solid histogram in Figure 9) with the dotted curves in the top panels of Figure 10. These resulting distribution functions, normalized by the simulated observed distribution functions (solid histograms in the bottom panels of Figure 10), are presented as dotted histograms in the bottom panels of Figure 10. These calculations suggest that 62.1% and 35.0% of the off-nuclear sources would remain unclassified as “off-nuclear” for our intermediate-redshift sample and the matched PC04 subsample, respectively. In the simple case where we would expect 1 off-nuclear source per galaxy, we could simply rescale the observed fractions by a constant scaling factor to obtain the true fractions; we define this scaling factor as , which is 2.64 and 1.54 for our off-nuclear source sample and the matched PC04 subsample, respectively. However, observations of IXOs in the local universe, show that, on average, there is more than one IXO per IXO-hosting galaxy (e.g., Colbert & Ptak 2002). Since we observe only one IXO per IXO-hosting galaxy for our intermediate-redshift sample, a simple constant scaling of the observed fraction to obtain the true fraction is not appropriate. Hereafter, we refer to the mean number of observed IXOs per IXO-hosting galaxy as the “multiplicity” factor (), which varies with IXO luminosity; using the Liu & Mirabel (2005) sample of IXOs, we have estimated the “true” luminosity-dependent multiplicity factor (). We find that has a value of 2.1 and 1.0 IXOs per IXO-hosting galaxy for 0.5–2.0 keV luminosities of erg s-1 and erg s-1, respectively; for comparison, the corresponding observed PC04 multiplicity factor () has a value of 1.5 and 1.0 IXOs per IXO-hosting galaxy, respectively. Using the scaling factor , the observed multiplicity factor , and the true multiplicity factor , we converted the observed fraction to the true fraction following
| (3) |
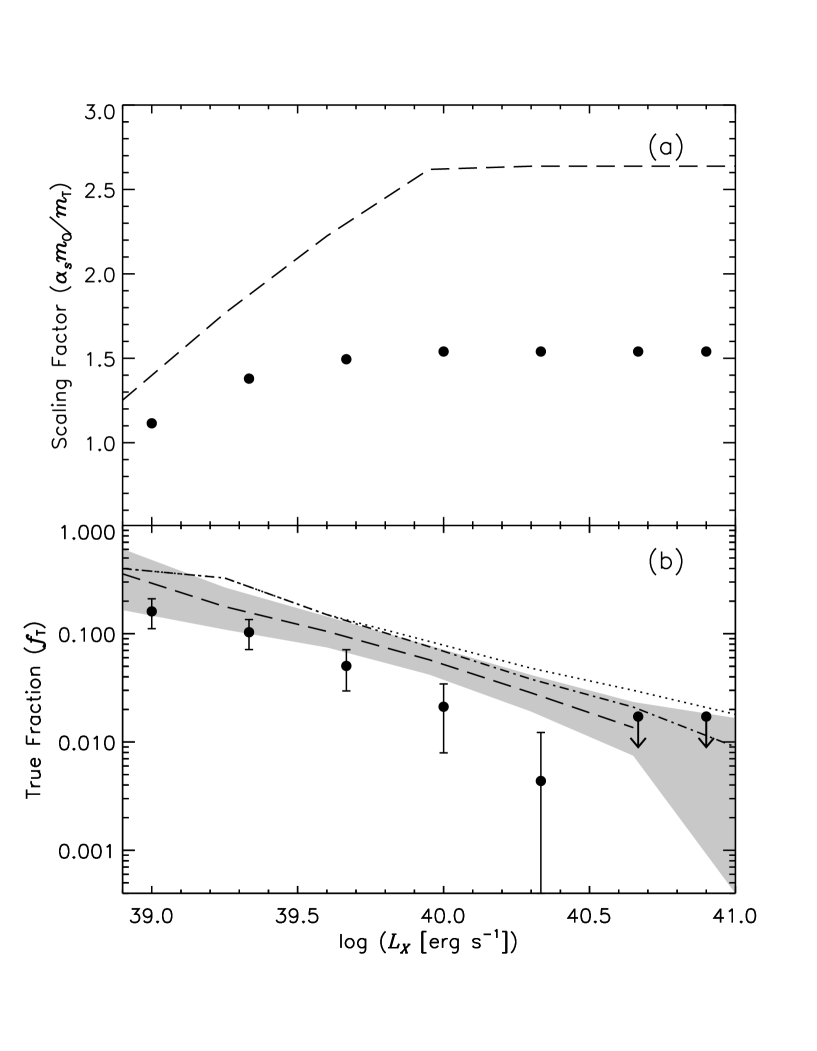
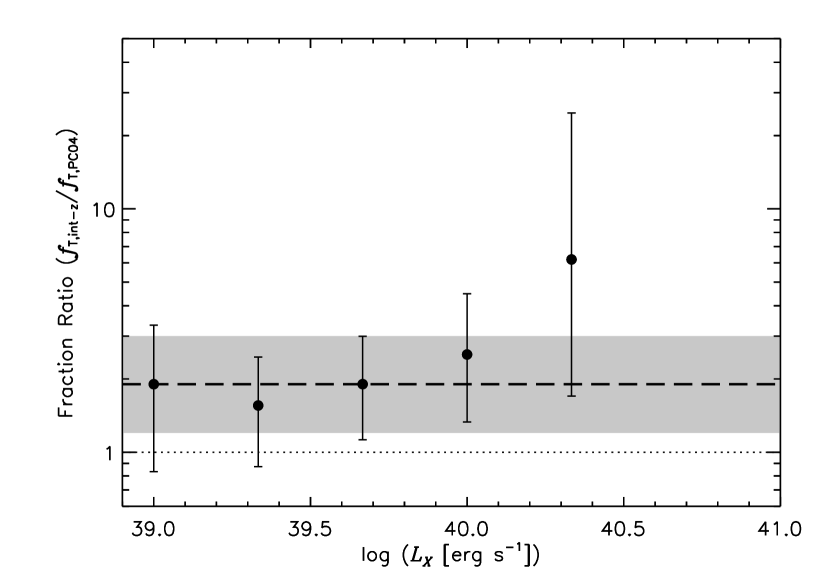
The luminosity-dependent scaling factors (for our intermediate-redshift sample and the matched PC04 subsample), , which scale to obtain , are shown in Figure 11a; the resulting true fractions with 1 errors (computed following Gehrels 1986) are shown in Figure 11b. Fractions measured for our sample () are shown as the dashed line surrounded by the shaded error envelope, and the matched PC04 fractions () are plotted as filled black circles with 1 error bars and 3 upper limits. The dotted curve shows the fraction of our galaxies with an X-ray source of 0.5–2.0 keV luminosity or greater (including both nuclear and off-nuclear sources). This curve was obtained by matching galaxies in our sample to X-ray sources from the main and supplementary Chandra catalogs of the CDFs using a matching criterion of less than one semimajor axis length. Matched sources may include a variety of X-ray sources such as AGNs, luminous nuclear starbursts, and off-nuclear X-ray sources with both small and large offsets (i.e., offsets both less than and greater than 1.5 the radius of the Chandra positional error circle). This curve represents an upper limit to the true fraction of galaxies hosting off-nuclear sources, and we note that our calculated true fraction is below this limit. Furthermore, based on this curve, we calculate that off-nuclear sources are found in 75% and 40% of the galaxies detected in the 0.5–2.0 keV bandpass with coverage sensitive enough to detect sources of erg s-1 and erg s-1, respectively. For further comparison, we have plotted the fraction of galaxies with an X-ray source of 0.5–2.0 keV luminosity or greater but with a luminosity upper bound of erg s-1 (dot-dashed curve); this upper limit was adopted to include mostly galaxies powered by star-forming processes. Again, our estimate of appears to be reasonable in comparison to this detection fraction. Figure 11b shows suggestively that the off-nuclear source frequency for field galaxies rises with redshift. We estimate that 31% of intermediate-redshift spiral and irregular galaxies with (6000 Å) erg s-1 host off-nuclear sources with 1039 erg s-1 versus 16% in the local universe (errors are 1). As mentioned in 1, one may plausibly expect that the frequency of off-nuclear sources would rise as a function of redshift due to the observed global increase in star-formation density, which is measured to be 1.2–3.0 times higher at than it is in the local universe (e.g., Pérez-González et al. 2005; Schiminovich et al. 2005). Furthermore, since the number of IXOs in spiral and irregular galaxies is observed to increase linearly with star-formation rate (e.g., Swartz et al. 2004), it is reasonable to expect that the frequency of off-nuclear source incidence for field galaxies would roughly scale linearly with the star-formation density. In Figure 12 we show the ratio of off-nuclear source incidence fraction for our intermediate-redshift sample and the matched PC04 subsample (i.e., /) as filled circles with 1 error bars. Errors on this quantity were computed using the error propogation methodology outlined in 1.7.3 of Lyons (1991). The fraction ratio for off-nuclear sources with 1039 erg s-1 is 1.9; this is elevated from unity at the 80% confidence level. The dashed horizontal line shows the median fraction ratio. The shaded region shows the expected ratios for the case where the off-nuclear source incidence fraction scales with star-formation density; the dotted horizontal line shows the case where there is no evolution. We note that these computed ratios appear to be broadly consistent with the expected scaling of off-nuclear source incidence with redshift due to the increased global star-formation density.
3.3 Consistency Check
We have performed consistency checks on the results above by degrading the resolution of the PC04 subsample to match that of our intermediate-redshift sample and doing similar analyses to those above. This was achieved by calculating the median physical resolution of our intermediate-redshift galaxy sample (i.e., the median physical offset corresponding to 1.5 the Chandra positional error) and generating a subsample of PC04 IXOs with offsets greater than this median offset. Using this subset of IXOs, we calculated the resolution-normalized observed fraction . In comparison to the intermediate-redshift observed fraction , we find results consistent with those presented above. For example, we find that for sources with 1039 erg s-1, the resolution-normalized fraction ratio /.
4 Summary and Future Work
We have presented the largest sample to date of intermediate-redshift (; ), off-nuclear X-ray sources hosted in optically-bright () field galaxies in the Chandra deep fields. These off-nuclear X-ray sources were found to have similar X-ray spectral shapes and optical environments to IXOs in the local universe and are exclusively found to be coincident with late-type spiral and irregular galaxies. Using this sample, we found that the fraction of spiral and irregular galaxies hosting an off-nuclear X-ray source as a function of X-ray luminosity is suggestively higher at intermediate-redshifts; for off-nuclear sources with 0.5–2.0 keV luminosities 1039 erg s-1, this fraction is measured to be 31% for intermediate-redshift field galaxies versus 16% for local galaxies (see Figure 11). In computing this fraction, we have accounted for the facts that (1) the X-ray sensitivity limit varies spatially over these fields and (2) the angular resolution of Chandra limits the classification of off-nuclear sources. Although the angular-resolution limitations of Chandra would remain, the current situation could still be improved by future Chandra observations over these fields. We note that only 20 of the spiral and irregular galaxies (6%) in our sample have X-ray coverage sensitive enough to detect off-nuclear sources of 0.5–2.0 keV luminosity erg s-1 (see Figure 6a), a regime where 31% of the galaxies are expected to host off-nuclear X-ray sources; these sources are dispersed over all of the CDFs. Deeper Chandra observations over the CDFs would not only improve the source statistics in this regime but would also improve the positional accuracies of brighter sources too. In the 2 Ms CDF-N, sources near the aim point that have sufficient photon counts have positional accuracies of 03. At this resolution, field galaxies at and with off-nuclear sources offset by 0.8 kpc and 2.0 kpc, respectively, could be identified, and more stringent constraints could be placed on the statistical properties of these sources. Such observations covering the presently-classified off-nuclear sources would improve our knowledge of their spectral and variability properties. Furthermore, we note that other programs that utilize deep Chandra exposures in combination with HST observations (e.g., the Extended Groth Strip; Nandra et al. 2005) could build upon the present intermediate-redshift, off-nuclear source sample and improve the statistical constraints on their frequency in field galaxies. Presently, Chandra is the only observatory capable of classifying and characterizing intermediate-redshift, off-nuclear X-ray sources. X-ray missions of the relatively near future (e.g., Constellation-X and XEUS)111For further information regarding Constellation-X and XEUS, visit http://constellation.gsfc.nasa.gov/ and http://www.rssd.esa.int/XEUS/, respectively. will be capable of placing tighter constraints on the spectral and temporal properties of these sources. However, our understanding of the statistical properties of this population and its evolution with cosmic time can only be substantially improved by future X-ray missions with subarcsecond imaging capabilities such as Generation-X,222For further information regarding Generation-X, visit http://genx.cfa.harvard.edu. which is planned to have imaging (01 resolution) and sensitivity capabilities which greatly supersede those already available through Chandra. At , an off-nuclear source with an X-ray luminosity of erg s-1 and a physical offset of 0.8 kpc could be detected and classified in a moderate-length Generation-X exposure. Somewhat more luminous off-nuclear sources ( erg s-1) with offsets as small as 0.6 kpc could be isolated using Generation-X at . Our results suggest that the majority of the X-ray activity from normal and starburst galaxies can be explained by the presence of luminous ( erg s-1) off-nuclear X-ray sources (see, e.g., Figure 11b); this is consistent with studies of X-ray point-source populations in local galaxies (e.g., Colbert et al. 2004). As discussed in 1, the global star formation rate increases with redshift, and the mean X-ray luminosity for field galaxies also rises as a function of redshift. If this increase in the X-ray emission is indeed mainly due to the presence of many luminous off-nuclear sources associated with star formation, then we would expect that for distant, energetic star-forming galaxies such as Lyman break galaxies (LBGs), there may be significant crowding of luminous off-nuclear sources. The mean 0.5–2.0 keV luminosity for LBGs at is 1041 erg s-1 (e.g., Lehmer et al. 2005b). If we assume that the majority of this emission is coming from luminous off-nuclear sources, then we may expect that the average LBG would have 5–10 off-nuclear sources each with 1039.9 erg s-1. When adopting an angular radius of 03 for a typical LBG (e.g., Ferguson et al. 2004), we find that the corresponding off-nuclear source density and mean angular separation would be 20–40 arcsec-2 and 016–022, respectively. Future missions such as Generation-X would suffer from non-negligible source confusion from the multiple off-nuclear sources within these distant LBGs.
References
- (1) Alexander, D. M., et al. 2003, AJ, 126, 539
- Barger et al. (2003) Barger, A. J., et al. 2003, AJ, 126, 632
- (3) Bauer, F.E., Alexander, D.M., Brandt, W.N., Schneider, D.P., Treister, E., Hornschemeier, A.E., & Garmire, G.P. 2004, AJ, 128, 2048
- (4) Brandt, W.N., & Hasinger, G. 2005, ARA&A, 43, 827
- Capak et al. (2004) Capak, P., et al. 2004, AJ, 127, 180
- Colbert & Ptak (2002) Colbert, E. J. M., & Ptak, A. F. 2002, ApJS, 143, 25
- Colbert et al. (2004) Colbert, E. J. M., Heckman, T. M., Ptak, A. F., Strickland, D. K., & Weaver, K. A. 2004, ApJ, 602, 231
- (8) Colbert, E. J. M., & Miller, M. C. 2004 (astro-ph/0402677)
- Coleman et al. (1980) Coleman, G. D., Wu, C.-C., & Weedman, D. W. 1980, ApJS, 43, 393
- de Vaucouleurs et al. (1991) de Vaucouleurs, G., de Vaucouleurs, A., Corwin, H. G., Buta, R. J., Paturel, G., & Fouque, P. 1991, Volume 1-3, XII, 2069 pp. 7 figs.. Springer-Verlag Berlin Heidelberg New York
- (11) Freeman, P.E., Kashyap, V., Rosner, R., & Lamb, D.Q. 2002, ApJS, 138, 185
- Ferguson et al. (2004) Ferguson, H. C., et al. 2004, ApJ, 600, L107
- (13) Gehrels, N. 1986, ApJ, 303, 336
- (14) Ghosh, P., White, N. E. 2001, ApJ, 559, 97
- (15) Giacconi, R., et al. 2002, ApJS, 139, 369
- (16) Giavalisco, M., et al. 2004, ApJ, 600, L93
- Gilfanov et al. (2004) Gilfanov, M., Grimm, H.-J., & Sunyaev, R. 2004, Nuclear Physics B Proceedings Supplements, 132, 369
- Hornschemeier et al. (2002) Hornschemeier, A. E., Brandt, W. N., Alexander, D. M., Bauer, F. E., Garmire, G. P., Schneider, D. P., Bautz, M. W., & Chartas, G. 2002, ApJ, 568, 82
- Hornschemeier et al. (2004) Hornschemeier, A. E., et al. 2004, ApJ, 600, L147 (H04)
- Irwin et al. (2004) Irwin, J. A., Bregman, J. N., & Athey, A. E. 2004, ApJ, 601, L143
- Kennicutt (1984) Kennicutt, R. C. 1984, ApJ, 287, 116
- Kennicutt (1998) Kennicutt, R. C. 1998, ARA&A, 36, 189
- Kilgard et al. (2002) Kilgard, R. E., Kaaret, P., Krauss, M. I., Prestwich, A. H., Raley, M. T., & Zezas, A. 2002, ApJ, 573, 138
- King et al. (2001) King, A. R., Davies, M. B., Ward, M. J., Fabbiano, G., & Elvis, M. 2001, ApJ, 552, L109
- Lehmer et al. (2005a) Lehmer, B. D., et al. 2005a, ApJS, 161, 21
- Lehmer et al. (2005b) Lehmer, B. D., et al. 2005b, AJ, 129, 1
- Liu & Bregman (2005) Liu, J.-F., & Bregman, J. N. 2005, ApJS, 157, 59
- Liu & Mirabel (2005) Liu, Q. Z., & Mirabel, I. F. 2005, A&A, 429, 1125
- Lockman (2003) Lockman, F. 2003, Soft X-ray Emission from Clusters of Galaxies and Related Phonomena, ed. R. Lieu (astro-ph/0311386)
- Loewenstein et al. (2005) Loewenstein, M., Angelini, L., & Mushotzky, R. F. 2005, Chinese Journal of Astronony and Astrophysics, 5, 159
- (31) Lyons, L. 1991, Data Analysis for Physical Science Students. Cambridge University Press, Cambridge
- (32) Madau, P., Pozzetti, L., & Dickinson, M. 1998, ApJ, 498, 106
- Miller et al. (2004) Miller, J. M., Fabian, A. C., & Miller, M. C. 2004, ApJ, 614, L117
- Mobasher et al. (2004) Mobasher, B., et al. 2004, ApJ, 600, L167
- Nandra et al. (2005) Nandra, K., et al. 2005, MNRAS, 356, 568
- (36) Pakull, M. W., & Mirioni, L. 2002, in New Visions of the X-Ray Universe in the XMM-Newton and Chandra Era, ed. F. Jansen et al. (astro-ph/0202488)
- Pérez-González et al. (2005) Pérez-González, P. G., et al. 2005, ApJ, 630, 82
- Ptak & Colbert (2004) Ptak, A., & Colbert, E. 2004, ApJ, 606, 291 (PC04)
- (39) Ramsey, C. J., Williams, R. M., Gruendl, R. A., Chen, C.-H. R., Chu, Y.-H., & Wang, Q. D. 2006, ApJ, in-press, (astro-ph/0511540)
- (40) Rix, H., et al. 2004, ApJS, 152, 163
- Schiminovich et al. (2005) Schiminovich, D., et al. 2005, ApJ, 619, L47
- Spergel et al. (2003) Spergel, D. N., et al. 2003, ApJS, 148, 175
- Stark et al. (1992) Stark, A. A., Gammie, C. F., Wilson, R. W., Bally, J., Linke, R. A., Heiles, C., & Hurwitz, M. 1992, ApJS, 79, 77
- Swartz et al. (2004) Swartz, D. A., Ghosh, K. K., Tennant, A. F., & Wu, K. 2004, ApJS, 154, 519
- Szokoly et al. (2004) Szokoly, G. P., et al. 2004, ApJS, 155, 271
- Wirth et al. (2004) Wirth, G. D., et al. 2004, AJ, 127, 3121
- (47) Wolf, C., et al. 2004, A&A, 421, 913
| X-ray Counts | ||||||||
|---|---|---|---|---|---|---|---|---|
| Source Name | 0.5–2.0 keV | 0.5–8.0 keV | ( [cgs]) | ( [cgs]) | ( cgs) | ( cgs) | Survey | |
| (1) | (2) | (3) | (4) | (5) | (6) | (7) | (8) | (9) |
| CXOECDFS J033122.00273620.1 | 11.5 | 17.0 | 1.8a | 3.36 | 8.37 | 40.2 | 40.6 | E-CDF-S 02 |
| CXOECDFS J033128.84275904.8 | 10.9 | 13.4 | 1.8a | 2.78 | 5.71 | 40.8 | 41.1 | E-CDF-S 03 |
| CXOECDFS J033139.05280221.1 | 1.5 | 14.6 | 1.8a | 0.43 | 7.03 | 39.9 | 41.1 | E-CDF-S 03 |
| CXOECDFS J033143.46275527.8 | 4.7 | 5.4 | 1.8a | 1.18 | 2.26 | 39.6 | 39.9 | E-CDF-S 03 |
| CXOECDFS J033143.48275103.0 | 10.2 | 16.3 | 1.8a | 2.76 | 7.41 | 40.8 | 41.2 | E-CDF-S 03 |
| CXOCDFS J033219.10274445.6 | 5.0 | 15.6 | 1.8a | 0.33 | 1.74 | 39.6 | 40.3 | CDF-S |
| CXOCDFS J033221.91275427.2 | 6.9 | 21.5 | 1.8a | 0.46 | 2.43 | 39.6 | 40.3 | CDF-S |
| CXOCDFS J033230.01274404.0 | 87.6 | 104.0 | 1.9 | 6.39 | 12.28 | 40.0 | 40.2 | CDF-S |
| CXOCDFS J033234.73275533.8 | 20.6 | 58.6 | 1.8a | 1.48 | 7.05 | 38.7 | 39.4 | CDF-S |
| CXOECDFS J033249.26273610.6 | 38.6 | 56.7 | 1.6 | 9.78 | 27.46 | 40.5 | 40.9 | E-CDF-S 01 |
| CXOECDFS J033316.29275040.7 | 22.1 | 22.1 | 1.8a | 5.90 | 9.95 | 40.1 | 40.3 | E-CDF-S 04 |
| CXOECDFS J033322.97273430.7 | 5.3 | 15.1 | 1.8a | 1.71 | 8.17 | 39.6 | 40.3 | E-CDF-S 01 |
| CXOHDFN J123631.66+620907.3 | 34.5 | 40.9 | 1.3 | 1.09 | 2.84 | 39.8 | 40.2 | CDF-N |
| CXOHDFN J123632.55+621039.5 | 9.5 | 4.4 | 1.8a | 0.32 | 0.25 | 39.2 | 39.1 | CDF-N |
| CXOHDFN J123637.18+621135.0 | 17.8 | 21.1 | 1.8a | 0.61 | 1.21 | 39.0 | 39.3 | CDF-N |
| CXOHDFN J123641.81+621132.1 | 33.6 | 39.9 | 1.7 | 1.16 | 2.39 | 39.4 | 39.7 | CDF-N |
| CXOHDFN J123701.47+621845.9 | 44.2 | 50.2 | 1.6 | 1.48 | 3.21 | 40.4 | 40.7 | CDF-N |
| CXOHDFN J123701.99+621122.1 | 19.3 | 21.9 | 1.8a | 0.60 | 1.15 | 39.5 | 39.7 | CDF-N |
| CXOHDFN J123706.12+621711.9 | 17.6 | 34.0 | 1.8a | 0.55 | 1.80 | 40.0 | 40.5 | CDF-N |
| CXOHDFN J123715.94+621158.3 | 17.7 | 20.3 | 1.8a | 0.62 | 1.21 | 39.2 | 39.5 | CDF-N |
| CXOHDFN J123721.60+621246.8 | 18.6 | 29.8 | 1.8a | 0.77 | 2.07 | 39.3 | 39.8 | CDF-N |
| CXOHDFN J123723.45+621047.9 | 21.0 | 27.7 | 1.8a | 0.72 | 1.60 | 39.4 | 39.7 | CDF-N |
| CXOHDFN J123727.71+621034.3 | 32.5 | 35.9 | 1.1 | 1.07 | 2.94 | 40.1 | 40.6 | CDF-N |
| CXOHDFN J123730.60+620943.1 | 34.5 | 67.2 | 0.9 | 1.15 | 6.37 | 40.5 | 41.2 | CDF-N |
| Median Valuesb | 19.3 | 35.9 | 1.8c | 1.09 | 2.84 | 39.9 | 40.2 | … |
| Positional Offset In Units Of… | (6000 Å) | H04 Detection? | Optical Knot? | ||||||
|---|---|---|---|---|---|---|---|---|---|
| Source Name | (arcsec) | (pos. err.) | (kpc) | (mag) | (mag) | ( cgs) | (Y/N) | (Y/N) | |
| (1) | (2) | (3) | (4) | (5) | (6) | (7) | (8) | (9) | (10) |
| CXOECDFS J033122.00273620.1 | 3.60 | 2.11 | 8.88 | 18.80 | 0.140p | 20.1 | 43.4 | N | N |
| CXOECDFS J033128.84275904.8 | 1.70 | 2.00 | 6.97 | 19.22 | 0.266p | 21.4 | 43.9 | N | N |
| CXOECDFS J033139.05280221.1 | 2.28 | 2.25 | 8.96 | 18.24 | 0.251p | 22.2 | 44.2 | N | N |
| CXOECDFS J033143.46275527.8 | 1.71 | 2.02 | 3.49 | 17.94 | 0.112p | 20.4 | 43.5 | N | N |
| CXOECDFS J033143.48275103.0 | 2.28 | 1.91 | 9.28 | 19.57 | 0.265p | 21.1 | 43.8 | N | N |
| CXOCDFS J033219.10274445.6 | 1.21 | 2.02 | 4.01 | 20.84 | 0.201p | 19.0 | 43.0 | N | N |
| CXOCDFS J033221.91275427.2 | 1.81 | 2.37 | 5.58 | 19.82 | 0.184p | 19.9 | 43.3 | N | N |
| CXOCDFS J033230.01274404.0 | 0.91 | 1.52 | 1.31 | 17.53 | 0.076s | 20.2 | 43.4 | Y | Y |
| CXOCDFS J033234.73275533.8 | 4.71 | 5.24 | 3.55 | 16.78 | 0.038s | 19.4 | 43.1 | Y | N |
| CXOECDFS J033249.26273610.6 | 3.30 | 5.03 | 6.72 | 17.90 | 0.112p | 18.9 | 42.9 | N | Y |
| CXOECDFS J033316.29275040.7 | 3.24 | 2.31 | 5.47 | 17.84 | 0.090p | 20.4 | 43.5 | N | N |
| CXOECDFS J033322.97273430.7 | 2.30 | 1.51 | 4.08 | 19.20 | 0.096p | 18.9 | 42.9 | N | N |
| CXOHDFN J123631.66+620907.3 | 1.26 | 2.04 | 3.29 | 20.15 | 0.150p | 19.1 | 43.0 | N | Y |
| CXOHDFN J123632.55+621039.5 | 2.02 | 3.36 | 4.86 | 20.82 | 0.136s | 18.2 | 42.7 | N | Y |
| CXOHDFN J123637.18+621135.0 | 2.23 | 3.71 | 3.31 | 18.39 | 0.079s | 19.3 | 43.1 | Y | Y |
| CXOHDFN J123641.81+621132.1 | 1.23 | 2.04 | 2.04 | 20.08 | 0.089s | 17.9 | 42.6 | Y | Y |
| CXOHDFN J123701.47+621845.9 | 2.89 | 4.65 | 10.69 | 18.98 | 0.232s | 21.3 | 43.9 | Y | N |
| CXOHDFN J123701.99+621122.1 | 1.24 | 2.07 | 2.98 | 19.45 | 0.136s | 19.6 | 43.2 | Y | Y |
| CXOHDFN J123706.12+621711.9 | 1.01 | 1.68 | 3.98 | 19.07 | 0.254s | 21.4 | 44.0 | N | Y |
| CXOHDFN J123715.94+621158.3 | 1.11 | 1.84 | 2.13 | 18.70 | 0.105s | 19.7 | 43.3 | Y | N |
| CXOHDFN J123721.60+621246.8 | 2.62 | 4.36 | 5.07 | 18.15 | 0.106s | 20.3 | 43.5 | Y | Y |
| CXOHDFN J123723.45+621047.9 | 2.87 | 4.31 | 5.90 | 19.56 | 0.113s | 19.0 | 43.0 | Y | N |
| CXOHDFN J123727.71+621034.3 | 2.05 | 2.73 | 7.14 | 18.51 | 0.214s | 21.5 | 44.0 | N | N |
| CXOHDFN J123730.60+620943.1 | 1.48 | 1.68 | 6.54 | 19.48 | 0.298s | 21.5 | 44.0 | N | Y |
| Median Values | 2.05 | 2.11 | 5.07 | 19.07 | 0.14 | 20.2 | 43.4 | … | … |
Note. — Col.(1) Off-nuclear X-ray source name. Col.(2) X-ray positional offset from the associated optical-source nucleus in units of arcseconds. Col.(3) Same offset in previous column in units of the Chandra positional error. Col.(4) Physical offset in units of kpc. Col.(5) ACS observed magnitude of host galaxy. Col.(6) Redshift estimate of the host galaxy for each off-nuclear X-ray source. Superscripts “s” and “p” indicate spectroscopic and photometric redshifts, respectively (see 2 for details). Col.(7) Absolute magnitude of the host galaxy () at Å. Col.(8) Logarithm of the host-galaxy, rest-frame 6000 Å luminosity in units of erg s-1. Col.(9) Indicates whether each source was previously detected by H04. Col.(10) Indicates whether an optical knot is observed to be coincident with the X-ray source position.