Gamma-ray bursts and terrestrial planetary atmospheres
Abstract
We describe results of modeling the effects on Earth-like planets of long-duration gamma-ray bursts (GRBs) within a few kiloparsecs. A primary effect is generation of nitrogen oxide compounds which deplete ozone. Ozone depletion leads to an increase in solar UVB radiation at the surface, enhancing DNA damage, particularly in marine microorganisms such as phytoplankton. In addition, we expect increased atmospheric opacity due to buildup of nitrogen dioxide produced by the burst and enhanced precipitation of nitric acid. We review here previous work on this subject and discuss recent developments, including further discussion of our estimates of the rates of impacting GRBs and the possible role of short-duration bursts.
1 Introduction
More attention has been paid in recent decades to the impact of astrophysical events on the Earth and on Earth-like planets which may exist elsewhere. Impacts by asteroids and comets have been studied and connected with at least one major mass extinction [Alvarez et al. (1980)]. Radiation events, such as large solar flares, supernovae, etc. have also been considered. Gamma-ray bursts are another event in this category and were suggested more than a decade ago [Thorsett (1995)] as a possible source of danger, and later targeted [Smith et al. (2004)] as a possible accelerating mechanism for evolution by intermittent smaller jolts of radiation.
Knowledge of the effects of a relatively nearby GRB on the Earth are of interest for understanding the history and future of life on Earth, as well as in addressing questions of where and when life may exist elsewhere in the Galaxy and beyond. GRBs may have played a role in at least one mass extinction in the Earth’s history [Melott et al. (2004)]. Quantifying concepts such as the galactic habitable zone [Gonzalez et al. (2001)] require information on the rates and effective distances of GRBs throughout the Galaxy.
An important direct impact of a GRB on an Earth-like planet is on atmospheric chemistry due to ionization and dissociation of and , leading to formation of nitrogen oxide compounds. Subsequent effects include destruction of stratospheric ozone which permits solar UVB (290 – 315 nm) to penetrate more effectively to the ground. This UVB flux enhances DNA damage, especially in simple life forms such as phytoplankton. In addition, atmospheric darkening may result due to greatly increased levels of . Precipitation of nitrogen oxide compounds generated by the burst as nitric acid rain may have complicated effects, including even a short-term enhancement of plant productivity. Each of these effects has been explored in some detail by the authors and collaborators. Full details may be found in [Melott et al. (2004), Thomas et al. (2005a), Thomas et al. (2005b), Melott et al. (2005)].
We summarize here these results and discuss implications and future work.
2 GRB Irradiation of the Earth
No galactic GRBs have been directly observed, unless one notes that an outburst like SGR 1806-20 might appear as a short gamma-ray burst (which typically have harder spectra), called an SHB, if located in a nearby galaxy [Hurley et al. (2005)]. The probability of a “near burst” has been estimated [Scalo and Wheeler (2002)]; [Melott et al. (2004)]; [Dermer and Holmes (2005)] with the conclusion that the most probable nearest long-burst GRB directed at the Earth in the last Gy is of order 1 kpc distant.
We estimate the likely rate and distance of GRBs directed at the Earth as follows [Melott et al. (2004)]. GRB distances are large compared to the thickness of the disk of the Galaxy, and so we model the GRB rate as a 2D Poisson process, after [Scalo and Wheeler (2002)]. Based on a review of long duration GRB rate information we normalized the rate to [Guetta et al. (2005)]. Scaling to the blue luminosity density (young, massive stars, as appropriate to the rapid recycling approximation) we estimate the local rate as about .
Recently, there have been arguments that the precursor events of long bursts (LSB) take place in low metallicity environments, with the implication that the rate at cosmologically recent times in our galaxy should be lower [Langer and Norman (2006), Stanek et al. (2006)]. If so, the rate of LSB might be lower than estimated here. The situation is far from clear however. Our galaxy appears to have a history of merger events with low-metallicity satellites whose characteristics look similar to those inferred for LSB host galaxies [Stanek et al. (2006)]. LSB host galaxies also frequently appear to have disturbed morphologies indicating interaction with another galaxy [Wainwright et al. (2005)]. For example, the (very low metallicity) Sagittarius dwarf galaxy is in a close orbit with period 0.85-1 Gy, and apogalactica 12-15 kpc [Ibata et al. (1997), Law et al. (2005)]. Studies of stellar populations indicate evidence for a very recent merger event in bulge stars [van Loon et al. (2003)] and another event is suggested in the outer disk by Cepheids (large mass, low metallicity) [Yong et al. (2006)]. Taken together, these suggest accretion events by low-mass, low-metallicity dwarf galaxies into the Milky Way possibly every few 100 My. Also, there is also good evidence for at least one very young GRB remnant in our Galaxy [Atoyan et al. (2006)].
The situation with SHB is different. Formerly they were neglected due to low total luminosity. As we write, rate estimates are in flux due to the accumulation of new information from Swift [Gehrels et al. (2004)]. There is evidence that for at least one class of SHB the rate has been constant or increasing [Nakar et al. (2005), Guetta & Piran (2005), Barthelmy et al. (2005)] while others are nearly local [Tanvir et al. (2005)]. The higher rate of SHB partially compensates for their lower luminosity. Based on these results, we estimate that the expected rate at a given local fluence for SHB is not more than one order of magnitude lower than the LSB rate we model here. Also, as we shall describe later, bursts with higher-energy photons have a greater effect for the same total burst energy level [Ejzak et al. (2006)]. This also enhances the expected effect of SHB. The situation is fluid, and will stabilize within a year or two with increased rate information. In the meantime we will use the rate previously adopted, discussing how to scale events at other fluences.
Modeling as a Poisson process (see Appendix B of [Scalo and Wheeler (2002)]), the most probable nearest long duration GRB aimed at us in the last Gy is about 2 kpc away. Since the recieved fluence goes as and the number of events goes roughly as , the probability of a burst goes as the inverse of the fluence. This is, of course, only considering distances smaller than the scale of our galaxy. Beyond this the estimate would be more complicated and is irrelevant for major impact on the biosphere. See Table 1 for the probability of a GRB impacting the Earth in the last Gy at several distances. On that timescale, 2 kpc is the expected mean distance to the nearest burst and there is a 55% probability that the Earth has been hit by a (long-burst) GRB from that distance or closer. A Gy is a relevant timescale since both the existence of a high-oxygen atmosphere (required for the presence of an ozone layer) and (not coincidentally) a reasonable fossil record exist on Earth for this order of magnitude timescale. These estimates are independent of the beaming angle, since they are scaled directly from observation. We shall present results for events of typical expected fluence and and note how one can scale the effects.
The attenuation length for photons of a few hundred keV is of order 100m in air at Standard Temperature and Pressure. Consequently effects at the surface of terrestrial planets are primarily indirect, except for a brief flash of moderate intensity UV at the ground. Of course direct effects may be much greater for poorly shielded planets such as Mars. Radiative transfer for events such as this has been explored in some detail [Smith et al. (2004)]. For planets like the Earth, keV-MeV photons have their greatest effect by breaking the very strong triple bond in , which comprises about 80% of the atmosphere. It is normally quite stable, which is why “fixing” nitrogen, i.e. converting it to some other, more available form, is a major limiting factor for biological productivity [Schlesinger (1997)]. Ionization and dissociation of , and also opens a number of reaction pathways normally blocked by the stability of these molecules. A wide range of reaction products are formed in a complicated interaction involving atmospheric chemistry, transport, and the effects of sunlight. This is discussed in moderate detail elsewhere [Thomas et al. (2005b)]. The most important effects for the biosphere are great changes in the concentration of NO, , and (ozone).
[Reid and McAfee (1978)] discussed in a general way the potential for severe stress of the biosphere by any strong ionization event. The three main effects are rainout of nitric acid (), which helps return the atmosphere to its pre-burst state; some opacity to visible light by , which is a brown gas; and the action of NO and to catalyze the destruction of . The comparative importance of these three for typical GRB ionization events were studied [Melott et al. (2005)] and the ozone depletion is clearly of major importance. The usual ozone column density in the stratosphere is not large, but it very strongly absorbs in the UVB (290 – 315 nm). UVB is emitted by the Sun, and is strongly absorbed by proteins and by the DNA molecule, breaking bonds and altering the structure. It is a mutagen and a carcinogen. The existing ozone layer removes about 90% of UVB incident at the top of the atmosphere, and has done so as long as the Earth has had a high atmospheric oxygen abundance. The ozone concentration in the unperturbed atmosphere is less than linearly dependent on oxygen abundance, so even lower-oxygen primordial atmospheres enjoyed considerable protection from UVB. [Melott et al. (2005)] noted that opacity might provide a perturbation toward glaciation in a situation with that instability present, and that rainout might provide an acid stress, or paradoxically a nitrate fertilizer effect, adding a non-negligible amount to the nitrate budget [Schlesinger (1997)]. Because the ozone depletion effect is clearly a calculable and major stress, we will focus on this as our diagnostic of the severity of events.
3 Methods
Since the primary long-term effect of a GRB on the Earth or Earth-like planet is through atmospheric chemistry, our studies have been conducted using an atmospheric chemistry and dynamics model. We have focused on ozone depletion, subsequent increase in solar UVB flux at the ground, and DNA damage. Our model is the Goddard Space Flight Center 2D atmospheric chemistry and dynamics model. Its two dimensions are altitude and latitude. It is empirically based and so is most appropriate for considering effects on the Earth’s atmosphere in its current state, but results should be roughly applicable to other times in the Earth’s history, as well as to other planets with similar atmospheric conditions. Full details of the model may be found in [Thomas et al. (2005b)] and references therein.
Effects of photons from the GRB are introduced into the model via an offline calculation which computes atmospheric ionization profiles. We use the Band spectrum [Band et al. (1993)] in these computations. For results presented here we take typical spectral parameter values , , [Preece et al. (2000)]. Continuing work involves varying parameters such as the peak energy and investigating the impact on the overall results.
Increased UVB at ground level is computed using measured solar irradiance at the top of the atmosphere combined with ozone concentrations from the atmospheric modeling results, using the Beer-Lambert exponential decay law. DNA damage is computed using UVB results convolved with a biological weighting function [Setlow (1974), Smith et al. (1980)]. There is a wide variety of different weighting functions, quantifying specific effects such as the formation of pyrimidine dimers in skin cells [Freeman et al. (1989)], erythema (sunburn [McKinlay & Diffey (1987)]), inhibition of phytoplankton photosynthesis [Cullen et al. (1992)], fish melanoma [Setlow et al. (1993)], mortality of zooplankton and fish [Kouwenberg et al. (1999)], and others [Jagger (1985)]. The spectrum one chooses is dependent upon the endpoint of interest. We are primarily interested in the impact on simple, one-celled, transparent, marine organisms which lie at the base of the food chain. In addition, our results for DNA damage are presented as relative damage, a ratio of the damage rate after a burst to the normal damage rate. This should be less sensitive to the details of the action spectrum since it measures the relative rather than absolute impact of UVB. Finally, we limit our computations to UVB (as opposed to UVA) since ozone has little impact in other biologically relevant wavebands and we are most concerned with the heightened damage due to ozone depletion.
4 Results
We present here a limited set of results which give a sense of the overall effect of a GRB on the Earth. Full details are presented in [Thomas et al. (2005b)]. We begin with depletion of ozone which results from catalytic reactions with nitrogen oxide compounds, , most importantly and . These compounds are created when gamma-rays dissociate and ionize in the stratosphere, which reacts rapidly with to form NO. Catalytic reactions then proceed to deplete through the cycle: , . The net result is: .
In Figure 1 we show globally averaged ozone depletion for a single GRB fluence of , occurring over 5 different latitudes (, , the equator, , and ) and at four different times of the year (equinoxes and solstices). This fluence value corresponds to a “typical” GRB with power (isotropic equivalent) at a distance of 2 kpc.
Note that there is a wide range in maximum globally averaged depletion and the time the atmosphere takes to recover after the burst. Depletions of at least 10% are present up to 5-7 years and full recovery takes 10-12 years. The maximum depletion value (38%) occurs for a burst over the equator in September. It is interesting to note that present-day globally averaged anthropogenic depletions are of the order of 3%.
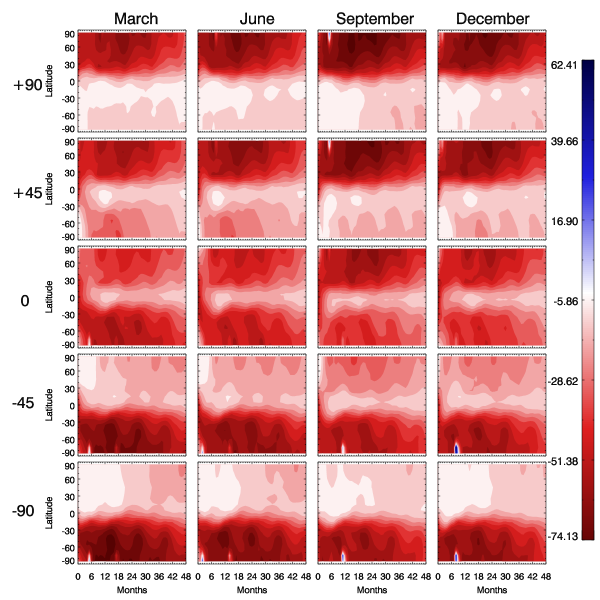
The extent of depletion in latitude over time is shown in Figure 2, for the same set of burst cases. It is apparent that more intense local depletions occur for high latitude bursts, however the effects are mostly contained within the hemisphere. Equatorial bursts yield more evenly distributed depletion. Higher depletion at the poles in all cases is due primarily to colder temperatures in the polar stratosphere. As we will see, however, surface effects such as DNA damage by solar UVB are more intense at mid latitudes, due to the combination of the latitudinal variation of ozone depletion with duration and angle of sunlight. Differences in depletion levels between events at different times of year are due primarily to the timing of polar spring relative to the burst, since the presence or absence of sunlight is a critical factor in the photochemistry governing these results. It is interesting to note that the maximum depletion in the Antarctic ozone “hole” has been observed to be about 60%. We see GRB-initiated depletion significantly greater than this over much larger latitude ranges than are currently observed (Fig. 2).
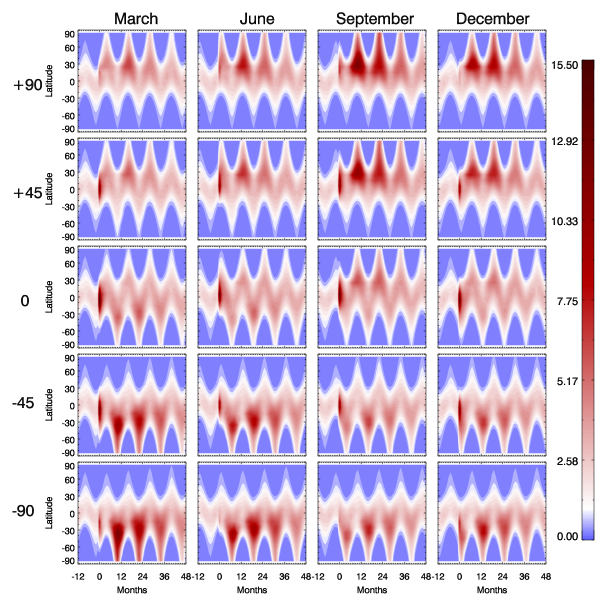
Several effects due to the atmospheric impact of production of and depletion of have been examined. An important effect at the Earth’s surface for any land or shallow (less than 10 m) water dwelling life is the increase in solar UVB radiation which can penetrate through the reduced ozone concentrations. We have quantified the impact of this increase in UVB by computing the irradiance at the surface in the presence of our reduced levels and convolving this with a DNA weighting function which quantifies the effectiveness of particular wavelengths in damaging DNA molecules (taken from [Setlow (1974), Smith et al. (1980)]). Figure 3 shows the relative DNA damage weighted to the annual global average before the burst for the event times and latitudes discussed previously.
An important point that may be noted in Fig. 3 is the fact that DNA damage is greatest, indeed is only great for long periods of time, at mid latitudes. This is due to a combination of the localized ozone depletion and the presence and angle of incident sunlight. Polar areas have periods of complete darkness and even during daylight the solar incidence angle is small. So, while the ozone depletion in the long-term is largest at the poles, the DNA damage in these regions is limited due to the reduced incident solar UVB. It is also interesting to note that experimental results have shown that significant mortality for marine microorganisms, such as phytoplankton, is likely above a value of 2.0 in our units.
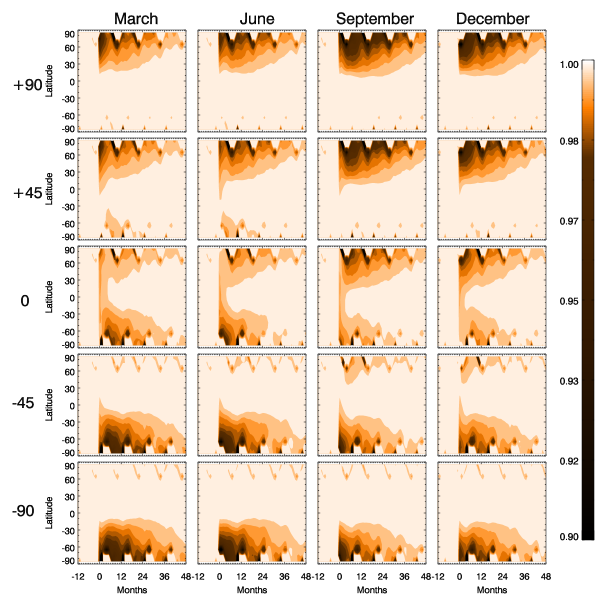
An additional expected effect is an increase in atmospheric opacity in the visible due to the accumulation of , a brown gas. This may lead to climate cooling due to a decrease in surface heating. We have computed the relative solar fluence in the presence of the increased levels of in our model runs. These results are shown in Figure 4. It is apparent that the greatest decrease in solar fluence occurs in the polar regions, corresponding to locally high levels of . This may be significant for climate cooling since it would lead to a reduction in melting of polar ice during summer.
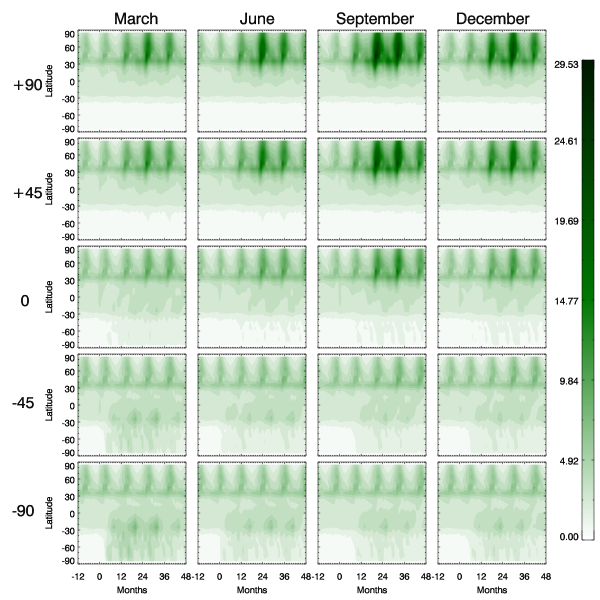
Precipitation of nitric acid, , is the primary mechanism by which the atmosphere returns to normal after a burst. This precipitation may have complicated effects, as mentioned above, either as an acid stress or a fertilizer. We have computed nitrate deposition using precipitation of as determined by the atmospheric model. Figure 5 shows nitrate rainout rates (flux of N as nitrate) pre- and post-burst for the same cases discussed above. Much of the latitude asymmetry in this case is due to the fact that there is presently more precipitation in the northern hemisphere, especially north of about latitude, as compared to that south of latitude. Therefore, these results may not be applicable to other eras in the Earth’s history when landmasses were in different configurations. Deposition values for some burst cases are similar to or somewhat greater than the total generated ordinarily by lightning () and other non-biogenic sources [Schlesinger (1997)] and values for all cases are at least the same order of magnitude as these sources. Currently, in sensitive ecosystems a flux of is considered above the “critical load” to cause damage [Phoenix et al. (2006)]. Smaller inputs may actually be beneficial as fertilizer. We do not expect a dramatic effect for events in the last 300 My from nitric acid precipitation, though even small amounts of nitrogen can be of significant fertilizer benefit to the biota [Schlesinger (1997)]. Biogenic nitrate was much smaller in the past, so we would expect this effect to be more important then, particularly around the time life began to colonize the land (350-450 Mya).
In addition to the received fluence used to produce the above results, we have also investigated the impact of different fluence values. For a fluence of (corresponding to our “typical” burst at a distance of about 6.5 kpc) the impact on ozone and subsequent effects is significantly reduced. Maximum localized depletions of around 39% are seen, as compared to 74% for the higher fluence case. Globally averaged depletion reaches about 16% as compared to 38% for the higher fluence case. Subsequent DNA damage in the case is also lower, around 6 at maximum as compared to about 15 in the higher fluence case. This maximum is also seen to have a shorter duration.
While there is significant uncertainty in applying our model to fluences above a few hundred , we have also investigated a case as an upper limit. This fluence corresponds to our “typical” burst at a distance of about 600 pc. For this case we find localized depletions of ozone up to 80% and globally averaged depletion up to 65%.
We summarize the impact on for the three fluence cases discussed in Table 2. Each case is for a burst occurring in late March (equinox) over the Equator. We point out (as noted in [Thomas et al. (2005b)]) that the globally averaged percent change of ozone scales roughly as the cube root of the fluence. We also note that energy is a more important factor than burst duration in the impact on ozone (see [Thomas et al. (2005b)] and also the next section below).
5 Continuing Work
In addition to various fluence values, we have also studied the impact on our results of varying the GRB duration and peak energy value, and are currently working to extend the spectral range used. Preliminary results [Ejzak et al. (2006)] indicate that ozone depletion varies by only a few percent with burst duration over a wide range of prompt burst times from to . On the other hand, harder photon spectra produce greater atmospheric effects from 2 keV up to about 20 MeV, because of greater penetration into the stratosphere, with little additional effect for energies higher than 20 MeV. This is primarily due to the declining interaction cross section between the photons and the atmosphere for increasing energy, which allows the photons to penetrate more deeply into the stratosphere, where the ozone shield resides. Above MeV scale energies, this cross section becomes nearly constant. Because of this, a “saturation” point is reached as the peak energy approaches 20 MeV, where higher peak energy does not result in increased ozone impact.
The overall implication is that total burst fluence and photon energy are more important than burst duration. The relative unimportance of duration is primarily due to the long timescales of the atmospheric chemistry processes which deplete ozone, compared to the burst durations (hours or days vs. minutes), making all these bursts effectively impulsive events. This fact, combined with the greater impact of harder spectra indicates that even less luminous, shorter duration SHB events need to be considered along with the long bursts investigated to date, particularly given their likely higher rates at low redshift.
6 Conclusions
It is clear from results reviewed here, combined with the likelihood of a significant GRB event in the last Gy that these events must be considered when looking at the long-term history of life on Earth. In addition, in investigating probable hazards elsewhere in the Galaxy, GRBs must be taken into consideration, along with supernovae, impactors and other such events. As we seek to improve our understanding of where and when life may exist beyond the confines of the Earth, these considerations will become increasingly important.
7 Acknowledments
We are grateful for research support under NASA grant NNG04GM14G, in the program Astrobiology: Exobiology and Evolutionary Biology. Figures shown here have previously appeared in Astrophysical Journal [Thomas et al. (2005b)] and are used by permission of the author and the publisher. We thank Bruce Twarog and an anonymous referee for useful comments.
References
References
- [Alvarez et al. (1980)] Alvarez, LW et al. 1980 Science 208 1095
- [Atoyan et al. (2006)] Atoyan, A, Buckley, J, & Krawczynski, H 2006, Astrophys. J. Lett., accepted for publication; astro-ph/0509615
- [Band et al. (1993)] Band, D, et al. 1993 Astrophys. J. 413 281
- [Barthelmy et al. (2005)] Barthelmy, SD et al. 2005 Nature 438 994
- [Cullen et al. (1992)] Cullen, JJ, Neale, PJ, & Lesser, MP 1992 Science 258 646
- [Dermer and Holmes (2005)] Dermer, CD and Holmes, JM 2005 Astrophys. J. Lett. 628 L21
- [Ejzak et al. (2006)] Ejzak, L, Melott, A, Medvedev, M, & Thomas, B 2006, in preparation
- [Freeman et al. (1989)] Freeman, SE, et al. 1989 Proc. Natl. Acad. Sci. 86 5605
- [Gehrels et al. (2004)] Gehrels, N et al. 2004 Astrophys. J. 611 1005
- [Gonzalez et al. (2001)] Gonzalez, G, Brownlee, D, & Ward, P 2001 Icarus 152 185
- [Guetta & Piran (2005)] Guetta, D, & Piran, T 2005 Astron. Astrophys. 435 421
- [Guetta et al. (2005)] Guetta, D, Piran, T, & Waxman, E 2005 Astrophys. J. 619 412
- [Hurley et al. (2005)] Hurley, K et al 2005 Nature 434 1098
- [Ibata et al. (1997)] Ibata, RA et al. 1997 Astron. J. 113 634
- [Jagger (1985)] Jagger, J 1985, Solar-UV Actions on Living Cells (New York: Praeger)
- [Kouwenberg et al. (1999)] Kouwenberg, JHM, Browman, HI, Runge, JA, Cullen, JJ, Davis, RF, & St-Pierre, J-F 1999 Marine Biology 134 285
- [Langer and Norman (2006)] Langer, N, & Norman, C A 2006 Astrophys. J. Lett. 638 L63
- [Law et al. (2005)] Law, DR et al. 2005 Astrophys. J. 619 807
- [McKinlay & Diffey (1987)] McKinlay, AF & Diffey, BL 1987, in Human Exposure to Ultraviolet Radiation: Risks and Regulations, eds.
- [Melott et al. (2005)] Melott, A, Thomas, B, Hogan, D, Ejzak, L and Jackman, C 2005 Geophys. Res. Lett. 32 L14808 doi:10.1029/2005GL02307
- [Melott et al. (2004)] Melott, A, et al. 2004a Int. J. Astrobiology 3 55 (astro-ph/0309415)
- [Nakar et al. (2005)] Nakar, E, Gal-Yam, A, & Fox, DB 2005 preprint astro-ph/0511254
- [Phoenix et al. (2006)] Phoenix, G, et al. 2006 Global Change Biology 12 470
- [Preece et al. (2000)] Preece, RD, et al. 2000 Astrophys. J. Supp. 126 19
- [Reid and McAfee (1978)] Reid, GC, and JR McAfee (1978) Nature 275, 489
- [Setlow (1974)] Setlow, RB 1974 Pro. Nat. Acad. Sci. USA 71 3363
- [Setlow et al. (1993)] Setlow, RB, Grist, E, Thompson, K, & Woodhead, AD 1993 Proc. Natl. Acad. Sci. US 90 6666
- [Scalo and Wheeler (2002)] Scalo, J and Wheeler, JC 2002 Astrophys. J. 566 723
- [Schlesinger (1997)] Schlesinger, WH 1997 Biogeochemistry, (2nd Ed.; San Diego: Academic Press)
- [Smith et al. (2004)] Smith, DS, Scalo, J, & Wheeler, JC 2004 Icarus 171 229
- [Smith et al. (1980)] Smith, R, Baker, K, Holm-Hansen, O, and Olson, R 1980 Photochem. Photobiol. 31 585
- [Stanek et al. (2006)] Stanek, KZ et al. 2006 preprint astro-ph/0604113
- [Tanvir et al. (2005)] Tanvir, N, et al. 2005 Nature 438 991
- [Thomas et al. (2005a)] Thomas, B, et al. 2005 Astrophys. J. Lett. 622 L153
- [Thomas et al. (2005b)] Thomas, B, et al. 2005 Astrophys. J. 634 509
- [Thorsett (1995)] Thorsett, S 1995 Astrophys. J. Lett. 444 L53
- [van Loon et al. (2003)] van Loon, J, et al. 2003 MNRAS 338 857
- [Wainwright et al. (2005)] Wainwright, C et al. 2005 Astrophys J., submitted; astro-ph/0508061
- [Yong et al. (2006)] Yong, D, et al. 2006 Astron. J. 131 2256
-
Distance (kpc) Probability 1 18% 2 55% 4 70%

-
Fluence () Globally Averaged Localized 10 -16 -28 100 -36 -55 1000 -65 -80