Chandra Observations of SDSS J1004+4112: Constraints on the Lensing Cluster and Anomalous X-Ray Flux Ratios of the Quadruply Imaged Quasar
Abstract
We present results from Chandra observations of SDSS J1004+4112, a strongly lensed quasar system with a maximum image separation of . All four bright images of the quasar, as well as resolved X-ray emission originating from the lensing cluster, are clearly detected. The emission from the lensing cluster extends out to approximately . We measure the bolometric X-ray luminosity and temperature of the lensing cluster to be and 6.4 keV, consistent with the luminosity-temperature relation for distant clusters. The mass estimated from the X-ray observation shows excellent agreement with the mass derived from gravitational lensing. The X-ray flux ratios of the quasar images differ markedly from the optical flux ratios, and the combined X-ray spectrum of the images possesses an unusually strong Fe K emission line, both of which are indicative of microlensing.
Subject headings:
galaxies: clusters: general — gravitational lensing — quasars: individual (SDSS J100434.91+411242.8) — X-rays: galaxies1. Introduction
The quadruply lensed quasar SDSS J1004+4112, first identified as a gravitational lens candidate from optical imaging and spectroscopy from the Sloan Digital Sky Survey (SDSS; York et al., 2000), has an exceptionally large image separation of (Inada et al., 2003; Oguri et al., 2004). The quasar is multiply imaged by a cluster of galaxies (rather than a galaxy) at . This is the only known quasar strongly lensed by a central part of a massive cluster. The quasar appears to be radio-quiet since it is not detected in radio surveys such as the FIRST survey (Becker et al., 1995). Subsequent observations revealed additional intriguing aspects of the system. Richards et al. (2004) discovered time variability in the blue wings of several optical broad emission lines, which can be plausiblly interpreted in terms of microlesning. Hubble Space Telescope images detected the fifth image (Inada et al., 2005) and multiply imaged background galaxies (Sharon et al., 2005). SDSS J1004+4112 appears to be an ideal laboratory for exploration of the structure of a large cluster of galaxies and a quasar.
The uniqueness of SDSS J1004+4112 affords advantages that strongly argue for multiwavelength observations, of which X-ray observations constitute an essential part. Measurement of the X-ray properties of the lensing cluster offers an opportunity to improve lens models of SDSS J1004+4112. Moreover, the lensing cluster is the first example of a strong-lens selected cluster; it is interesting to determine if the cluster follows the empirical scaling relations between luminosities, temperatures, and masses. Second, we can investigate the magnification ratios of the quasar images at X-ray wavelengths, which may aid the interpretation of the microlensing event that has been observed at optical wavelengths (Richards et al., 2004). Indeed, X-ray flux ratios of lensed quasars are frequently different from optical flux ratios; this phenomenon has been attributed to microlensing (Chartas et al., 2004; Blackburne et al., 2006).
In this paper, we report our analysis of an observation of SDSS J1004+4112 with the Chandra X-Ray Observatory. A key feature of Chandra images is the high angular resolution (on the order of ); this resolution is required to allow reliable separation of the X-ray flux of the lensing cluster from that of the quadruply imaged quasar. In this paper we will adopt a cosmological model with the matter density , the cosmological constant , and the Hubble constant (Spergel et al., 2003). At the redshift of the cluster (), corresponds to 7.16 kpc. Unless otherwise specified, quoted errors indicate the 90% confidence range.
2. Observations
SDSS J1004+4112 was observed for 80 ks with the Chandra Advanced CCD Imaging Spectrometer (ACIS; Garmire et al., 2003) on 2005 January 1 and 2. The data were obtained with the ACIS S3 CCD operating in VFAINT mode. This CCD has a pixel format with an image scale of pixel-1. The target was offset from the nominal aim point with a Y-offset of , however, this has little effect on the spatial resolution. The CCD temperature during the observations was .
The data were processed using the standard software packages CIAO 3.2.1 and CALDB 3.0.3. In the analysis of diffuse emission from the cluster (§3), periods of high background rates (defined by % higher than the quiescent rates in the 2.5–7 keV band) were removed; the net exposure time is 62042 s. On the other hand, the data without lightcurve-filtering (79987 s) are used in the analysis of quasar components (§4) since the background counting rate is negligibly small for point sources.
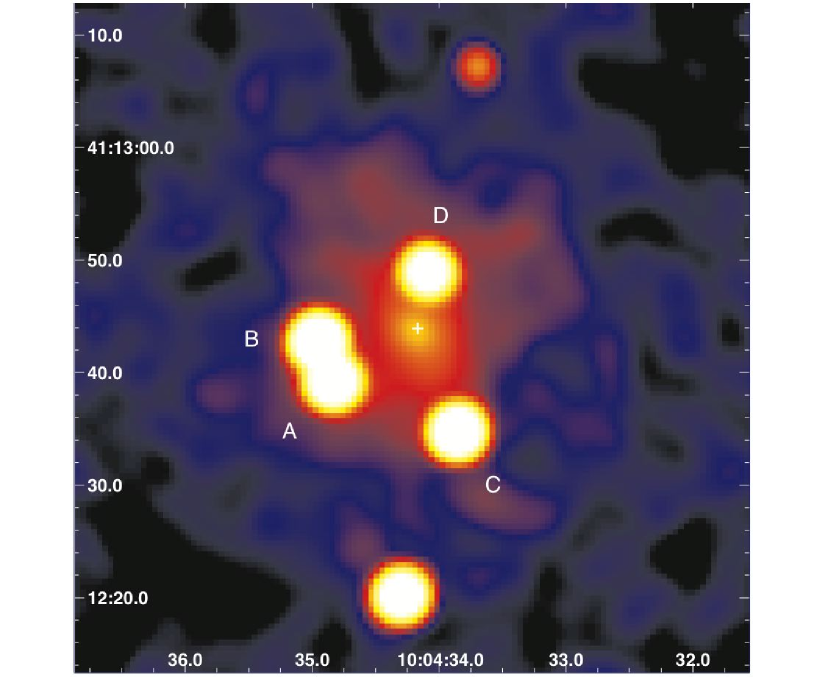
The full band (0.5–7 keV) ACIS image is shown in Figure 1. The four images of SDSS J1004+4112 are clearly detected and resolved. We found astrometry offsets for the Chandra data, (RA, Dec)=(, ), from a comparison of three sources that lie within from the aimpoint with those identified by the SDSS survey. After correcting for the mean offsets, the measured coordinates of the four X-ray quasar images are consistent with those obtained with Subaru (Oguri et al., 2004) within . In addition, extended emission, roughly centered on the quasar images and extending out to , is seen in the X-ray data. This component should arise from hot gas in the lensing cluster. The relative offsets of the coordinates of image A and the peak of the diffuse emission are (RA, Dec)(, ); the location of the peak of the extended emission is consistent with the position of the brightest cluster galaxy G1.
In the ACIS-S3 field, 39 point-like sources including the four quasar images were detected with the wavdetect algorithm with a significance threshold parameter of . The bright source at (10:04:34.262, +41:12:20.33) with an X-ray flux of (0.5–7 keV) has been observed serendipitously as part of the follow-up program to spectroscopically monitor components A and B at APO (Richards et al. 2004); a low S/N spectrum indicates a redshift of , which is marginally consistent with the second most likely photometric redshift ( with 26% confidence). The power-law slope, , connecting the rest frame 2500Å and 2 keV flux densities, is , which is roughly consistent with the -UV luminosity relation of AGNs (Strateva et al., 2005; Steffen et al., 2006). The source at (10:04:33.653, +41:13:07.24) has an X-ray counting rate of , and it is not a counter lens image of the southern bright source as the separation angle is too large.
3. Lensing Cluster
3.1. Spectral Analysis
We derive the spectrum of the cluster component by extracting the data from the circular region within a radius of that is centered on the position of the galaxy G1. The fluxes from the four quasar images and several additional point sources were removed from the spectral integration area by excluding all regions within a radius 10 times the size of the point spread function (PSF) at the source positions. Here the size of PSF is defined as the 40% encircled-energy radius at 1.5 keV at the source position. The background was estimated from the data in a surrounding annulus (). The source and background counts within are and respectively. The 0.5–7 keV extracted spectrum is fitted with the MEKAL thin-thermal plasma model (Mewe et al., 1985, 1986; Kaastra, 1992; Liedahl et al., 1995) utilizing the XSPEC version 11. In this exercise, the Galactic hydrogen column density is fixed to (Dickey & Lockman, 1990). The X-ray temperature is constrained to be keV and the metal abundance to be (the 90% upper limit is ). The Galactic absorption-corrected, 0.5–7 keV flux is (). The bolometric X-ray luminosity within is estimated as , where is defined as the radius within which the average matter density is equal to times the critical density of the Universe at the cluster redshift. The -model analysis in § 3.2 yields Mpc. This luminosity is lower than the mean value expected from the luminosity-temperature relation of distant clusters, (Ota et al., 2006), but our estimated value is within the observed scatter of the data. The reduced chi-square of the best-fit model is .
To investigate the radial temperature profile, we further analyzed spectra integrated from the inner region and the outer region of the lensing cluster. The fitted temperatures are keV and keV, respectively. These results suggest that there is not a strong temperature drop towards the cluster center, indicating radiative cooling is not important in this cluster.
3.2. X-ray Surface Brightness Profile
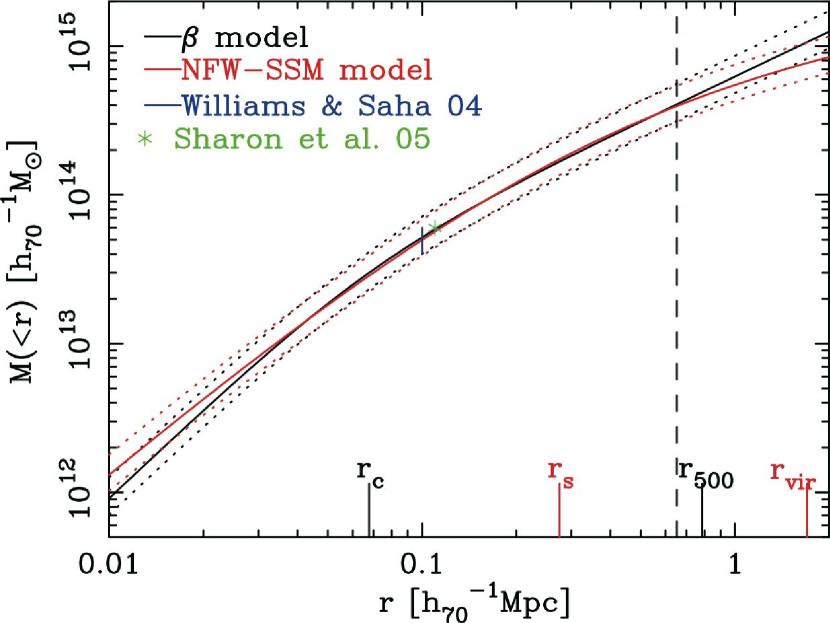
The one-dimensional radial surface-brightness profile of the extended X-ray emission was constructed by adopting a center at G1 and azimuthally averaging the 0.5–5 keV image, which was corrected for the telescope’s vignetting and the detector responses and rebinned by a factor of two (i.e., 1 processed image pixel is ). As shown in Figure 2, the radial profile was fit with the following two models: (1) the conventional -model , and (2) the profile derived from the universal mass profile proposed by Navarro et al. (1997) plus isothermality of the cluster (Suto et al., 1998, hereafter NFW-SSM). The background was set to a constant in the fitting. We find that both models can fit the observed radial profile reasonably well: The reduced chi-square is and for the -model and NFW-SSM model, respectively. The fitted values of the -model parameters are and kpc), while the NFW-SSM model results in and kpc). The profile of the intra-cluster medium (ICM) has a compact core, typical of observed surface brightness profiles of relaxed clusters.
The fit shows excess flux in the measurements compared to the models within kpc (Figure 2). This is often seen in central regions of relaxed clusters (e.g., Mohr, Mathiesen & Evrard, 1999). The central emission is significantly extended compared with the PSF. The 3- upper limit on a point-source luminosity is (0.5–5 keV) assuming a power-law spectrum with index and a source redshift of . The excess luminosity within is estimated as (0.3–8 keV), which is higher than for a typical elliptical galaxy and rather comparable to that of a cD galaxy in nearby clusters (e.g., Matsushita et al., 2000; O’Sullivan et al., 2001). Note that we subtracted the best-fit -model component from the total emission assuming the MEKAL model with keV and for the cluster spectrum. The -band luminosity of the galaxy G1 is from the magnitude of 22.11 (Inada et al., 2003) and the color-transformation law for elliptical galaxies (Fukugita et al., 1995). The above values may follow the relation for elliptical galaxies (e.g., O’Sullivan et al., 2001) and the excess flux may be attributed to hot ISM emission from the central galaxy. However, the X-ray temperature inferred from the hardness ratio is keV assuming a MEKAL model. This is marginally high for a typical elliptical galaxy. Thus we might be looking at a superposition of the galaxy component and central emission from the cluster. Given the present photon statistics, however, it is not possible to constrain further the origin of the emission. Note that the total X-ray luminosity of unresolved low-mass X-ray binaries is expected to be of the order (e.g., Kim & Fabbiano, 2004) and contributes only % to the excess luminosity. X-ray emission from the central fifth image (Inada et al., 2005) is unlikely: the contribution is estimated to be only counts (i.e., about % of the central emission) assuming that the X-ray emission from the fifth image has similar intensity ratios as those measured in the HST ACS image. The observed profile may be better fitted by introducing the two-component -models or increasing the inner slope parameter in the NFW-SSM model; however, we will not pursue this process further since the above two models already provided acceptable fits to the data. A considerably deeper observation is needed to constrain further the gas profile in the innermost region.
From the image analysis, the extent of the X-ray emission above the 3- background level is found to be (Figure 2), which is close to an overdensity radius of Mpc.
3.3. Cluster Mass Distribution
Under the assumption of hydrostatic equilibrium, we can infer the mass distribution of the lensing cluster from the X-ray temperature and surface-brightness profiles. Because there is not a significant radial dependence of the X-ray temperature in the observations, we assume isothermality of the gas in the mass estimation. Figure 3 shows the cylindrical cluster mass projected within a radius derived from each surface mass distribution profile. We find that both models yield consistent mass profiles within the measurement errors.
It is interesting to compare the mass derived from X-ray analysis with that from gravitational lensing. Williams & Saha (2004) derived the cylindrical mass to be , and Sharon et al. (2005) estimated . From Figure 3, it is clear that both mass estimations are in excellent agreement with the mass profile from the X-ray observation. For instance, we find the cylindrical masses within 100 kpc for the -model and NFW-SSM model are and , respectively. The discrepancy between X-ray and lensing masses has been reported in many lensing clusters (e.g., Hattori et al., 1999), and is often ascribed to the projection of the extra matter along line-of-sight, the elongation of the lensing cluster along the line-of-sight direction, or a departure from equilibrium. The excellent agreement between X-ray and lensing masses implies that none of these effects is significant for SDSS J1004+4112.
For the NFW-SSM model and (Nakamura & Suto, 1997), the virial mass and the concentration parameter are constrained to be and . The value of the concentration parameter is slightly larger than the theoretically expected median value for this virial mass and redshift, (Bullock et al., 2001), but is within 2- scatter among different clusters.
4. Quasar Images
4.1. Anomalous Flux Ratios
The observed source counts for the four images, A–D, are 1237, 1580, 1312, and 763, in the 0.5–7 keV band, respectively. Light curves were produced with time resolutions of 2048 or 4096 sec. We did not find any clear sign of time variability within the statistical uncertainties. Note that each component was extracted using a circular region with a radius of in the analysis presented in this section. The sum of the background and contamination from the cluster emission are estimated to be only % of the source counts for A–C, and % for D, and are negligibly small compared to the statistical errors of the source spectra.
We measure the energy fluxes of lensed images in the Chandra data by fitting each spectrum with a power-law plus Gaussian line model (see the next subsection for details). The results are summarized in Table 1. The X-ray flux ratios differ significantly from those measured in the optical (Inada et al., 2005). Since for fold lenses such as SDSS J1004+4112, the two images near the critical curve are usually brighter than the other two images and since the optical flux ratios were reproduced with simple mass models (Oguri et al., 2004), we believe that the X-ray, rather than the optical, ratios are “anomalous”. The optical/X-ray flux ratios of images C and D are almost the same, therefore the most natural interpretation is that the image A is demagnified by a factor of in X-rays. This interpretation is consistent with the observation that image A appears to be a saddle-point image (Oguri et al., 2004; Williams & Saha, 2004) which is more likely to be demagnified by perturbations than the other images (Schechter & Wambsganss, 2002). While the optical data compared in Table 1 were taken on 2004 April 28 (Inada et al., 2005), the demagnification of image A in X-rays is further supported by optical observations on 2004 November 27 and 2005 April 26 with the MAGNUM telescope (Yoshii, 2002). By linearly interpolating these two -band imaging observations, we infer optical flux ratios on 2005 January 1 to be B/A=0.69, C/A=0.40, and D/A=0.29, which are not very different from those listed in Table 1.
In Table 1, we also show the values of to check the consistency of the X-ray and optical fluxes. The values are somewhat higher than the that is expected from the UV luminosity of SDSS J1004+4112, (assuming a magnification factor of for image A; Oguri et al., 2004) and the best-fit -UV luminosity relation (Steffen et al., 2006). From Table 5 of Steffen et al. (2006), is and for and , respectively. Thus the derived is within the 1- (2-) scatter for A (B–D).
4.2. X-ray Spectrum
The spectrum of the lensed quasar component is displayed in Figure 4. To enhance the signal-to-noise ratio, the total spectrum (sum of the images A, B, C, and D) is plotted. We fit the spectrum with a power-law model. Again, the Galactic hydrogen column density is fixed to since we did not find significant intrinsic absorption. This model is rejected at the 90% confidence level (). We plot the residual of the data against the best-fit model in Figure 2a, which shows excesses in adjacent bins around 2.3 keV in our frame. Then we mask these bins and those to either side (9 bins from 2.26–2.66 keV) and fit a power-law model. The chi-square becomes significantly smaller (). The above results suggest the presence of an emission line component at keV. We then fit the spectrum with a power-law plus Gaussian line profile model (see Figure 4b). In comparison to just a power-law model, the fit was improved at the % confidence level according to the -test ( for three additional parameters). The fitting yields the power-law index , the centroid energy of the line keV, and the Gaussian width of the line eV. The line centroid is consistent with the neutral iron K line at 6.4 keV in the quasar rest frame and the derived suggests that the line is intrinsically broad. From the result, we can compute the equivalent width eV in the quasar rest frame. The luminosity is in the 2–10 keV band. In the case of for the image A, though the lens models that are consistent with the data allow a wide range of (Oguri et al., 2004), the intrinsic quasar luminosity is estimated to be (2–10 keV). This is within the luminosity range of Seyfert galaxies (e.g., Green et al., 1992). The reduced chi-square of the best fit model is .
There is a well-known negative correlation between the strength of the iron line and the X-ray luminosity in quasars (e.g., Nandra et al., 1997). The derived equivalent width is larger by a factor of than that expected from the relation of Nandra et al. (1997) and a factor of than that from recent XMM-Newton observations (Page et al., 2004; Jiménez-Bailón et al., 2005). Combined with the result in §4.1, we speculate that microlensing demagnifies the X-ray continuum of image A, while keeping (or amplifying) the Fe K line. Moreover, microlensing of emission lines in the optical band has been detected for this lens system (Richards et al., 2004), providing additional evidence for the microlensing hypothesis. The relative enhancement of Fe K line has often been observed in the X-ray emission of lensed quasars (Oshima et al., 2001; Chartas et al., 2002, 2004; Dai et al., 2003), and interpreted in terms of microlensing. Indeed, the relative enhancement of Fe K line can be reproduced if the emission is separated in two regions (e.g., Popovic et al., 2006).
The origin of the strong Fe K line is further explored by analyzing the spectrum of each image, rather than the sum of all images. To measure the line intensities, we fit them with the power-law plus Gaussian model. The centroid energy and the width of the line as well as the power-law index are allowed to vary in the fit. The best-fit parameters and the 90% errors are listed in Table 2. We found that the spectral parameters for the four images agree with each other at the 95% confidence level, although the parameters, particularly the line width, show large uncertainties. The fitting results are also statistically consistent with those derived for the total spectrum. We then performed spectral fitting with , and fixed to the best-fit values for the total spectrum (Figure 5) and calculated the equivalent widths (Table 1). Although the errors are very large, the Fe K line is detected most significantly for image A, supporting the interpretation above. We also find that the hardness ratios of the images are marginally consistent with each other (see Table 1).
Green (2006) recently proposed that spectral differences between lensed quasar image components are due to small line-of-sight differences through quasar disk wind outflows. In particular, the author suggested that SDSS J1004+4112 components B-D suffer from absorption in a disk-wind outflow and that the blue enhancements in SDSS J1004+4112 A (Richards et al., 2004) could be due to the alleviation of absorption along that sightline. Indeed, the A-B diffference spectrum from Keck/LRIS spectroscopy of C IV region (Oguri et al., 2004) resembles that of the troughs seen in a broad absorption line (BAL) quasar. However, the observed line profiles and transitions involved (e.g., He II) mean that these features more plausibly result from excess emission in component A rather than absorption in component B. In addition, quasars with intrinsic UV absorption (e.g., BAL troughs) are generally X-ray faint due to a large intrinsic X-ray absorption (;e.g., Brandt et al., 2000; Green et al., 2001; Gallagher et al., 2002, 2006), however, intrinsic absorption was not significantly detected in the X-ray spectra of the four images; the 90% upper limit on the column density is obtained to be , and for A–D, respectively. Here we assumed neutral absorbing material at . In the case that the absorber is highly ionized and has high velocity flow, as proposed by Green (2006), X-ray spectra with considerably better statistics are required to test the model. Moreover, if the differential absorption is responsible for the different X-ray spectra of A and B, we expect (and Green (2006) predicts) that the image A should be less absorbed in the X-ray. Instead, however, component A has the smallest X-ray to optical flux ratio and the X-ray flux ratio is (the 1- error; see Table 1). Thus, given multiple independent indications, we conclude that the microlensing phenomenon is the most natural interpretation for the present data.
5. Summary
We have presented results from Chandra observations of SDSS J1004+4112, a large-separation gravitational lens system created by a cluster of galaxies. We have detected X-ray emission from the lensing cluster as well as four lensed quasar images.
From the cluster X-ray emission, we have constrained the bolometric luminosity and the temperature to be and keV, consistent with the luminosity-temperature relation of distant clusters. We have reconstructed the mass profile of the lensing cluster assuming isothermality and hydrostatic equilibrium, and found that the mass within 100 kpc excellently agrees with that expected from strong lensing.
X-ray emission from the lensed quasar images displays two anomalies: the presence of a strong Fe K line and significant differences in the flux ratios from those found in the optical band. Both of these features are suggestive of microlensing. The idea is supported by the fact that image A, which appears most anomalous, is a saddle-point image.
References
- Becker et al. (1995) Becker, R. H., White, R. L., & Helfand, D. J. 1995, ApJ, 450, 559
- Blackburne et al. (2006) Blackburne, J. A., Pooley, D., & Rappaport, S. 2006, ApJ, 640, 569
- Brandt et al. (2000) Brandt, W. N., Laor, A., & Wills, B. J. 2000, ApJ, 528, 637
- Bullock et al. (2001) Bullock, J. S., Kolatt, T. S., Sigad, Y., Somerville, R. S., Kravtsov, A. V., Klypin, A. A., Primack, J. R., & Dekel, A. 2001, MNRAS, 321, 559
- Chartas et al. (2002) Chartas, G., Agol, E., Eracleous, M., Garmire, G., Bautz, M. W., & Morgan, N. D. 2002, ApJ, 568, 509
- Chartas et al. (2004) Chartas, G., Eracleous, M., Agol, E., & Gallagher, S. C. 2004, ApJ, 606, 78
- Dai et al. (2003) Dai, X., Chartas, G., Agol, E., Bautz, M. W., & Garmire, G. P. 2003, ApJ, 589, 100
- Dickey & Lockman (1990) Dickey, J. M., & Lockman, F. J. 1990, ARA&A, 28, 215
- Fukugita et al. (1995) Fukugita, M., Shimasaku, K., & Ichikawa, T. 1995, PASP, 107, 945
- Gallagher et al. (2002) Gallagher, S. C., Brandt, W. N., Chartas, G., & Garmire, G. P. 2002, ApJ, 567, 37
- Gallagher et al. (2006) Gallagher, S. C., Brandt, W. N., Chartas, G., Priddey, R., Garmire, G. P., & Sambruna, R. M. 2006, ApJ, accepted (astro-ph/0602550)
- Garmire et al. (2003) Garmire, G.P., Bautz, M.W., Ford, P.G., Nousek, J.A., & Ricker, G.R. 2003, Proc.SPIE, 4851, 28
- Green et al. (1992) Green, P. J., Anderson, S. F., & Ward, M. J. 1992, MNRAS, 254, 30
- Green et al. (2001) Green, P. J., Aldcroft, T. L., Mathur, S., Wilkes, B. J., & Elvis, M. 2001, ApJ, 558, 109
- Green (2006) Green, P. J. 2006, ApJ, accepted (astro-ph/0603033)
- Hattori et al. (1999) Hattori, M., Kneib, J., & Makino, N. 1999, Progress of Theoretical Physics Supplement, 133, 1
- Inada et al. (2003) Inada, N., et al. 2003, Nature, 426, 810
- Inada et al. (2005) Inada, N., et al. 2005, PASJ, 57, L7
- Jiménez-Bailón et al. (2005) Jiménez-Bailón, E., Piconcelli, E., Guainazzi, M., Schartel, N., Rodríguez-Pascual, P. M., & Santos-Lleó, M. 2005, A&A, 435, 449
- Kaastra (1992) Kaastra, J.S. 1992, An X-Ray Spectral Code for Optically Thin Plasmas
- Kim & Fabbiano (2004) Kim, D.-W., & Fabbiano, G. 2004, ApJ, 611, 846
- Liedahl et al. (1995) Liedahl, D.A., Osterheld, A.L., and Goldstein, W.H. 1995, ApJ, 438, L115
- Matsushita et al. (2000) Matsushita, K., Ohashi, T., & Makishima, K. 2000, PASJ, 52, 685
- Mewe et al. (1985) Mewe, R., Gronenschild, E.H.B.M., and van den Oord, G.H.J. 1985, A&AS, 62, 197
- Mewe et al. (1986) Mewe, R., Lemen, J.R., & van den Oord, G.H.J. 1986, A&AS, 65, 511
- Mohr, Mathiesen & Evrard (1999) Mohr, J. J., Mathiesen, B., & Evrard, A. E. 1999, ApJ, 517, 627
- Nakamura & Suto (1997) Nakamura, T. T., & Suto, Y. 1997, Prog. Theor. Phys., 97, 49
- Nandra et al. (1997) Nandra, K., George, I. M., Mushotzky, R. F., Turner, T. J., & Yaqoob, T. 1997, ApJ, 488, L91
- Navarro et al. (1997) Navarro, J. F., Frenk, C. S., & White, S. D. M. 1997, ApJ, 490, 493
- Oguri et al. (2004) Oguri, M., et al. 2004, ApJ, 605, 78
- Oshima et al. (2001) Oshima, T., et al. 2001, ApJ, 563, L103
- O’Sullivan et al. (2001) O’Sullivan, E., Forbes, D. A., & Ponman, T. J. 2001, MNRAS, 328, 461
- Ota et al. (2006) Ota, N., Kitayama, T., Masai, K., & Mitsuda, K. 2006, ApJ, 640, 673
- Page et al. (2004) Page, K. L., O’Brien, P. T., Reeves, J. N., & Turner, M. J. L. 2004, MNRAS, 347, 316
- Popovic et al. (2006) Popovic, L. C., Jovanovic, P., Mediavilla, E., Zakharov, A. F., Abajas, C., Muñoz, J. A., & Chartas, G. 2006, ApJ, 637, 620
- Richards et al. (2004) Richards, G. T., et al. 2004, ApJ, 610, 679
- Schechter & Wambsganss (2002) Schechter, P. L., & Wambsganss, J. 2002, ApJ, 580, 685
- Sharon et al. (2005) Sharon, K., et al. 2005, ApJ, 629, L73
- Spergel et al. (2003) Spergel, D.N., et al. 2003, ApJS, 148, 1
- Steffen et al. (2006) Steffen, A. T., Strateva, I., Brandt, W. N., Alexander, D. M., Koekemoer, A. M., Lehmer, B. D., Schneider, D. P., & Vignali, C. 2006, AJ, accepted
- Strateva et al. (2005) Strateva, I. V., Brandt, W. N., Schneider, D. P., Vanden Berk, D. G., & Vignali, C. 2005, AJ, 130, 387
- Suto et al. (1998) Suto, Y., Sasaki, S., & Makino, N. 1998, ApJ, 509, 544
- Williams & Saha (2004) Williams, L. L. R., & Saha, P. 2004, AJ, 128, 2631
- Yoshii (2002) Yoshii, Y. 2002, in New Trends in Theoretical and Observational Cosmology, ed. K. Sato & T. Shiromizu (Tokyo: Universal Academy), 235
- York et al. (2000) York, D.G., et al. 2000, AJ, 120, 1579
| Name | aaAbsorption-corrected, 0.5–7 keV X-ray flux in units of and the 1- error. | hardnessbbHardness ratios defined by the count rate ratios in keV and keV bands. Errors indicate 68% confidence limits. | ccFlux normalized by the flux of image A in the HST F814W image (Inada et al., 2005). Measurement errors are negligibly small. | EW [eV]ddEquivalent width of the Fe K line in the quasar rest frame. | ||
|---|---|---|---|---|---|---|
| A | 1.00 | 1.00 | ||||
| B | 0.73 | 0.58 | ||||
| C | 0.35 | 0.33 | ||||
| D | 0.21 | 0.35 |
| Name | aaPower-law index. | [keV]bbCentroid energy in the quasar rest frame. | [keV]ccLine width in the quasar rest frame. | EW [eV]ddEquivalent width of the Fe K line in the quasar rest frame. | ||
|---|---|---|---|---|---|---|
| A | 18.5 | |||||
| B | 9.6 | |||||
| C | 14.9 | |||||
| D | 7.3 | |||||
| A+B+C+D | 35.9 |