The COMPLETE Nature of the Warm Dust Shell in Perseus
Abstract
The Perseus molecular cloud complex is a 30 pc long chain of molecular clouds most well-known for the two star-forming clusters NGC 1333 and IC 348 and the well-studied outflow source in B5. However, when studied at mid- to far-infrared wavelengths the region is dominated by a 10 pc diameter shell of warm dust, likely generated by an Hii region caused by the early B-star HD 278942. Using a revised calibration technique the COMPLETE team has produced high-sensitivity temperature and column-density maps of the Perseus region from IRAS Sky Survey Atlas (ISSA) 60 and 100 m data. In this paper, we combine the ISSA based dust-emission maps with other observations collected as part of the COMPLETE111CoOrdinated Molecular Probe Line, Extinction and Thermal Emission; http://cfa-www.harvard.edu/COMPLETE Survey, along with archival H and MSX observations. Molecular line observations from FCRAO and extinction maps constructed by applying the NICER method to the 2MASS catalog provide independent estimates of the “true” column-density of the shell. H emission in the region of the shell confirms that it is most likely an Hii region located behind the cloud complex, and 8 m data from MSX indicates that the shell may be interacting with the cloud. Finally, the two polarisation components seen towards background stars in the region by Goodman et al. (1990) can be explained by the association of the stronger component with the shell. If confirmed, this would be the first observation of a parsec-scale swept-up magnetic field.
1 Introduction
The interaction of newly formed stars with their parent cloud, particularly in the case of massive stars, can have significant consequences for the subsequent development of the cloud. Hot, massive stars will cause cloud disruption through their ionizing flux as well as through the momentum in their stellar winds. Alternatively, given the right conditions in the cloud, stellar winds may also trigger the collapse of cloud cores and induce further star formation.
One region where a stellar wind may be triggering star formation is the Perseus Molecular Cloud complex, a well-studied chain of molecular clouds, extending approximately 30 pc in length. The complex has a total mass of 1.3104 M⊙, assuming it is at a distance of 260 pc (although actual distance estimates range from 230 pc (Černis, 1990) to 350 pc (Herbig & Jones, 1983), and it is clear from the large ( 10 km s-1) velocity range of molecular gas that a single distance to the entire complex is unlikely). Star formation is ongoing in several parts of the complex, most obviously around the two reflection nebulae IC 348 (catalog ) and NGC 1333 (catalog ). Several surveys (e.g. Ladd et al., 1993; Aspin et al., 1994; Lada & Lada, 1995; Luhman et al., 2003) have established that there is a population of pre-main sequence stars located both within the clusters and throughout the complex, but relatively few high-mass stars have been found.
The Perseus complex is not just interesting for its star-forming properties. An almost complete shell of enhanced emission can be seen in IRAS data toward the center of the molecular cloud complex (figure 1). The shell, referred to in previous papers as G 159.618.5, (catalog ) has a diameter of 0.75∘, or 10 pc at the distance of the molecular cloud. Although its existence has been known for about 15 years (it was first described by Pauls & Schwartz (1989) in a conference proceedings and further discussed by Fiedler et al. (1994)) there has been little investigation into the nature or source of the shell, and it has been mostly ignored by studies of star-formation in the region. Based on radio data, Fiedler et al. argued that the feature is caused by a supernova remnant, which if true, would be one of the closest to the Sun, and have the highest known Galactic latitude for such an object. More recently de Zeeuw et al. (1999) associated the shell with the B star HD 278942, located at its geometric center. Andersson et al. (2000) performed a multi-wavelength study of the star and its surroundings. They reclassified HD 278942 as an O9.5-B0 V star with an age of 8 Myr, and found weak radio continuum emission with a flat spectral index, consistent with an optically thin Hii region filling the shell. However, partly due to the lack of short-spacing information in their interferometer maps leading to large uncertainties on the derived radio-continuum fluxes, they could not rule out a negative spectral index, leaving the possibility that the radio continuum is due to synchrotron emission from the interaction between a stellar wind or supernova remnant and the molecular cloud. Andersson et al.’s other observations concentrated on the central star HD 278942, and hence provide little insight into the nature of shell itself.
The Perseus molecular cloud complex is a target of the Spitzer Space Telescope (SST) Legacy program “From Molecular Cores to Planet Forming Disks” (hereafter c2d; Evans et al., 2003), while the two clusters NGC 1333 and IC 348 are included in an SST Guaranteed Time Observer (GTO) program. These programs aim to determine the distribution of young stars and clusters, and investigate their association with known dense cores. The ongoing COMPLETE Survey (Ridge et al., 2006), is a large international effort which has coordinated its observations with c2d. COMPLETE aims to obtain and compare high quality molecular line, submillimeter continuum, far-infrared column-density and near-infrared extinction data over the extents of three of the star-forming molecular clouds targeted by c2d, including the whole of Perseus.
As part of COMPLETE, we have recently used 60 and 100 m IRAS maps of the Perseus region to create new high-sensitivity temperature and column-density maps (Schnee et al., 2005). Here we intercompare the recalibrated far-IR results with COMPLETE near-infrared extinction and 13CO maps of the same region (Ridge et al., 2006), an H image from the VTSS222Virginia Tech Spectral Line Survey; http://www.phys.vt.edu/ halpha/ Survey, and the MSX 8 m image. A detailed picture of the shell which, would not be possible by looking at each data set alone emerges and suggests a complex picture of Perseus as a group of cold molecular clouds being impacted gently from behind by a stellar wind bubble.
2 Data and Analysis
2.1 IRAS Temperature and Column-Density Maps
Figure 1 shows maps of colour temperature and column-density in Perseus from Schnee et al. (2005). These were constructed from recalibrated 60 and 100 m IRIS333Improved Recalibration of the IRAS Survey images (Miville-Deschênes & Lagache, 2005). These data provide excellent correction for the effects of zodiacal dust and striping in the IRAS images and improved gain, offset and zero-point calibration over earlier releases of the IRAS data (Schnee et al., 2005). Near-infrared extinction maps (see section 2.2) were used to constrain the conversion factor between 100m optical depth and visual extinction (column density), as using the “standard” values for this conversion (e.g. Wood et al., 1994) results in a significant miscalculation of the extinction (Schnee et al., 2005). Hence these maps provide the best dust-temperature and extinction maps constructed from IRAS data to date.
The positions of the well-known star-forming clusters NGC 1333 and IC 348 are indicated in figure 1. The shell is clearly seen as an enhancement in column density, and is filled with warm material, evident in the temperature map. Although on careful inspection, the known dark cores in Perseus are visible in the map, the general morphology (dominated by the shell) is very different from extinction or molecular line maps of the region which are dominated by the chain of clouds (see sections 2.2 and 2.3).
2.2 Extinction from Near-Infrared Colour Excess
As part of COMPLETE, we have constructed a map of the extinction towards Perseus with comparable resolution (5′) to the 4.7′ IRAS-based maps, by applying the NICER444Near-Infrared Colour Excess Revisited. algorithm (Lombardi & Alves, 2001) to data from the Two Micron All-Sky Survey (2MASS; Ridge et al., 2006). This method uses the near-infrared colour excess of background stars to determine reddening along a line of sight, and hence does not rely on assumptions about grain size distribution or emissivity. The extinction determined in this way should therefore provide the best measure of the true column density distribution of material (Goodman, Ridge, & Schnee, 2005).The 2MASS/NICER extinction map is shown in figure 2. Here the more familiar view of Perseus, as a chain of molecular clouds, from B5 (catalog ) in the northeast, through IC348, B1 and NGC1333 in the southwest are clearly visible. Again the position of HD278942 is indicated by a cross, and although faint, the northern half of the shell, centered on the star, can be made out in the image.
2.3 Molecular line Emission from 13CO
A map of 13CO integrated intensity (representing gas column density) with 44′′ resolution, obtained for COMPLETE at the Five College Radio Astronomy Observatory (FCRAO) 14m Telescope, is shown in figure 3. A full description of the data acquisition and reduction methods is given in Ridge et al. (2006).
Although not as extensive as the IRAS and 2MASS/NICER images, the higer resolution555Figure reproductions presented here do not aloow for the reader to see the full detail of the map – higher resolution versions and the raw data are available at http://cfa-www.harvard.edu/COMPLETE of this map reveals significant substructure when compared to those images. Like the 2MASS/NICER extinction map, the 13CO integrated intensity shows the familiar chain of molecular clouds, with no hint of the existence of the warm dust shell so clear in the IRAS-based image.
2.4 H image from VTSS
Figure 4 shows a 3∘3∘ H image centered on =03h39m571, =+31∘55m15s obtained via Skyview from the VTSS, overlaid with contours of IRAS column-density. The image has a resolution of 6′.
There is clearly ionised gas filling the shell, indicating that it is likely to be an H region or stellar wind. The H emission displays three distinct peaks, the brightest to the northeast. The substructure in the H emission, in particular tha apparent lack of emission to the southeast, will be discussed in section 3.2.
2.5 Mid-infrared observations from MSX
The shell was the subject of a pointed observation by the Midcourse Space Experiment (MSX) satellite, which provided images at four mid-infrared wavebands. The shell was clearly detected at 8.3m(as shown in figure 5) and 12.1 m (Kraemer et al., 2003). It was not detected in the 14.7 and 21 m bands, but this is most likely due to the lower sensitivity of those bands, as it is clearly present in the 12 and 25 m bands of IRAS and has been seen by both the IRAC and MIPs instruments on the Spitzer Space telescope (K. Stapelfeldt, J. Jorgensen, personal communication). The higher resolution of the 8m MSX observations compared to IRAS reveals complex filamentary structures within the shell (Kraemer et al., 2003). In particular, there are 3 bright knots of 8m emission, labelled A, B and C in figure 5, which also correspond to enhancements in the extinction at those positions.
3 Discussion
3.1 Could HD 278942 be the driving source of the shell?
The fact that the shell is visible in the 2MASS extinction map and is filled with preferentially heated dust emission tells us that it is a bubble of heated material, enclosed in a colder shell of increased density (visible only on the edges). Based on multiwavelength data, Andersson et al. (2000) suggested that the shell was the result of an expanding stellar wind from HD 278942. This is supported by the fact that the shell is filled with H emission, as is shown in figure 4.
Historically, the combined effects of the shell and the high reddening towards HD 278942 (AV = 7.4 mag; Andersson et al. 2000) has made spectral classification of the star problematic, with values in the literature ranging from F2 (Hipparcos) through B3 III (Černis, 1993) to O9.5B0 V (Andersson et al., 2000). The situation is further complicated by the possibility that HD 278942 may be a photometric B3 III + F5 I binary (Černis, 1993). Recent spectra obtained by Steenbrugge et al. (2003) confirm that HD 278942 is most likely an early–mid B-star. Assuming a local density, nH, of 1 cm-3, such a star could produce an Hii region of several parsecs in size (Osterbrock, 1989). Given the uncertainty in the star’s spectral classification and the local density, it is therefore plausible that HD 278942 created the 10 pc diameter shell.
3.2 Evidence for Two Dust Populations in Perseus
In order to compare the properties of the shell with other regions of the cloud, we selected by eye an annular region of the IRAS column-density image which contains all of the shell emission. Figure 6 shows this region, as a hatched annulus overlaid on the IRAS column density image. In the remainder of the text we will refer to the hatched region of the annulus as the “shell component”, the circular region contained within the annulus as “inside shell” and all points in the image that are outside of the annulus as the “cloud component”. Also shown are two small grey boxes, which indicate the positions of the two young clusters NGC 1333 and IC 348 which we excluded from our analysis.
Our new IRAS calibration technique (Schnee et al., 2005) leads to temperature and column-density maps which look somewhat different to those presented in Andersson et al. (2000). They interpreted their temperature map as showing that the ring is at a temperature minimum of 24 K with the dust interior to the shell at a higher temperature. The fact that they also found the cloud material outside the shell marginally warmer than the shell itself (making the shell a temperature minimum) is probably an artifact of the way they created their temperature map.
We find an average temperature in the shell component of 28.9 K, with a maximum of 32 K. The distribution of temperatures within the shell component and cloud component are shown in figure 7. It is clear that the shell component is significantly warmer than the molecular cloud material which surrounds it. This is supported by a two-sided Kolmogorov-Smirnov (KS) test, which gives a probability of that the two samples are drawn from the same population.

In figure 8 we show a scatter plot of the colour temperature versus column-density derived from recalibrated IRAS 60 and 100 m emission (Schnee et al., 2005). Three distinct populations are seen in the emission, indicated by the green points (cloud component), red points (shell component) and blue points (inside shell). Clearly the shell and its interior are warmer and denser on average than the surrounding cloud.
The difference in density can be seen more clearly in the histograms shown in the left panel of figure 9. The cloud component has a mean extinction of 1.6ṁag., while the mean of extinction in the shell component is almost double that (3.1 mag.) Again, a two-sided KS test gives a probability of that the two populations (cloud and shell) are drawn from the same parent population.
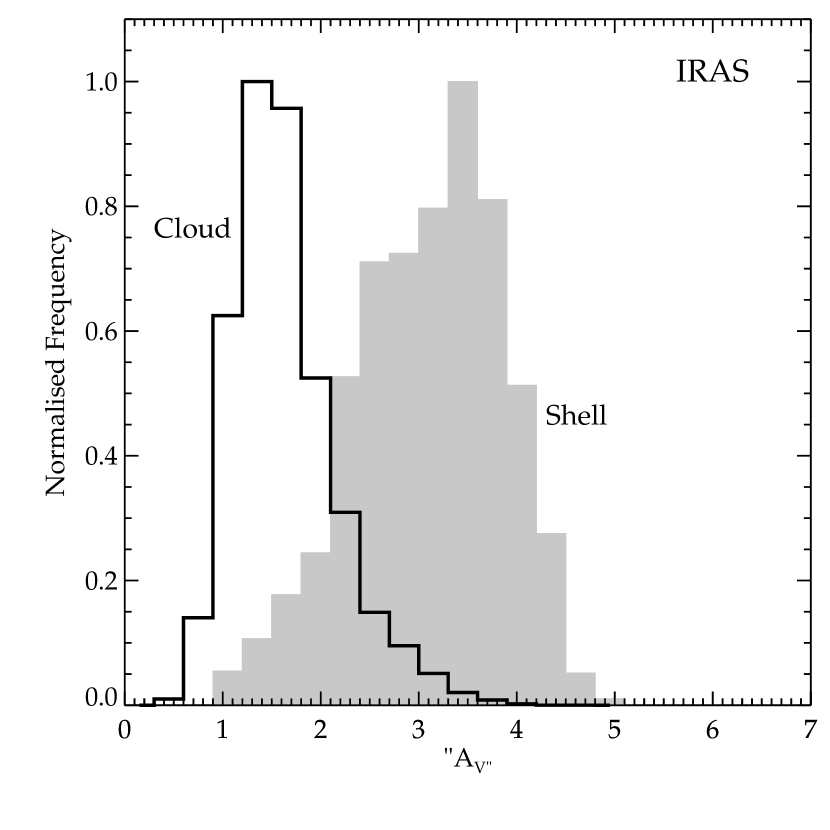
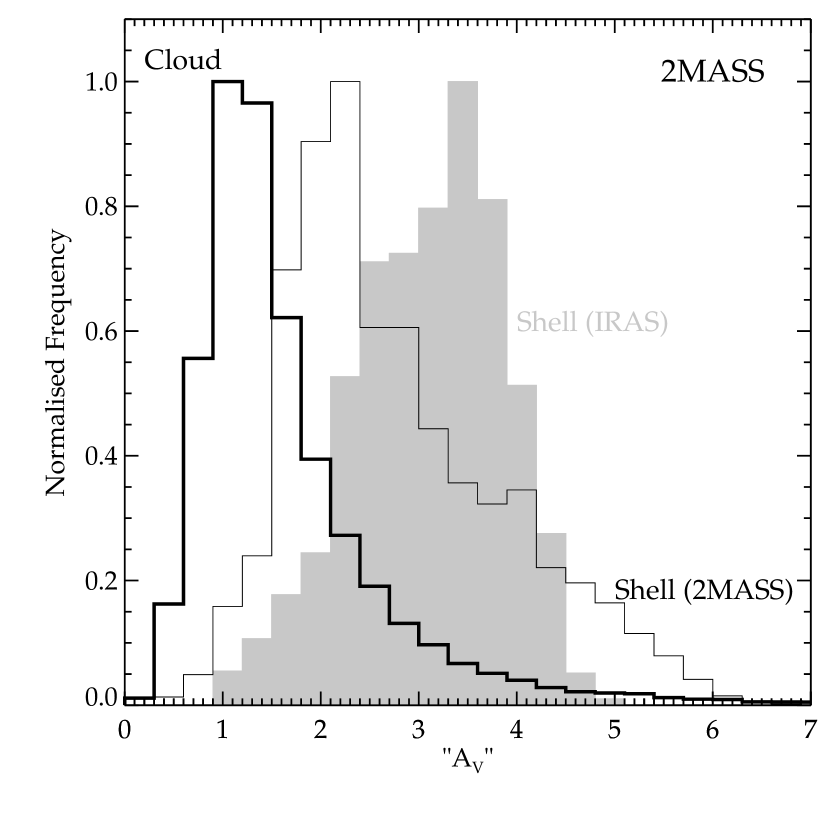
Also shown in the right panel of figure 9 is a histogram of extinction as derived from 2MASS/NICER for the shell component. If we assume that the 2MASS/NICER derived extinction is a better estimate of the “true” column-density of material towards any line-of-sight then it appears that IRAS is systematically overestimating the column-density of material in the shell.
Another way to look at this is figure 10 where we show a scatter plot of column density derived from IRAS against column density from 2MASS/NICER. A solid line in the figure shows a linear least-squares fit to the data and the dashed line indicates a 1:1 relation between the two properties. Clearly, the shell component (red points) fall preferentially above both the fitted line and the 1:1 line, again indicating IRAS seems to be overestimating the column density in the shell region.
The “shell” (red) and “cloud” (green) populations seen in figure 8 are less apparent when we make a similar plot of temperature determined from IRAS against extinction determined from 2MASS/NICER, as is done in figure 11. Although still warmer on average, the shell component does not show a significant difference in column-density when compared to the cloud component.
We interpret the “high contrast” appearance of the shell on the IRAS based column-density maps as caused by the presence of two different dust populations along the line of sight, the cool component associated with the molecular cloud complex, and a warmer component due to the shell. This type of situation was discussed in an appendix of Langer et al. (1989), who showed that the result of assuming a single dust temperature along a line of sight is an underestimate of the total optical depth (and hence column density). However, in this case we know the “true” column-density of shell material from the 2MASS/NICER map is in fact less than the column density we determine from IRAS, i.e. the line-of-sight dust distribution seems to cause an overestimate of the 100 m opacity within the shell component, as can be seen in the right panel of figure 9.
An alternative explanation is that our assumption of a uniform dust-emissivity co-efficient for all of the region is incorrect. It is possible that the grain-size distribution and/or composition of the dust in the shell may be unusual, as it has been processed by the radiation field of the massive star.
The hypothesis of two cloud populations in the direction of Perseus is not new. Ungerechts & Thaddeus (1987) suggested the possibility of two clouds along the line of sight to explain the presence of two distinct velocity components seen in their CO map of Perseus, and in several papers about photometric distances and extinctions toward field stars in the directions of IC 348, NGC 1333 and the dark cloud Barnard 1 (catalog ) (Černis, 1990, 1993; Černis & Straižys, 2003, hereafter CS), Černis and collaborators have found an apparent jump in extinction towards Perseus at a distance of 140-160 pc, placing some kind of absorbing material at this distance. They attribute this material to an extension of material from the Taurus molecular cloud complex along the line of sight to Perseus (their suggested morphology is shown in figure 9 of Černis 1993).
In a study of the optical polarization of background stars, Goodman et al. (1990, hereafter GBMM) found a bimodal distribution of polarisation angles in the Perseus region and attributed it to two separate dust distributions along the line of sight, each associated with a different magnetic field orientation. At the time, comparing only to molecular-line maps, they could detect no meaningful spatial distinction between the two polarisation components.
CS have 18 stars in common with GBMM, for 15 of which they were able to determine distances and extinctions, based on photometric spectral-typing. These 15 stars’ properties are summarised in table 1 which is reproduced in most part from CS. We have split the stars in the table into two groups, those with A5 and those with A5.
From table 1, it is clear that the stars with high polarisation percentage (bold entries in column 6 of the table) appear almost exclusively in the high extinction (0.5 mag) group, whilst stars with low polarisation percentage are more common at lower extinction. The lower extinction stars also tend to be at nearer distances. CS interpreted these results as further evidence for their 140 pc material, proposing that stars with low polarisation are located between the 140 pc material and the cloud complex, while the more distant stars show high polarisation and high extinction because they are behind two layers of absorbing material (the 140 pc material and the molecular cloud).
| (1) | (2) | (3) | (4) | (5) | (6) | (7) |
|---|---|---|---|---|---|---|
| IDaaNotation of CS | RA (J2000) | Dec (J2000) | R | AV | PbbEntries shown in bold face have polarisation percentage 1%. | |
| hh:mm:ss | dd:mm.m | pc | mag | % | deg | |
| Stars With A0.7 | ||||||
| 30 | 03:33:04 | 30:34.5 | 268 | 0.21 | 0.51 | 87 |
| 40 | 03:33:55 | 31:10.0 | 310 | 0.29 | 1.24 | 72 |
| 51 | 03:33:41 | 31:07.9 | 195 | 0.37 | 0.42 | 80 |
| 71 | 03:35:41 | 30:55.7 | 254 | 0.17 | 0.66 | 74 |
| 72 | 03:35:52 | 31:15.0 | 141 | 0.42 | 0.34 | 70 |
| 88 | 03:36:36 | 31:04.5 | 134 | 0.25 | 0.34 | 110 |
| Stars With A 0.7 | ||||||
| 15 | 03:31:54 | 30:55.8 | 700 | 2.33 | 1.14 | 17 |
| 24 | 03:32:44 | 30:30.3 | 300 | 2.99 | 0.21 | 114 |
| 31 | 03:33:10 | 30:50.3 | 860 | 2.18 | 0.43 | 143 |
| 74 | 03:35:55 | 31:33.8 | 440 | 1.38 | 1.46 | 146 |
| 92 | 03:36:42 | 31:31.1 | 1430 | 0.71 | 1.12 | 156 |
| 111 | 03:37:33 | 30:58.9 | 264 | 2.47 | 4.69 | 145 |
| 112 | 03:37:45 | 31:07.0 | 5200 | 1.24 | 5.06 | 152 |
| 124 | 03:38:24 | 31:12.0 | 245 | 3.56 | 9.14 | 150 |
| 125 | 03:38:36 | 31:56.5 | 340 | 1.66 | 1.23 | 137 |
| HD 278942 | 03:39:55 | 31:55:33.2 | 207ccHipparcos (Perryman et al., 1997). | 7.4d,ed,efootnotemark: | 5.9ddAndersson et al. (2000). | 154ddAndersson et al. (2000). |
In figure 12 we show polarization vectors from GBMM overlaid on our IRAS column-density and 13CO maps. The weaker polarisation component identified by red vectors; GBMM is clearly aligned along the major axis of the molecular cloud as stated in that paper, but on comparison with our new column-density maps it now becomes evident that much of the high polarisation-percentage component is aligned with the warm shell and associated arm to the west.
In fact, the polarisation strength (1.2%) measured for the weaker component is typical for nearby molecular clouds (e.g. Goodman et al., 1990; Bhatt et al., 2004). We therefore propose that the weaker component is due to magnetic fields within the molecular cloud material, whilst the stronger component, is due to a swept-up field associated with the shell material. This is consistent with CS’s measurements, as the distances to the low-polarisation stars (non-bold entries in column 6 of table 1) place them close to the distance of the molecular cloud complex, whilst the higher-polarisation stars (bold entries in column 6 of the table) are generally more distant than 300 pc. Andersson et al. (2000) measured a polarisation of 5.90.03% at a position angle of 154002 towards HD 278942, also consistent with its polarisation being associated with the shell in our scenario (although we note that some fraction of the polarisation is thought to be circumstellar).
Although we do not know its distance, the shell cannot be the source of CS’s proposed 140 pc material, as it must lie behind the molecular cloud complex. We know this, because in figure 13, which shows contours of extinction from 2MASS/NICER overlaid on the H image, a finger of extinction (contours), is exactly co-incident with a dark “shadow” to the southeast in the H emission. The same shadow can be seen in the 1907 photograph in Barnard’s Atlas (Barnard, 1927), against a circular shaped nebulosity which is located within the circumference of the shell. This would place the shell behind at least the eastern end of the Perseus molecular cloud complex, and therefore more distant than 26020 pc, the distance to IC 348 (Černis, 1993) which is embedded in that portion of the molecular cloud666This makes either the distance determination to HD 278942, or its association with the shell somewhat problematic, as its Hipparcos distance of 20752 pc (Perryman et al., 1997; Andersson et al., 2000) would place it on the near side of the cloud containing IC 348, while its high reddening and polarisation would suggest it is behind a significant column of dense material.. We also do not believe that the shell could be far behind the molecular cloud complex, as several of the more highly polarised stars in table 1 have distances 300 pc.
3.3 Is the shell impacting on the molecular cloud?
The final piece of the puzzle of the Perseus shell is whether or not it is interacting with the molecular cloud. In earlier sections we have argued that it is likely to be located behind, but still close to the cloud complex. The most compelling evidence for an interaction is given by a comparison of the MSX 8 m image with extinction from 2MASS as was shown in figure 5. The shell is clearly detected in 8 m emission, and in particular has three bright “knots” of emission777see also Kraemer et al. 2003 for images at all 4 MSX bands., labelled A, B and C in figure 5). An extinction of A 100 is required to make the cloud opaque at 8 m, so the bright knots are likely to be real and not just a result of varying extinction in front of the emission. In fact, the three bright knots are spatially coincident with slight enhancements in the extinction, as indicated by the contours on figure 5. Emission in the 8 m band of MSX has been modelled as a combination of grey-body dust emission and emission from the unidentified infrared bands (UIBs), usually attributed to polycyclic aromatic hydrocarbons (PAHs) excited in shocks (e.g. Ghosh & Ojha, 2002), and hence the spatial coincidence between the 8m knots and the extinction enhancements are most easily explained by a layer of swept up material in front of a shock, providing compelling evidence for an interaction. Further evidence is seen in the 13CO emission, where the spectrum at “knot C” shows a strong second component at 5 km s-1 (figure 14) well separated spatially from emission due to the molecular clouds at those velocities (figure 15). The second component is blueshifted with respect to the “ambient” molecular gas, consistent with an interaction with the front side of an expanding shell.
CO spectra in the Perseus region are extremely complex and confused, with a velocity gradient of almost 10 km s-1across the cloud and multiply peaked, optically thick lines throughout. We have attempted to make 12CO observations of the top half the shell, where contamination from the molecular clouds should be low in order to perform a more detailed kinematical analysis of the shell, but as can be seen from the 2MASS/NICER extinction data, the column density there is low, and we have been unable to detect 12CO at sufficient sensitivity to enable such an analysis.
By assuming a gas-to-dust ratio , we can calculate the mass of material in the shell from the 2MASS extinction map, using the relation presented by Dickman (1978):
| (1) |
where is the angular size of a map pixel, is the distance (300 pc), is the mean molecular weight corrected for helium abundance and cm-2mag-1 (Savage & Mathis, 1979), although this number could be higher by a factor of 2, Goodman & Heiles (see e.g. 1994). Due to the contamination from cloud emission in the lower half of the ring, we calculated the mass in the top half of the shell and scaled this by a factor of two to estimate a total mass of the material in the shell of 760 M⊙. If we assume we are seeing the limb brightened edge of a complete spherical shell then the total mass, such a shell would contain is given by:
| (2) |
where is the mass enclosed within the 2-dimensional annulus indicated in figure 6 and and are the inner and outer radius of that annulus respectively. In this case and pc (d=300 pc), leading to a total mass of the shell of 1000 M⊙. Assuming a typical B-star lifetime of 8 Myr and a radius of 4.3 pc gives a time-averaged expansion velocity of 0.5 km s-1 for the shell, and a total outward momentum of 520 M⊙ km s-1, much less than 105 M⊙ km s-1 we would estimate based on the properties of the central star (see equation 18 of Matzner 2002). This would suggest that the shell is in the process of merging with the background gas, in which case it is surprising to see such a coherent ring. This discrepancy could be explained if the shell was initally expanding more quickly into a higher density material. For instance, the same diameter could be reached in 1 Myr with an expansion velocity of 4 km s-1.
4 Summary
By combining our reanalysis of ISSA data (Schnee et al., 2005) with data from the COMPLETE Survey of Star-Forming Regions (Ridge et al., 2006) and archival H and mid-IR observations, we have made a detailed study of the warm dust shell in Perseus which was first reported by Pauls & Schwartz (1989).
-
1.
A comparison of the temperature and extinction derived from IRAS 60 and 100m emission shows two distinct dust populations in the Perseus region. The two populations are clearly spatially separated, with the warmer population being associated with the shell.
-
2.
The shell is also detected, but at much lower contrast, in an extinction map of the same region constructed by applying the NICER algorithm (Lombardi & Alves, 2001) to 2MASS (Ridge et al., 2006). This indicates that the shell is not as significant a column-density feature as one would infer from the IRAS map. It dominates the IRAS column-density map because it is warm.
-
3.
The shell is spatially coincident with, and hence may be the source of the high-polarisation component of the bimodal distribution of polarisations found in the region by Goodman et al. (1990). If this is the case, then this would be the first observation of a swept-up magnetic field on 10pc scales.
-
4.
The combination of IRAS, MSX, 2MASS/NICER and 13CO data suggests that the shell is located behind the molecular cloud containing the star-forming cluster IC 348, and there is significant circumstantial evidence that it is interacting with the cloud complex.
-
5.
We reiterate previous conclusions (Arce & Goodman, 1999a, b; Cambrésy et al., 2001; Schnee et al., 2005) that care should be taken when using IRAS to determine the extinction in the direction of complex regions such as star-forming molecular clouds, as variations in dust temperature along the line of sight can introduce substantial bias toward warm dust features.
References
- Andersson et al. (2000) Andersson, B. G., Wannier, P. G., Moriarty-Schieven, G. H., & Bakker, E. J. 2000, AJ, 119, 1325
- Arce & Goodman (1999a) Arce, H. G., & Goodman, A. A. 1999a, ApJ, 517, 264
- Arce & Goodman (1999b) —. 1999b, ApJ, 512, L135
- Aspin et al. (1994) Aspin, C., Sandell, G., & Russell, A. P. G. 1994, A&AS, 106, 165
- Barnard (1927) Barnard, E. 1927, A Photographic Atlas of Selected Regions of the Milky Way, ed. E. Frost & M. Calvert (Carnegie Institute of Washington)
- Bhatt et al. (2004) Bhatt, H. C., Maheswar, G., & Manoj, P. 2004, MNRAS, 348, 83
- Cambrésy et al. (2001) Cambrésy, L., Boulanger, F., Lagache, G., & Stepnik, B. 2001, A&A, 375, 999
- de Zeeuw et al. (1999) de Zeeuw, P. T., Hoogerwerf, R., de Bruijne, J. H. J., Brown, A. G. A., & Blaauw, A. 1999, AJ, 117, 354
- Dennison et al. (1998) Dennison, B., Simonetti, J. H., & Topasna, G. A. 1998, Publications of the Astronomical Society of Australia, 15, 147
- Dickman (1978) Dickman, R. L. 1978, AJ, 83, 363
- Evans et al. (2003) Evans, N. J., Allen, L. E., Blake, G. A., Boogert, A. C. A., Bourke, T., Harvey, P. M., Kessler, J. E., Koerner, D. W., Lee, C. W., Mundy, L. G., Myers, P. C., Padgett, D. L., Pontoppidan, K., Sargent, A. I., Stapelfeldt, K. R., van Dishoeck, E. F., Young, C. H., & Young, K. E. 2003, PASP, 115, 965
- Fiedler et al. (1994) Fiedler, R., Pauls, T., Johnston, K. J., & Dennison, B. 1994, ApJ, 430, 595
- Finkbeiner (2003) Finkbeiner, D. P. 2003, ApJS, 146, 407
- Ghosh & Ojha (2002) Ghosh, S. K., & Ojha, D. K. 2002, A&A, 388, 326
- Goodman et al. (1990) Goodman, A. A., Bastien, P., Menard, F., & Myers, P. C. 1990, ApJ, 359, 363
- Goodman & Heiles (1994) Goodman, A. A., & Heiles, C. 1994, ApJ, 424, 208
- Goodman et al. (2005) Goodman, A. A., Ridge, N. A., & Schnee, S. L. 2005, in prep.
- Herbig & Jones (1983) Herbig, G. H., & Jones, B. F. 1983, AJ, 88, 1040
- Kraemer et al. (2003) Kraemer, K. E., Shipman, R. F., Price, S. D., Mizuno, D. R., Kuchar, T., & Carey, S. J. 2003, AJ, 126, 1423
- Lada & Lada (1995) Lada, E. A., & Lada, C. J. 1995, AJ, 109, 1682
- Ladd et al. (1993) Ladd, E. F., Lada, E. A., & Myers, P. C. 1993, ApJ, 410, 168
- Langer et al. (1989) Langer, W. D., Wilson, R. W., Goldsmith, P. F., & Beichman, C. A. 1989, ApJ, 337, 355
- Lombardi & Alves (2001) Lombardi, M., & Alves, J. 2001, A&A, 377, 1023
- Luhman et al. (2003) Luhman, K. L., Stauffer, J. R., Muench, A. A., Rieke, G. H., Lada, E. A., Bouvier, J., & Lada, C. J. 2003, ApJ, 593, 1093
- Matzner (2002) Matzner, C. D. 2002, ApJ, 566, 302
- Miville-Deschênes & Lagache (2005) Miville-Deschênes, M.-A., & Lagache, G. 2005, ApJS, 157, 302
- Osterbrock (1989) Osterbrock, D. E. 1989, Astrophysics of Gaseous Nebulae and Active Galactic Nuclei (Mill Valley, CA: University Science Books)
- Pauls & Schwartz (1989) Pauls, T., & Schwartz, P. R. 1989, in The Physics and Chemistry of Interstellar Molecular Clouds, ed. G. Winnewisser & T. J. Armstrong (Berlin: Springer), 225
- Perryman et al. (1997) Perryman, M. A. C., Lindegren, L., Kovalevsky, J., Hoeg, E., Bastian, U., Bernacca, P. L., Crézé, M., Donati, F., Grenon, M., van Leeuwen, F., van der Marel, H., Mignard, F., Murray, C. A., Le Poole, R. S., Schrijver, H., Turon, C., Arenou, F., Froeschlé, M., & Petersen, C. S. 1997, A&A, 323, L49
- Ridge et al. (2006) Ridge, N. A., Di Francesco, Jamesand Kirk, H., Li, D., Goodman, A. A., Alves, J. F., . Arce, H. G., Borkin, M. A., Caselli, P., Foster, J. B., Heyer, M. H., Johnstone, D., Kosslyn, D. A., Lombardi, M., Pineda, J. E., Schnee, S. L., & Tafalla, M. a. 2006, AJ, submitted
- Savage & Mathis (1979) Savage, B. D., & Mathis, J. S. 1979, ARA&A, 17, 73
- Schnee et al. (2005) Schnee, S. L., Goodman, A. A., Li, J. G., & Ridge, N. A. 2005, ApJ, 634, 442
- Steenbrugge et al. (2003) Steenbrugge, K. C., de Bruijne, J. H. J., Hoogerwerf, R., & de Zeeuw, P. T. 2003, A&A, 402, 587
- Ungerechts & Thaddeus (1987) Ungerechts, H., & Thaddeus, P. 1987, ApJS, 63, 645
- Černis (1990) Černis, K. 1990, Ap&SS, 166, 315
- Černis (1993) Černis, K. 1993, Baltic Astronomy, 2, 214
- Černis & Straižys (2003) Černis, K., & Straižys, V. 2003, Baltic Astronomy, 12, 301
- Wood et al. (1994) Wood, D. O. S., Myers, P. C., & Daugherty, D. A. 1994, ApJS, 95, 457