The UV Scattering Halo of the Central Source Associated with Eta Carinae
Abstract
We have made an extensive study of the UV spectrum of Carinae, and find that we do not directly observe the star and its wind in the UV. Because of dust along our line of sight, the UV light that we observe arises from bound-bound scattering at large impact parameters (e.g., 0.033″). We obtain a reasonable fit to the UV spectrum by using only the flux that originates outside 0.033″. This explains why we can still observe in the UV despite the large optical extinction — it is due to the presence of an intrinsic coronagraph in the Carinae system, and to the extension of the UV emitting region. It is not due to peculiar dust properties alone. We have computed the spectrum of the purported companion star, and show that it could only be directly detected in the UV spectrum preferentially in the Far Ultraviolet Spectroscopic Explorer (FUSE) spectral region (912-1175 Å). However, we find no direct evidence for a companion star, with the properties indicated by X-ray studies and studies of the Weigelt blobs, in UV spectra. This might be due to reprocessing of the companion’s light by the dense stellar wind of the primary. FUSE observations, at epochs when (and if) the opening of the bow shock is along our sightline, should have a better chance of detecting the companion spectrum. The UV spectrum is dominated by low ionization lines, many exhibiting P Cygni profiles. Some of the strongest lines that can be readily identified include C II 1335 (UV1), Si II 1304, 1309 (UV3); 1264 (UV4), 1527, 1533 (UV 2); 1808, 1817 (UV1), S II 1250, 1253 (UV1), Al II 1671, N I 1493, 1495 (UV4), Mg II 2796, 2803, as well as numerous Fe II lines. Higher excitation lines due to Al III 1855, 1863 and Si IV 1394, 1403 can be identified. A previous identification of C IV must, because of severe blending, be considered as uncertain. The terminal velocity, as derived from numerous emission lines, is less than 600 km s-1, with preferred values around 520 km s-1. This value is consistent with that seen in optical spectra. Broad Fe II and [Fe II] emission lines are detected in spectra taken in the SE lobe, 0.2″ from the central star. These lines arise in the stellar wind — thus the Space Telescope Imaging Spectrograph (STIS) and the Hubble Space Telescope (HST) are resolving, at some wavelengths, the stellar wind of Eta Carinae. The wind spectrum shows some similarities to the spectra of the B & D Weigelt blobs, but also shows some marked differences in that high excitation lines, and lines pumped by Ly, are not seen. The resolution of the stellar wind at optical wavelengths, and the detection of the broad lines, lends support to our interpretation of the UV spectrum, and to our model for Carinae.
1 Introduction
Eta Carinae is one of the most luminous and spectacular stars in our galaxy, and exhibits variability on a wide range of time scales (Zanella, Wolf, & Stahl 1984, Davidson and Humphreys DH97_rev (1997)). A major breakthrough to understanding some of the variability was made by Damineli Dam96_cyc (1996) who found that nebular line strengths varied periodically on a time-scale of 5.54 years. A similar time-scale was also present in infrared data (Whitelock et al. 1994). The cycle was confirmed to be periodic when the event predicted for December 1997 came on schedule (Damineli et al. 2000, Feast et al. 2001). Variability seen in radio data can also be related to a similar time-scale (Duncan et al. 1999, Duncan & White 1999).
On the basis of radial velocity variations, Damineli, Conti & Lopes (1997) postulated that Eta Carinae is a binary system characterized by high eccentricity, a hotter companion, and strong colliding winds. X-ray observations, which reveal an apparent X-ray eclipse, appear to confirm the binary hypothesis (Ishibashi et al. 1999, Corcoran et al. 2001). The duration ( months) of the eclipse, together with the rapid variability of high excitation nebular lines, indicates that the orbit is highly elliptical, with an eccentricity greater than 0.8 (see, e.g., Corcoran 2001). However, fitting the long duration of the X-ray minimum has been a challenge that was tentatively circumvented by enhanced mass-loss at periastron (Corcoran et al. 2001) or with a tilted angle of the colliding wind shock cone (Pittard & Corcoran 2002, Ishibashi 2001). In addition, radiative transfer effects and the complicated and severely blended profiles observed from the ground make it difficult to measure, and to interpret, radial velocity measurements. These difficulties led Davidson Dav99_bin (1999a) to question the validity of the derived orbital parameters. Indeed, high spatial resolution observations with the Space Telescope Imaging Spectrograph (STIS) did not reveal the expected velocity shifts in emission lines associated with the primary star (Davidson et al. 2000). An alternative set of orbital parameters, based on analysis of the X-ray light curve, has been given by Ishibashi Ish01_orbit (2001). Thus, while the binary model is generally accepted, the nature of the companion star, its orbit, and the influence of the companion on the major outbursts of the 1840s and 1890s are uncertain. Other interpretations of the variability have been suggested, most notably shell ejections (e.g., Davidson et al. 2005, Martin et al. 2005). A combination of shell ejections and binarity might be needed to explain variability seen in Hubble Space Telescope (HST) data (e.g., Smith et al. 2003a).
Information on the nature of the companion comes primarily from indirect arguments. Analysis of X-ray data indicates that the companion should have a mass loss rate of approximately yr-1, while estimates of the terminal velocity range from 1700 km s-1 (Corcoran et al. 2001) to 3000 km s-1 (Pittard & Corcoran 2003), with the higher velocity estimates now preferred. Other constraints on the companion come from its influence on the spectrum of the Weigelt blobs (Verner et al. 2002; Verner, Bruhweiler & Gull 2005). These suggest that it is an O type star with an effective temperature between 34,000 K and 38,000 K.
With the aim of clarifying the nature of the 5.5 year periodicity, and to gain insights into both the nature of the primary and companion stars, we initiated a major observational multi-wavelength campaign, using the Hubble Space Telescope (HST Eta Carinae Treasury project; PI K. Davidson), FUSE (PI T. Gull), X-ray satellite observatories (PI. M. Corcoran), and numerous ground-based observatories (e.g., VLT-UVES; PI. K. Weis), to observe Eta Carinae through a full variability cycle. Some of the HST data used in this paper are based on data obtained as part of that campaign, while other data were obtained as part of earlier HST programs to understand Eta Carinae. The campaign has confirmed the 5.5 year periodicity (Whitelock et al. 2004, Corcoran 2005, White et al. 2005) and provided a wealth of new data to help understand the complex system that is Eta Carinae.
An introduction to the extensive literature on Eta Carinae can be obtained from the reviews by Humphreys & Davidson HD94_LBV_rev (1994), and Davidson & Humphreys DH97_rev (1997), and three relatively recent workshops devoted to Eta Carinae and related objects (Morse, Humphreys, & Damineli 1999; Gull, Johansson, & Davidson 2001; Humphreys & Stanek 2005).
1.1 The Primary Star:
Ground-based spectra of Eta Carinae reveal a complex spectrum of H, He I, Fe II, and [Fe II] emission lines with 2 principal components. There is a narrow nebular-like spectrum , and a broad spectrum which indicates gaseous outflows with a velocity of approximately 500 km s-1. As other components are also seen, it is difficult to discern the underlying nature of the primary star, . Using the reflected spectrum Hillier & Allen HA92_eta (1992) suggested that the spectrum of is similar to the extreme P Cygni star HDE 316285. Later observations with the HST confirm this suggestion (Davidson et al. 1995; Hillier et al. 2001 [hereafter HDIG]). With the STIS on the HST it is possible to obtain the spectrum of the central star, uncontaminated by lines from the adjacent Weigelt blobs and the Homunculus. The Weigelt blobs are spatially unresolved condensations first seen in ground based speckle studies of Carinae (Weigelt, & Ebersberger 1986; Hofmann & Weigelt 1988). It is the Weigelt blobs that give rise to the narrow nebular spectrum (Davidson et al. 1995, 1997). The Little Homunculus also contributes to the narrow nebular spectrum (Ishibashi et al. 2003; Smith 2005).
HDIG were able to model the March 1998 optical spectrum, taken a few months after the 1997 spectroscopic event (the X-ray minimum began in mid-December of 1997; see, e.g., Corcoran 2005) using CMFGEN – a non-LTE line blanketed code designed for modeling stars with stellar winds (Hillier & Miller 1998, 1999). The code assumes spherical symmetry, and that the star and its wind is spatially unresolved. They were able to obtain a good fit to the H, He I, and Fe II emission line spectrum using a luminosity of for the primary star, and assuming a mass-loss rate of yr-1 and solar mass-fraction of iron. The best fit model confirmed that the central star suffered, in March 1998, severe circumstellar extinction with a total visual extinction of 7 magnitudes. The primary difference between the March 1998 spectrum, and later spectra, is that the P Cygni profiles tend to be stronger, and more prevalent in the March 1998 data set. In the optical, most emission line strengths (i.e, EWs) are very similar to those obtained on 4-Jul-2002 — indeed the two data sets are in better agreement with each other than with the CMFGEN model. The major exceptions are the He I profiles which show significant profile variations. Surprisingly, there is no strong indication that the terminal velocity of the outflow has changed. Changes in the H profile with time have been discussed by Davidson et al. DMH05_Ha (2005), while other changes will be the subject of future papers.
While the fit to the emission line spectrum was satisfactory (but see HDIG for more details), there were two fundamental discrepancies between the best fit model and the observations. First, the models predicted much stronger absorption components associated with H I, He I and Fe II P Cygni emission lines than was observed. Second, the fit to the spectrum shortward of Å was very poor – emission features did not usually match and the UV spectrum was much less absorbed, by the wind, than predicted by the model. Since the emission lines sample the whole wind, but the wind absorption components sample only one line of sight, two possible causes were suggested. First, the discrepancies could arise because Eta’s wind is asymmetric. This would not be surprising since the Homunculus is bipolar, and other LBVs, such as AG Car, are known to possess asymmetric winds (e.g., Schulte-Ladbeck 1994). For this to work, the wind would have to be more ionized along our sightline. Recent observations of the reflected optical spectrum by Smith et al. SDG03_eta_lat (2003a) provide direct evidence that the wind is aspherical and probably axisymmetric (bipolar), with stronger Balmer absorption near the poles. Interferometric observations by van Boekel et al. Boek03 (2003), confirm the bipolar geometry of the wind. Second, the ionization of the wind in some regions could be influenced by the ionizing radiation field of the companion. This is appealing since it provides a simple explanation for some of the observed spectral changes.
In this paper we reexamine the formation of the UV spectrum. We identify major wind lines seen in UV spectra, discuss the terminal velocity of the wind, and estimate the intervening H column density. Extensive foreground absorptions, caused by both circumstellar and interstellar matter, strongly influence the UV spectrum and have been discussed elsewhere (Gull et al. 2005; Nielsen, Gull, & Vieira Kober, 2005). We investigate the reason for our model’s failure to explain the observed UV spectrum. Several alternatives are considered including wind asymmetries, ionization of the outer wind by a companion star, the direct influence of a companion spectrum, the influence of dust, and the spatial extension of the UV emitting region. We show that the original model, when extended and interpreted differently, can explain many of the features seen in the UV spectrum.
The paper is organized as follows: In §2 we discuss the observations and data reduction while in §3 we examine the distance, visual magnitude and reddening of , the primary star associated with Carinae. Sections 4, 5 and 6 discuss the nature of the UV spectrum, the identification of UV wind lines, and the terminal velocity of the wind. The spectrum of the companion star, and its possible influence of the observed spectrum is discussed in §7. In §8 we examine the FUSE spectrum, while the H I column density along our sight line is derived in §8.1. The Model used for the analysis, and improvements made to it for the UV analyses, are described in §9, while the possible importance of wind asymmetries and flow times are discussed in §10. The creation of the UV spectrum is discussed in §11. Finally, in §12 we discuss how STIS observations allow us to study the spatial structure of the outer wind at optical wavelengths.
2 Observations and Data Reduction
Here we are concerned primarily with UV spectral observations. UV images ( Å) were discussed recently by Smith et al. (2004a, 2004b) while optical and IR spectra of the star have been discussed by HDIG; Smith Smi02_IR_Image (2002); Hamann et al. HDJ94_eta_opt (1994); Hillier & Allen HA92_eta (1992); Allen, Jones, & Hyland, AJH85_IR (1985). More recently, the variable H profiles have been discussed by Davidson et al. DMH05_Ha (2005), while the discovery and interpretation of the He II 4686 line has been discussed by Steiner & Damineli SD04_4686 (2004), Gull Gull05 (2005), Stahl et al. SWB05_eta_event (2005) and Martin et al. MDH05_4686 (2005). Using reflected spectra, the latitude dependence of the wind variations in optical lines has been studied by Weis et al. WSB05_polar_var (2005) and Stahl et al. SWB05_eta_event (2005).
The HST/STIS UV observations were recorded with MAMA echelle modes between March 2000 and March 2004. These data are part of an extensive optical and UV data set obtained as part of several HST programs including the HST treasury program on Carinae (PI: K. Davidson, GO-9420 and GO-9973). A summary of the UV MAMA observations, including PI and proposal number, is provided in Table 1. The E140M and E230H modes were used to span the spectral range from 1175 to 2380 Å with 30,000 to 60,000 resolving power. As instrument sensitivity and source brightness combined to provide better detectivity, the E230H mode was used to span 2380 to 3160 Å at resolving power 100,000. Data reduction was accomplished using the STIS GTO IDL CALSTIS software (Lindler 2002) with a special modification for large aperture with nebular extended source to correct for nebular background.
A summary of the optical observations is provided in Table 2. The data set is very extensive, although not all observations were done in the same manner. Different slit orientations, imposed by spacecraft orientations, were used, and on some dates only limited wavelength coverage was obtained. For most of the analyses (and plots) in this paper we have used the UV data obtained in July 2002 although data from other epochs has also been studied. The extensive July 2002 data data set is during Eta Carinae’s broad maximum in its 5.54 year period.
| Date | HST | Principal | Aperture | Grating | Spectral Range |
|---|---|---|---|---|---|
| ID | Investigator | ( ″) | (Å) | ||
| 2000 Mar 23 | 8327 | K. Davidson | 0.2x0.2 | E140M, E230M | 1175-2360 |
| 2001 Oct 1 | 9242 | A. Danks | 0.2x0.09 | E230H | 2385-2943 |
| 2002 Jan 20 | 9083 | K. Davidson | 0.2x0.09 | E230H | 2886-3159 |
| 0.2x0.2 | E140M, E230M | 1175-2360 | |||
| 2002 Jul 4 | 9337 | K. Davidson | 0.2x0.2 | E140M, E230M | 1175-2360 |
| E230H | 2423-2596 | ||||
| 2003 Feb 13 | 9420 | K. Davidson | 0.2x0.2 | E140M, E230M | 1175-2360 |
| 2003 May 26 | 9420 | K. Davidson | 0.2x0.2 | E140M, E230M | 1175-2360 |
| 2003 Jun 1 | 9420 | K. Davidson | 0.2x0.2 | E140M, E230M | 1175-2360 |
| 2003 Jun 22 | 9420 | K. Davidson | 0.2x0.2 | E140M, E230M | 1175-2360 |
| 2003 Jul 5 | 9973 | K. Davidson | 0.2X0.2 | E140M, E230M | 1175-2360 |
| 2003 Jul 29 | 9973 | K. Davidson | 0.3x0.2 | E140M, E230M | 1175-2360 |
| E230H | 2385-3159 | ||||
| 2003 Sep 21 | 9973 | K. Davidson | 0.3x0.2 | E140M, E230M | 1175-2360 |
| E230H | 2385-3159 | ||||
| 2004 Mar 6 | 9973 | K. Davidson | 0.3x0.2 | E140M, E230M | 1175-2360 |
| E230H | 2385-3159 |
| Date | HST | Principal | Aperture | Grating | Spectral Range |
|---|---|---|---|---|---|
| ID | Investigator | (″) | (Å) | ||
| 1997 Dec 31 | 7302 | K. Davidson | 52x0.1 | G230MB, G430M, G750M | Selected |
| 1998 Mar 19 | 7302 | K. Davidson | 52x0.1 | G230MB, G430M, G750M | 1640-10300 |
| 1998 Nov 25 | 8036 | T. Gull | 52x0.1 | G230MB, G430M, G750M | Selected |
| 1999 Feb 21 | 8036 | T. Gull | 52x0.1 | G230MB, G430M, G750M | 1640-10100 |
| 2000 Mar 13 | 8327 | K. Davidson | 52x0.1 | G750M | 6768 |
| 2000 Mar 20 | 8483 | T. Gull | 52x0.1 | G230MB, G430M, G750M | 1640-10100 |
| 2000 Mar 21 | 8483 | T. Gull | 52x0.1 | G430M, G750M | 4961, 6768 Mapping |
| 2000 Oct 9 | 8327 | K. Davidson | 52x0.1 | G750M | 6768 |
| 2001 Apr 17 | 8619 | K. Davidson | 52x0.1 | G230MB, G430M, G750M | 1640-10100 |
| 2001 Oct 1 | 9083 | K. Davidson | 52x0.1 | G230MB, G430M, G750M | Selected |
| 2001 Nov 27 | 8619 | K. Davidson | 52x0.1 | G750M | 6768 |
| 2002 Jan 19 | 9083 | K. Davidson | 52x0.1 | G230M, G430M, G50M | 1640-10100 |
| 2002 Jan 20 | 9083 | K. Davidson | 52x0.1 | G750M | 6768 |
| 2002 Jul 4 | 9337 | K. Davidson | 52x0.1 | G230MB, G430M, G750M | 1640-10100 |
| 2002 Dec 16 | 9420 | K. Davidson | 52x0.1 | G750M | 6768 |
| 2003 Feb 12 | 9420 | K. Davidson | 52x0.1 | G230MB, G430M, G750M | 1640-10100 |
| 2003 Feb 13 | 9420 | K. Davidson | 52x0.1 | G750M | 6768 |
| 2003 Mar 29 | 9420 | K. Davidson | 52x0.1 | G230MB, G430M, G750M | Selected |
| 2003 May 5 | 9420 | K. Davidson | 52x0.1 | G230MB, G430M, G750M | Selected |
| 2003 May 17 | 9420 | K. Davidson | 52x0.1 | G230MB, G430M, G750M | 1640-10100 |
| 2003 May 26 | 9420 | K. Davidson | 52x0.1 | G750M | 6768 |
| 2003 Jun 1 | 9420 | K. Davidson | 52x0.1 | G750M | 6768 |
| 2003 Jun 22 | 9420 | K. Davidson | 52x0.1 | G230MB, G430M, G750M | 1640-10100 |
| 2003 Jul 5 | 9973 | K. Davidson | 52X0.1 | G230MB, G430M, G750M | 1640-10100 |
| 2003 Jul 29 | 9973 | K. Davidson | 52x0,1 | G750M | 6768 |
| 2003 Jul 31 | 9973 | K. Davidson | 52x0.1 | G230MB, G430M, G750M | 1640-10100 |
| 2003 Sep 22 | 9973 | K. Davidson | 52x0.1 | G230MB, G430M, G750M | 1640-10100 |
| 2003 Nov 17 | 9973 | K. Davidson | 52x0.1 | G230MB, G430M, G750M | Selected |
| 2004 Mar 6 | 9973 | K. Davidson | 52x0.1 | G230MB, G430M, G750M | Selected, 2500-10100 |
Three sets of FUSE FUV spectra, which cover the wavelength band 990 to 1187 Å, were utilized for the modeling. Two sets of FUSE observations were obtained with the LWRS () aperture on 2002 June 25 (obsID C1540101), and 2003 June 10 (obsID D0070102). These and other FUSE observations of Carinae are discussed in more detail by Iping et al. (2005 and in preparation). The second of these two exposures was taken approximately 20 days before the onset of X-ray minimum (2003 June 29). The exposure times were 29157 and 15282 seconds, respectively. The standard CalFUSE calibration pipeline data products were used. The individual exposures in each observation were aligned by cross-correlation and coadded. The 2002 and 2003 spectra are qualitatively similar, but do show significant variations in the strength of absorption and emission features. After the observations were obtained it was realized that two 11th magnitude B-type stars, located 139 from Carinae, could contaminate the LWRS spectra by 50% (Iping et al. 2005). The third FUSE spectrum, obtained on 2004 April 11 (obs. ID: D0070109), using the LiF1 HIRS aperture at a PA of 134 with an exposure time 17118 seconds, shows significant differences with the LWRS observations. The HIRS data were processed with the same techniques as the LWRS spectra. An additional correction, for the point-source throughput of the HIRS aperture (60%), was not made to the spectrum used in this paper. This would raise the flux level of the HIRS spectrum by a factor of 1.67. As shown by Iping et al. (2005), the 2004 HIRS observation probably represents the intrinsic FUV spectrum of Carinae and there is little FUV flux that arises outside the HIRS aperture, except for the two B stars. Because it is free of contamination, all comparisons between models and the FUV spectrum in this paper are made with the HIRS spectrum.
3 Distance, Visual Magnitude and Reddening
3.1 Distance
Eta Carinae is located in a region of massive star formation in the Carina nebula, and is associated with the massive cluster Trumpler 16 (Walborn 1973). The distance of the Carinae nebula is generally taken to be around 2.5 kpc, however for Eta Carinae it is possible to derive an accurate estimate of the distance using the Homunculus. Using the explosion and basic geometrical arguments, Allen & Hillier (1993) derived a distance of kpc, while Davidson and Humphreys DH97_rev (1997) using several different arguments, obtained 2.3 kpc. More recently Davidson et al. (2001) derived kpc while Smith (2002) found that a distance of 2.25 kpc yielded images of the Homunculus with the greatest degree of axial symmetry. Thus based on the best available estimates, and for consistency with earlier work, we have adopted kpc.
3.2 Reddening and Visual Magnitude
The reddening law towards Eta Carinae is known to be unusual. Viotti et al. (1989), for example, suggested that the central source suffers an additional 0.7 magnitudes of color excess over the color excess of E(B-V) derived from the depth of the interstellar 2200Å band. In fact, given the heavily reddened optical spectrum, it is surprising that the UV spectrum is easily detected. This suggests that the circumstellar reddening law must be flat. Detailed studies of the stellar spectrum (1700Å to 10000Å) confirm the unusual reddening law (e.g., HDIG), and thermal-IR emission indicates dust temperatures consistent with large grains, which could cause unusual reddening (Smith et al. 1998, 2003b). Using detailed modeling, HDIG determined that the visual extinction in March 1998 was 7 magnitudes. The wavelength dependence was unusual and was fitted using the Cardelli, Clayton & Mathis (1988) extinction law assuming R=5.0 and E(B-V)=1. In addition, there were 2 magnitudes of gray extinction. Most of the extinction must arise from the circumstellar material associated with Carinae, and there is evidence that this extinction is variable with time.
STIS observations reveal that has brightened by about a factor of 3 between 1998.0 and 2003.7 although the increase has not been uniform in time (Davidson et al. 1999a, Martin et al. 2004). The best photometric data set on the brightening of the central source was obtained using the STIS acquisition images which utilizes a neutral density filter, and which covers the wavelength regions from 2000 to 11000Å.222Comparison of the STIS spectroscopic data of 1998-March-19 data with the data of 2002-July-04 (2003-June-22) shows that the brightening was somewhat larger in the near UV than the optical — roughly a factor of 1.5 (2) near 10000Å, increasing to roughly a factor of 2.5 (3) at 2500Å. Multiepoch HST/WFPC2 images of eta Carinae also reveal a brightening of the homunculus, although the behavior relative to the central star is complex (Smith et al. 2000). Analysis of the STIS observations shows that the increase has also occurred in the UV. For example, between 2000-March-23 and 2003-June-22 the UV flux (averaged over the wavelength interval 1250 Å to 1700 Å) increased by roughly a factor of 1.7. With the exception of observations around the event, both optical and UV spectra suggest that there has been very little change in the excitation temperature inferred from the wind emission spectrum. This implies that the effective temperature of the underlying star has not changed. Unless the bolometric luminosity has increased, and the star has conspired to alter its mass loss but not the wind terminal velocity to preserve its spectrum, this flux change can only be interpreted as due to a decrease in circumstellar extinction. This interpretation in also consistent with observations of the Weigelt blob spectra. Direct comparison of the Weigelt Blob D spectrum from March 1998 to September 2003 (5.5 years, or one period, apart) shows they are essentially identical in both line strengths and fluxes. In ground-based observations, the strength of the nebular (blob) emission lines, relative to the continuum, has been declining with time (e.g., Damineli, Levenhagen, & Leister 2005). We estimate that the visual extinction has declined from approximately 7 magnitudes in March 1998 to approximately 6.3 magnitudes in July of 2002. Both Davidson et al. DGH99_eta_bright (1999a) and Martin et al. MK04_eta_var (2004) provide a detailed discussion and insight into the brightening of .
4 The Nature of the UV Spectrum
The IUE spectrum of Eta Carinae has been studied by many different groups (e.g., Viotti et al. 1989; Viotti & Rossi 1999; Ebbets, Walborn & Parker 1997). From these, and other studies, it is known that the UV spectrum is covered by a wealth of absorption lines (some P Cygni) due to low ionization species (primarily Fe II). High ionization resonance lines of Al III, Si IV, C IV and N V were also identified. The absorption line spectrum of Car is very rich, with at least 3 and possibly more, absorption components/systems seen. Viotti et al. VRC89_UV (1989) note, for example, the presence of absorption extending to km s-1 (which they associate with the wind), and possibly to as high as -1240 km s-1 on the Si IV resonance doublet.
More recently the UV spectrum of the central source has been studied with the GHRS on the HST by Ebbets et al. EWP97_eta_UV (1997). Their observations showed that the UV spectrum of the central source is that of an early B supergiant except for the additional presence of low ionization wind features, and is quantitatively very similar to P Cygni. However close examination of the low resolution spectra reveals important differences. In particular, the spectrum of Eta Carinae is of lower excitation. It shows a spectrum that is richer in P Cygni lines, and which generally have stronger emission components. Eta Car also has a significantly larger terminal velocity than P Cygni.
As discussed by Hillier et al. HCNF98_HD316 (1998) the optical spectrum of P Cygni is also similar to that of HDE 316285, and hence it is not surprising that the Car central spectrum shows a spectrum somewhat similar to P Cygni. However, both HDE 316285 and Eta Car are of lower excitation than P Cygni, and their wind densities are higher (as highlighted by their stronger emission line spectrum). The presence of wind lines due to low ionization species is simply a consequence of the dense wind — as you move out in the wind the ionization state of the gas decreases.
Ebbets et al. EWP97_eta_UV (1997) infer that there are 2 basic absorption systems — one centered near km s-1, and the other near 1100 km s-1, in broad agreement with the earlier analysis of Viotti et al. VRC89_UV (1989). The first system is probably associated with the stellar wind. The usefulness of the UV absorption line spectrum for the analysis of the central source is unknown. In other hot stars the UV spectrum is of crucial importance, but because of intervening circumstellar (e.g., the Little Homunculus and the Homunculus) and interstellar material it is not easy to determine the pure star+wind spectrum of the central source associated with Car. It is clear that in both optical and UV spectra absorption associated with the wind is seen, and is characterized by a maximum velocity of approximately 500 km s-1. In many lines, particularly on the stronger resonance lines, absorption at higher velocities is also seen. Given the complex spectrum (see Sect. 5) and severe line blending the determination of accurate line profiles is difficult.
Recently numerous narrow absorption lines, arising in the circumstellar ejecta, have been found in high resolution HST MAMA spectra (Gull et al. 2005; Nielsen et al. 2005). Two principal systems have been identified, and are easily recognizable in the NUV R=110,000 spectra extracted with 0.091″ centered on the star. The low velocity system has a radial velocity of km s-1, and is seen primarily in singly ionized species (e.g. Fe II, Ni II, Cr II). The populations of the absorbing system are characterized by a thermal temperature of 6500K across the spectroscopic maximum, but cool to 5000 K briefly during the minimum (Nielsen et al. 2005, Gull, Nielsen & Vieira Kober 2006). The second system has radial velocity of km s-1, similar to the terminal velocity of the wind. It exhibits lines due to neutral and singly ionized species (e.g., Fe I, Fe II, V II, Ti II), as well as due to H2. The observed transitions arise in a gas collisionally populated at 760 K. Both absorption systems are characterized by their narrow line widths which indicate Doppler velocities of less than 10 km s-1. Using the excitation of the absorption components, and the observation that the absorption components are not only seen against the star, it is believed that the absorption systems arise in the wall of the little Homunculus ( km s-1 system; Gull et al. 2005; Smith 2005) and in the Homunculus ( km s-1 system; Gull et al. 2005). The km s-1component is consistent with the radial velocity of the H2 emission which cross the line of sight to the star (Smith 2005). A complete ejecta spectrum, together with line identifications, is available electronically (Nielsen et al. 2005; Gull et al. 2006).
Weaker narrow absorptions are identified at intermediate velocities, especially between to km s-1 and appear to be decreasingly excited towards higher velocities. Wind lines of these same species and indeed these same lines are present in the spectrum. The difference between ejecta and wind lines is twofold: wind lines, while lumpy in absorption profile, are continuous with terminal velocities around 520 to 600 km s-1. Strong lines originating from lower levels of Fe II are dominated by the wind to the point that the ejecta contribution is likely not to be detectable.
5 Identification of Wind Lines
Due to severe blending, and severe contamination by the nebular absorption spectrum, line identification in the wind spectrum is difficult, and prone to error. The principal culprit for the blending is Fe II — its spectrum dominates almost the entire UV wavelength region. An obvious solution to the line identification problem is to use a model to assist in the identification of lines. We have done this but, unfortunately, our models don’t provide a perfect fit, and hence there is still room for debate about some identifications.
To highlight the difficulty of analyzing the UV spectrum we illustrate in Fig. 1 a section of the theoretical UV spectrum. Also shown is the same theoretical spectrum in which we have omitted the influence of bound-bound transitions due to all species except nickel. The nickel spectrum is seen to be quite rich, however in the complete spectrum it is masked by Fe II.
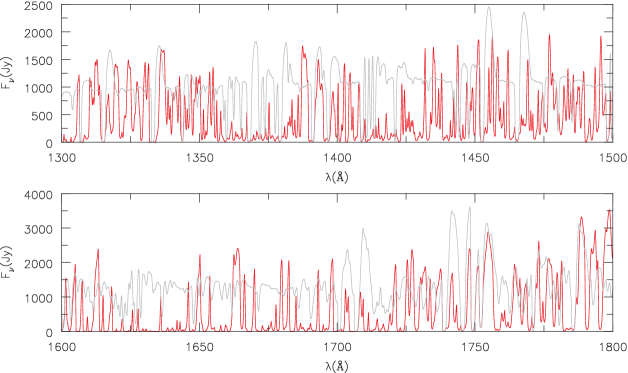
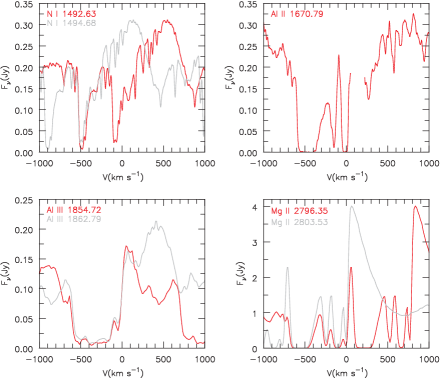
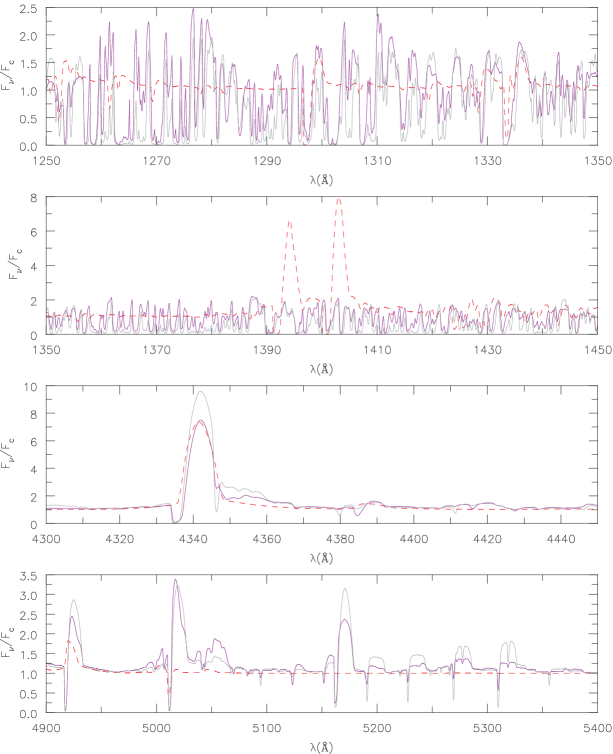
An additional constraint on line identification can be made using multiplets — if all (or at least the stronger members) of a multiplet are seen, and the components have similar profiles, we can be reasonably assured that the line identifications are correct. Some of the strongest lines that can be readily identified include C II 1335 (UV1) , Si II 1304, 1309 (UV3); 1264 (UV4), 1527, 1533 (UV 2); 1808, 1817 (UV1), S II 1250, 1253 (UV1), Al III 1855, 1863, Al II 1671, N I 1493, 1495 (UV4), Mg II 2796, 2803, as well as Fe II lines, too numerous to list. Some of these lines are illustrated in Figures 2, 3 and 4. Particularly striking is that all lines indicate a terminal velocity for Eta’s wind of between 500 and 600 km s-1 (Sect. 6). Interestingly, blue shifted absorption ( to km s-1) due to O I 1302,1304,1306 also appears to be present.
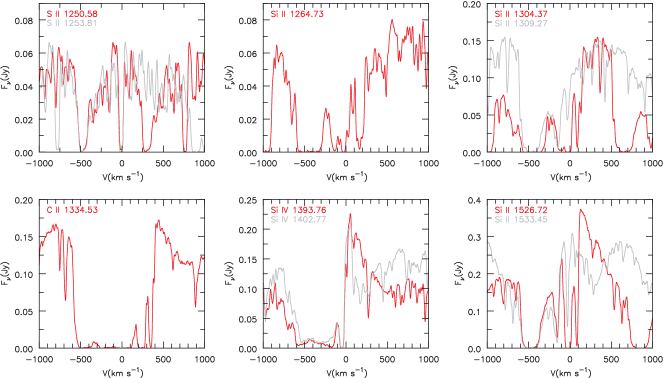

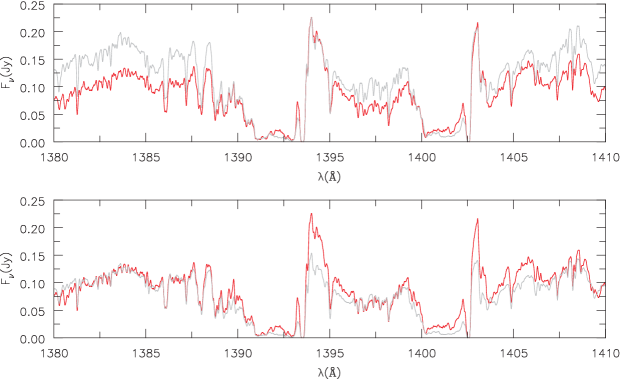
Si IV 1394, 1403 has often been identified in the spectrum of Eta Car (e.g., Viotti et al. 1989; Ebbets et al. 1997). Its presence would not be surprising, since it is clearly seen in the spectrum of P Cygni, however as noted earlier, the spectrum of P Cygni is generally of higher excitation. A closer examination of the spectrum and our theoretical models, however, reveals some difficulties with the identification. First, the emission and absorption components of one component don’t perfectly match that of the other component (Fig. 2). This could indicate a mis-identification, or could, not surprisingly, be simply due to the effect of blends. Second, the overall excitation of the spectrum is generally lower than P Cygni. Third, while our theoretical spectrum apparently shows the apparent presence of the Si IV lines, they are not actually due to Si IV — rather they are a blend of Fe II features. Because the theoretical model is not a good fit, it is hard to draw a firm conclusion. The complex spectral region around the Si IV doublet is shown in Fig. 5. Notice the complexity of the region, and how apparently isolated features are severely affected by line blending. An argument in support of the Si IV identification comes from comparing data sets obtained in March 2000 with those obtained in July 2002. The two components show similar variability behavior. Interestingly, the simplest interpretation of the variability is that the Si IV profiles have remained the same, while the surrounding spectrum has changed (Fig. 6).
We also find it difficult to firmly identify C IV 1548, 1551 in the spectrum. As noted earlier, C IV has been identified in the spectrum of Eta Carinae (e.g., Viotti et al. 1989; Ebbets et al. 1997) While two P Cygni absorption components are seen to occur at approximately the right wavelengths, the features can also be attributed to Fe II (Fig. 5).
In pure theoretical models Si IV and C IV do not substantially influence the spectrum of Eta Carinae. If the observed absorption features are due to Si IV and C IV it may be possible to reconcile the model with them by using X-rays. Eta Carinae is a significant source of X-rays, assumed to arise from the wind-wind interaction, and these could enhance the Si3+ and C3+ populations through Auger ionization, especially since Si+ and C+ are the dominant ionization stages in the outer wind (Note: Auger ionization typically ejects 2 electrons). Auger ionization, for example, is used to explain the anomalous ionization seen in O and B stars (e.g., Cassinelli & Olson 1979, MacFarlane et al. 1993, Pauldrach et al. 1994). In single OB stars the X-rays are generally thought to arise from radiative driven shocks in the wind (e.g., Lucy & White, 1980, Owocki, Castor & Rybick 1988), although magnetic fields may also play a role (Babel & Montmerle 1997; ud-Doula & Owocki 2002). Because the terminal velocity of ’s wind is relatively slow compared to O stars, radiative driven wind shocks are probably not an important source of X-rays. If Auger ionization is important, we might expect to see significant variations of the high-excitation lines during the X-ray minimum. Alternatively, ionization of Eta Carinae’s wind by UV flux from the companion star could also produce significant Si3+ and C3+, and this would also vary with orbital phase.
Our model (see Sect. 9) is able to predict the presence of most of the lines shown in Figures 2, 3, and 4. The exceptions are the higher excitation lines such as those of Si IV and Al III which, as noted earlier, may be explained by invoking the influence of X-rays, and/or the ionizing field of the companion, on the wind of the primary.
6 The Terminal Velocity of the Wind
Of fundamental importance to understanding the wind dynamics is the terminal velocity, , of the stellar wind. The terminal velocity can also be used, through the theory of line driven winds (e.g., Kudritzki & Puls 2000; Kudritzki 1992) to determine the effective escape velocity from the “surface” of the star. The terminal velocity, along our line of sight, is most easily measured from the blue edge of strong UV P Cygni profiles. While the severe blending in the UV spectrum of Eta Car makes this difficult, it is possible to deduce a value for using a combination of lines, especially doublets. Using the steep blue edge of the absorption profile, we derive estimates of the terminal velocity along our sight line that range from a low of 480 km s-1 to a high of around 580 km s-1 (see Figures 2 & 3). The Fe II absorption P Cygni profiles also give terminal velocity between 500 and 600 km s-1(see Fig. 4). We suggest that the true terminal velocity is around 500 km s-1, and that the higher derived values are probably the result of turbulence in the wind.
As noted previously, it is possible that the wind of Eta Carinae is axisymmetric, and thus the terminal velocity may have a latitude dependence. The angle of our sight line to the bipolar axis of the Homunculus is approximately (e.g., Allen & Hillier 1993, Davidson et al. 2001, Smith 2002).
In earlier UV analyses high-velocity absorption components extending to 800 km s-1, 1240 km s-1 (Viotti et al. 1989) and 1100 km s-1 (Ebbets et al. 1997) have been identified. We find it difficult to confirm these identifications. Sometimes a feature is seen to be associated with one component, but not with the second. Narrow ejecta components have been identified at approximately 1150 and 1175 km s-1(in Al II, Al III, Si II, Si IV, and Mg II), and at 1650 km s-1(in Al III, C IV, and Si IV) (Nielsen et al. 2005).
How can we reconcile the apparent absence of the high velocity (broad) absorption? First, we note that many narrow components arising from other species are present, and these can sometimes lead to a mistaken identification, especially with lower spectral resolving powers. These narrow components are much more readily identified in our high resolution MAMA spectra. Second, our models reveal how severe the line blending is in Eta Car, making it more difficult to be confident in line identifications. Third, IUE spectra were recorded through large apertures ( or 3″). They thus have a larger contribution to the spectrum from scattered light (arising from the Homunculus and outer wind). We note, for example, that Smith et al. SDG03_eta_lat (2003a) identify velocities approaching 1000 km s-1 from the P Cygni absorption seen in reflected spectra of the star taken along the polar axis. Intrinsic variability may also be important — velocities approaching 1000 km s-1 were seen in some H HST STIS observations of the central star (Davidson et al. 2005).
7 Influence of the Companion Star
It is now commonly accepted that Eta Carinae is a binary star. However, no direct influence of the companion on the observed optical or UV spectrum of has been seen, although Iping et al. (2005) argue the FUSE spectrum is dominated by the companion star (see 8). Recently Steiner & Damineli SD04_4686 (2004) detected broad He II emission in the stellar spectrum, which might be related to the companion star. An extensive discussion of the difficulty in producing this emission is given by Martin et al. MDH05_4686 (2005), who argue for an alternative model in which the He II emission arises in a mass ejection. Smith et al. SMC04_UV2 (2004a) previously detected, in the UV scattering halo, moving shadows which suggest the presence of a companion star. Using our model we can ask whether the proposed companion could be observed.
As noted in the introduction, the parameters of the companion are uncertain. Analysis of X-ray data indicates that it has a mass loss rate of approximately yr-1 and a terminal velocity of 3000 km s-1 (Pittard & Corcoran 2003). Based on its influence on the spectra of Weigelt blobs, Verner et al. VGB02_bd_blob (2002) and Verner, Bruhweiler & Gull VBG05_bd_blob (2005) suggest that the companion is an O type star with an effective temperature between 34,000 K and 38,000 K. We have therefore adopted the following parameters for the companion: K, , yr-1, , and km s-1. The discussion is not significantly influenced by the choice of these parameters.333The adopted O star luminosity is 20% of that adopted for the model of the primary star associated with Eta Carinae. Since the luminosity of the Eta Carinae system is fixed, we should reduce the corresponding luminosity of the primary. This only adds additional complications, and does not significantly affect the conclusions. The O star companion luminosity is high, and might be expected to have a significant influence on the circumstellar gas in the neighborhood of Eta Carinae. A lower luminosity would weaken the influence, and would also make the star more difficult to detect.
In Fig. 7 we illustrate the spectral energy distribution of the companion and the primary star. As readily apparent, the primary star dominates the observed spectral energy distribution, except at wavelengths in the far UV (shortward of 1200Å). This dominance occurs for three reasons:
-
1.
The primary has a higher luminosity.
-
2.
The secondary is hotter, so more of its energy is emitted in the UV and EUV.
-
3.
The strong wind of the primary redistributes its UV energy to optical wavelengths.
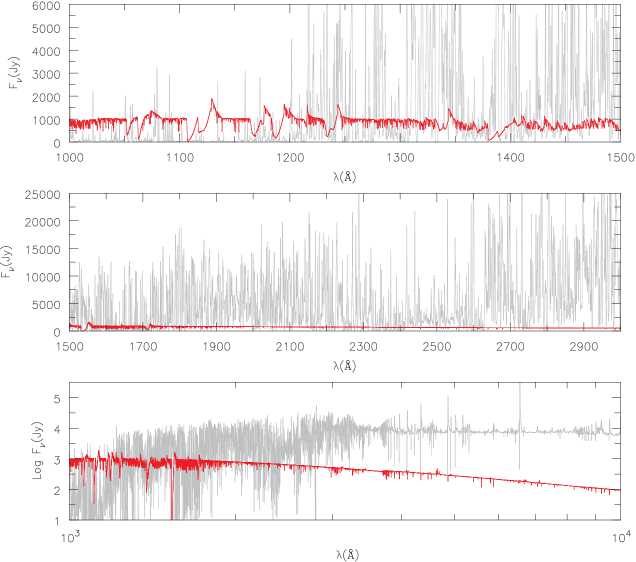
Thus it is apparent that we would not expect to directly observe the companion star at optical wavelengths, and that the FUSE spectral range offers the best wavelength regime to observe the companion star. Indeed a simple interpretation of the above figures suggests that the FUSE spectrum could be primarily that of the companion. Could this be the case?
A detailed examination of the FUSE spectral region does not reveal an obvious O-type star stellar spectrum. However, this is to be expected since the spectrum of the O star, at most phases, will be strongly modified, and possibly reprocessed, by the wind of the primary. In Section 11 we argue that, due to occultation by dust, the observed UV continuum from Eta Carinae originates at large radii. Since the semi-major axis of the O star orbit is approximately 16 AU (0.007″), the O star will generally also be occulted by the dust. Consequently its light, to be observable, must also be scattered into our line of sight.
A more direct consequence of the companion is that it will produce a significant flux of ionizing photons. This flux of ionizing photons will significantly influence the wind of the primary. Indeed, HDIG suggested that the companion could be responsible for the absence of strong P Cygni profiles on the H and Fe II optical lines at most orbital phases. In the outer wind of Eta, H becomes neutral, and Fe+ is the dominant ionization stage of iron. Recent HST/STIS data on the variability of the He I profiles suggest that they are significantly influenced by the companion star — indeed the direct contribution of the primary radiation field to the strength of these lines may be relatively small.
The secondary star, being an O star, emits enough FUV photons to ionize a significant portion of the primary wind. For the model above, we have that approximately 1/3 of the luminosity is emitted in the H-Lyman continuum [giving ], while approximately 5% of the flux is emitted below 504Å [giving =48.6]. The size of the cavity is difficult to determine since it will be strongly affected by the shape and density of the wind-wind interaction region, and the effective temperature of the companion.
In the following analyses we only model the spectrum of the primary star, and ignore in these models any possible influence of the companion.
8 The FUSE Spectrum
The FUSE spectral region is of special interest because potentially we could directly detect the presence of the companion star (Sect. 7). Interpretation of the FUSE spectra, however, is difficult because of the very rich circumstellar and interstellar spectral features superimposed on the stellar spectrum, and because of the large aperture that was used. It is further confused by the contamination of LWRS spectra by two nearby field stars (Iping et al. 2005).
The original analysis was carried out using observations obtained with the LWRS aperture in 2002 June and 2003 June. However, as noted earlier, two B-type stars contribute approximately half of the observed flux in these spectra. The spectra, while showing many similarities, do show significant differences to the narrow aperture observation taken in 2004 April. Almost all of these differences are due to the lack of contamination by the B stars (Iping et al. 2005). Intrinsic changes in the FUV spectrum of Carinae appear to be a minor factor in the differences between the HIRS spectrum and earlier LWRS spectra.
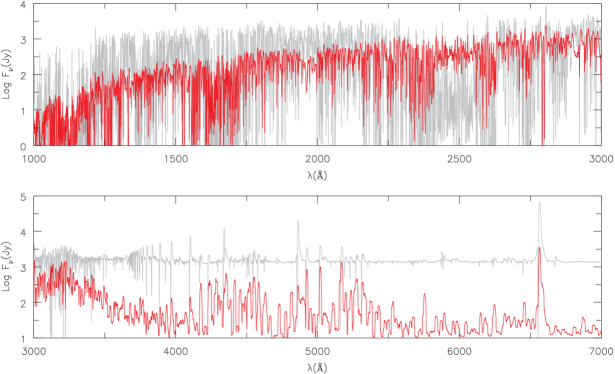
The FUSE spectrum overlaps the STIS/MAMA echelle spectrum from approximately 1145 to 1190 Å. In this region the MAMA spectrum (2004-Mar-06) is noisy, and its flux is approximately a factor of 4 below that of the throughput-corrected April 10, 2004 FUSE HIRS spectrum ( erg cm-2 s-1 Å-1). While some of this may be due to changes in flux during the month spacing, most is due to the larger FUSE aperture The FUSE and MAMA spectra are qualitatively similar, although some features are different.
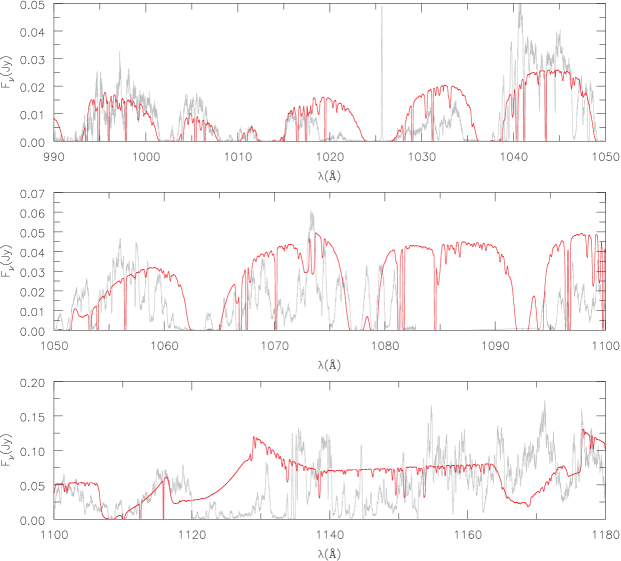
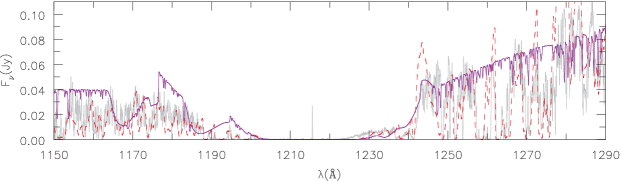
The full model spectrum provides an extremely poor fit to the FUSE observations. A much better fit, although far from perfect (Fig. 8), is provided by the spectrum originating outside 0.033″ (see Sect. 11). For the comparison we reddened the model using the Cardelli et al. CCM88_ext (1988) extinction law with E(B=V)=0.4 and R=3.1,444 Using R=5, which might be appropriate, affects the scaling between the model and the FUSE observations but not the overall fit. and divided the flux by another factor of 2. Thus to make the comparison, the reddening was considerably reduced over that needed to fit the near UV and optical, and is more similar to the expected interstellar reddening towards Eta Carinae. As expected, the model fits this FUSE observation better than the earlier observations made with the LWRS aperture.
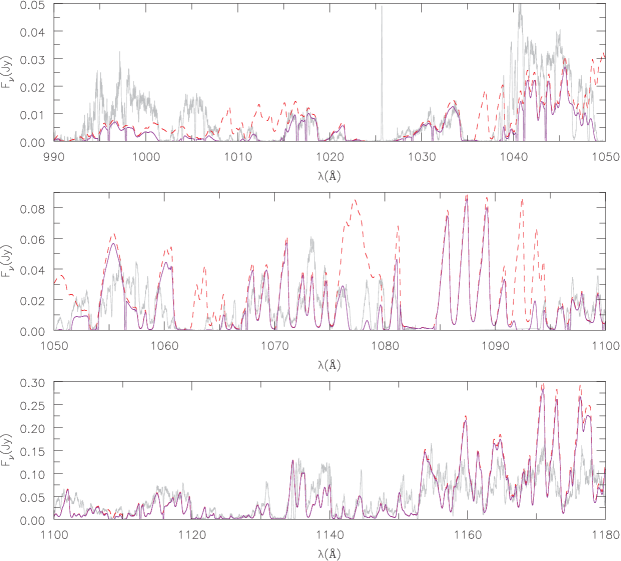
Comparison of our theoretical companion spectrum with the FUSE spectrum does not provide any convincing evidence for standard features expected to be present in the FUV spectrum of a companion star. For example, there are no obvious P Cygni profiles that could be unambiguously interpreted as arising in an O-star companion (see Fig. 9). Such P Cygni profiles should be prevalent if the O star’s mass loss rate, as X-ray studies suggest, is as high as yr-1. As can be seen from Figures 8 and 9, the model spectrum originating outside 0.033″ provides a better fit to the observations than the companion star. In some sense the invisibility of the companion star is not surprising — unless we are looking directly down the cone caused by interaction of the two stellar winds, the companion spectrum will be strongly modified by the primary’s wind.
What would be the effect of a choice of different parameters for the companion star? Unless we reduce the luminosity significantly, the light from the companion is still likely to dominate the FUSE spectral region. For example, if we increase the effective temperature of the companion to 40,000 K the flux in the FUSE spectral region would decrease by only 25%. More importantly, the number of H I and He II ionizing photons would increase (roughly by a factor of 2) meaning that the companion would have a larger direct influence on the ionization structure of the wind. A reduction in mass loss by a factor of 5 (and from 3000 to 2000 km s-1) reduces the strength of the wind features, but they would still be easily detectable.
Recently Iping et al. (2005) analyzed FUSE data of Eta Car taken at several different two epochs. One data set was obtained close to the 2003 spectroscopic event on 2003-June-27 (X-ray minimum began at 2003 June 29; Corcoran 2005). The spectrum taken near the spectroscopic minimum has a different character to all the other data sets, showing only a small flux in limited wavelength regions. Based on several arguments Iping et al. concluded that the FUSE flux was primarily due to the companion, and that during the event the companion’s flux was being eclipsed/absorbed by the primary star and its wind. An alternative explanation is that the flux in the FUSE spectral region is reduced because of a shell ejection, as invoked to explain other spectroscopic features (e.g., Davidson et al. 2005, Martin et al. 2005, Smith et al. 2003a).
The largest uncertainties on the predicted FUSE spectrum, and on the interpretation of the observed FUSE spectrum, arise from the affect of the dust curtain, and on how the light from the companion is modified by the wind of the primary, an important effect not included in the present analysis. The study of these effects is beyond the scope of the present paper.
8.1 H I Column Density
In principle, the H I column densities towards Eta can be measured from the Ly (1216Å) and Ly (1026Å) lines in the STIS and FUSE spectra. In Fig. 10 we show the STIS spectrum in the neighborhood of Ly. A firm upper limit to the neutral hydrogen column density is N(H I) which primarily is set by the presence of a significant flux around 1230 Å. The best fit column density, using the spectrum of the primary originating outside 0.033″, is N(H I), while the best fit obtained using the spectrum of the secondary is 22.3. The lower limit is somewhat difficult to determine but N(H I) is a reasonable estimate. Because the spectrum of the primary provides the best fit to the interstellar/circumstellar Ly profile we have adopted N(H I).
Since the dust may not be uniform across the STIS aperture (Hillier & Allen 1992; Morse et al. 1998; Smith et al. 2004b), and because of the scattering, the derived log N(H I) must be considered a lower value. Such a column density is consistent with that required to cause the narrow Balmer line absorption which is seen both on and off the star (Johansson et al. 2005). The variable absorption is centered at km s-1 on the star, but shifts to km s-1 off the star. Due to the strong intrinsic absorption around Ly, and uncertainties in the model, it is difficult to determine a column density from the last FUSE data set (Figures 8, 9). However, the presence of flux around 1028 Å suggests that N(H I), and closer to 21.8. A lower column density for the FUSE data set is consistent with the idea that the FUSE flux comes from a more extended region than the STIS data, and suffers less absorption.
9 The Model
The “final” model adopted for modeling the optical spectrum of , was discussed extensively by HDIG, and has the following parameters:
,
K)
K)
K)
,
km s-1,
H/He by number.
, km s-1,
The first radius listed corresponds to the inner boundary of our model, and is only a few percent smaller than the radius of the star at the sonic point. The other 2 radii correspond to locations in the wind, and highlight the large optical depth of the wind. is the volume filling factor which is used to allow for clumping in the stellar wind, and in the present models it has a minimum value of 0.1. Clumping reduces the derived mass-loss rates and reduces the strength of the electron scattering wings (Hillier 1991, Hillier and Miller 1999). Recent near-IR interferometric observations by van Boekel et al. (2003) suggest that the mass-loss rate has the somewhat higher value of yr-1. This value gives electron scattering wings which are somewhat too large. Unfortunately the wind asymmetry, and the possibility that the HST is still not obtaining the “true” spectrum of the star (Hillier et al. 2001),555 Several earlier publications (e.g, Hillier & Allen 1992, Davidson et al. 1995, Hillier et al. HDIG_hven_eta (2001); Smith et al. 2003a) also noted that the Balmer lines were stronger (i.e., had a larger EW) on the star than in spectra taken in the lobes. This is surprising since the lobe spectrum is primarily produced by scattering of light from the central source. The effect can be seen for H in one of the spectra shown in Fig. 17. makes a more accurate value difficult to determine. The influence of changes in mass loss rate on the observed UV spectrum are discussed in § 11, while further information, particularly for the optical spectrum, is provided by HDIG.
We also note that the model is not unique. In particular, the derived mass-loss rate will be higher if we adopt a larger He/H abundance ratio. The value chosen is consistent with that found from studies of the S-condensation by Davidson et al. DDWG86 (1986), but the stellar abundance could be higher, especially if recent estimates of the mass of the Homunculus (; Smith et al. 2003b) are correct. Such larger masses would imply that a significant amount of material was lost from Eta Carinae, potentially allowing more processed material to be revealed at the stellar surface. The He/H ratio cannot be derived uniquely from the stellar spectrum due to degeneracy between the mass-loss rate and the He/H ratio (HDIG). The derivation of a reliable He/H ratio is made even more difficult because of the strong possibility that the He I profiles and fluxes are significantly influenced by the companion star.
We also note that, because of the opaque wind, the radius of the star cannot be derived. Models with 60 to 480 predict similar spectra, with the exception that the He I lines weaken as the radius increases. If the He I lines are primarily produced by the radiation field of the companion, or if the mass-loss rate is lower than yr-1, models with larger radii are favored.
Abundances are taken from the analysis of HDIG. In that analysis we found that the optical observations were consistent with solar mass fractions for Fe, Si, and Mg. The deduced CNO abundances were consistent with that expected for full CNO processing, while we found evidence that the Na abundance was enhanced by at least a factor of 2. Given the complex UV spectrum, with its often saturated and badly blended P Cygni profiles, and the complex origin of the UV spectrum (see Sect. 11) we have not attempted to revise these abundances. This will be attempted in a future study.
9.1 Model Improvements
The original model for extended to 1000(0.1″). For this work it was necessary to extend the model out to 20000 (approximately 2.2″). This is close to the size, along the polar direction, of the Little Homunculus (Ishibashi et al.2003). In order to facilitate this extension we did the following: (a) We computed models which included adiabatic cooling. (b) We improved the model Fe II atom so that the lowest energy levels could be treated as individual super-levels. This latter change is necessary to model the optical wind spectrum formed at large radii, and is also important for model convergence. Atomic data for our Fe II atom is from Nahar Nah95_FeII (1995); Zhang & Pradhan ZP95_FeII_col (1995); and Kurucz & Bell KB95_CD (1995). The charge exchange cross-sections were chosen so the rate was proportional to the statistical weights of the final level. The rates were scaled so that the total rate between individual levels was equal to the total rate between the corresponding terms. Charge exchange rates were obtained from the compilation of Kingdon & Ferland KB95_CD (1995).
10 Asymmetries and Time Scales
The Homunculus shows an obvious bipolar symmetry. From HST studies and VLT studies there is also evidence for a wind asymmetry. The wind seems to be denser, and flow faster, along the polar directions (Smith et al. 2003a). VLT observations indicate a density contrast of a factor of 1.5 between the polar and equatorial flows (van Boekel et al. 2003). HST observations indicate velocities approaching 900 km s-1 in the polar flow, whereas the wind in most directions has a velocity of only 500 to 600 km s-1(Smith et al. 2003a). It is unclear whether the velocity of 900 km s-1 corresponds to the true terminal velocity of the wind. It was measured from the blue most absorption edge of the H profile, and is larger than the value measured from the blue edge of the stronger P Cygni absorption trough. Further, velocities measured from emission lines, independent of orientation, indicate “mean maximum” outflow velocities of around 500 km s-1. In O stars the extended (shallow) absorption is generally thought to arise from shocks in the stellar wind, and is assumed not to indicate the actual terminal velocity of the mean flow. When the minimum of the P Cygni profile is measured on H measured velocities, as a function of latitude, vary from just over 400 km s-1at 45∘ to a little under 600 km s-1along the pole (Smith et al. 2003a). The variation depends on the observational epoch.
In the first modeling of the data we will ignore intrinsic asymmetries associated with ’s primary wind. We will also ignore in the calculations perturbations to the wind structure, and the ionization state of the wind, induced by the binary companion.666It is important to distinguish between the two type of asymmetries. An intrinsic asymmetry associated with the underlying primary has important implications for the mass-loss process, and for understanding the evolution of the primary star. Such an asymmetry may, or may not, be time variable. In the case of the binary the asymmetry is more complex, because it involves both the interaction of the two stellar winds, and the influence of the radiation field of the companion. In addition, the effect of the asymmetry on the spectrum will change with orbital phase. We thus fit the data with some model, which then represents some “averaged” wind properties. However, we then utilize a variety of models to gain insights into the possible influence of deviations from spherical symmetry. Deviations of the data from the best model will give insights into the asymmetries and the influence of the companion. The goal of this work is not to fit the spectrum — rather it is to gain insights into the nature of the central star and its wind.
One-dimension studies, such as the one performed here, are an absolute necessity. Work is in progress to develop 2.5D and 3D radiative transfer codes for stars with extended atmospheres (e.g., Busche & Hillier 2005, Georgiev, Hillier & Zsargó 2005, and Zsargó, Hillier & Georgiev 2005, van Noort, Hubeny, & Lanz 2002). However full non-LTE models, with equivalent complexity (in terms of the model atoms) require 2 to 3 orders more computational effort. In addition the parameter space is much larger. Thus 1D models will still play a crucial role in gaining critical insights, and in limiting the parameter space to be studied.
We also need to be concerned with variability. Variability implies changing physical conditions, and different regions of the flow will respond differently, and on different time scales, to these changing conditions. First, an estimate of the wind flow time can be written as
| (1) |
This time scale is significant: the wind at 1″ reflects the mass loss of 22 years earlier. Consequently the large scale wind that can currently be directly observed with HST is dependent on the mass-loss history of Carinae over the last 20 years. Even at 0.1″, the flow time is over 2 years.
We will assume for simplicity, and for lack of other information, that the flow has been constant. We note, however, that due to the long flow times the history of the mass loss from Eta Carinae could be important. Given the erratic variability exhibited by Eta Carinae over the last 20 years (e.g., Whitelock et al. 1994, Sterken et al. 1999, Martin & Koppelman 2004), flow variations could influence the density structure of the outer wind.
The recombination time-scale is
| (2) |
For hydrogen, is at K (Osterbrock 1989). In the inner wind the recombination time-scale is much less than the flow time, but at large radii the recombination time scale can be longer. In terms of the model parameters it can be written as
| (3) |
where is the ratio of electrons to atoms. In the inner wind is approximately unity, whereas in the outer wind can be substantially less than 1.
11 The UV Mystery
In the 2001 paper (HDIG) our model was unable to explain the UV spectrum. The predicted UV spectrum (1200 – 1600Å) was much richer in UV absorption lines than that observed. At the time it was noted that a binary companion, or a wind asymmetry might provide possible solutions to the discrepancy. Since that time, direct evidence for a wind asymmetry has been found (Smith et al. 2003a, van Boekel et al. 2003). However various observational and theoretical indicators suggest that this is not the full solution. More recently the FUSE spectrum of Carinae has become available. The FUSE spectrum is also significantly different from the model predictions.
In order to understand the UV spectrum we investigated a wide range of models in which we varied the mass-loss rate to see if we could find a match to the UV spectrum. While the mass-loss rate does have a significant effect on the UV spectrum, a variation in mass-loss rate alone cannot account for the observed spectrum. Examples of such spectra are shown in Fig. 11. As the mass-loss rate is lowered, the Fe II emission lines weaken, the He I emission lines strengthen, and the Balmer P Cygni absorption weakens and eventually disappears, as does much of the Fe II absorption in the UV. Eventually N III and He II come into emission, and neither are observed. In addition the V flux is reduced: the model with yr-1 has a visual flux 3.3 times larger than the model with yr-1. Finally we note that in the low mass-loss rate model Ly is in emission and contains approximately 7% of the emitted flux, while over 20% of the flux is emitted shortward of the Lyman jump.
The large differences in the model spectra are related to the ionization of H and Fe. In the high mass-loss model, H recombines in the outer envelope. When the neutral H ionization fraction exceeds , charge exchange processes with Fe2+ become important. This drives the ionization of Fe quickly towards Fe+. In the lower mass-loss rate model, H recombination never occurs and Fe is primarily Fe2+. Smith et al. SDG03_eta_lat (2003a) argue that this recombination is latitude dependent, and that during the event the wind at our latitude, which is normally ionized, recombines.
It is clear from a comparison of the models with observation that the low mass-loss rate models do not provide a better fit to the observations — indeed the average wind properties appear to be more similar to our original model. It might be possible to generate a better fit by using an asymmetric model with a range of mass-loss rates. In such a model our sight line would preferentially view the star in a direction of low-mass loss rate, while the Fe II lines would come from another region (presumably a denser polar flow). Unfortunately such a model, by itself, does not appear to provide an explanation for some unexplained UV emission features. Is there an alternative explanation?
Several observations provide clues to the resolution of the UV mystery. First, the UV emitting region of is extended. Overwhelming evidence is provided by a comparison of FUSE fluxes with HST fluxes integrated over the central star. In the overlapping wavebands, the FUSE flux (2004-April-11) exceeds the STIS flux (2002-July-04) by a factor of 4 (6.7 if we allow for the FUSE point-source throughput-correction). Similarly, evidence for extended UV emission is provided by a comparison of GHRS observations with HST STIS fluxes. As noted by HDIG, the GHRS fluxes (obtained in 1995) are a factor of 3 higher than those obtained using STIS. Proof is provided by the ACS/HRC images of Eta Carinae, which clearly show extended UV emission around the star (Smith et al. 2004b). The inferred extension of the UV emitting region is not surprising: the primary star is only a relatively small direct contributor to the flux of Carinae at optical wavelengths.
Several possible mechanisms could provide an explanation for the extended UV emission: electron scattering, dust scattering, and resonance line scattering.
Electron scattering can be ruled out since the expected column densities are too low. Further electron scattering is wavelength independent, and this does not agree with the observations. In the neighborhood of the star (e.g., inside 0.3″) the UV emission is more extended than the optical emission.
The role of dust is more difficult to determine. From infrared observations we know that dust exists in the walls of the Homunculus, in the equatorial disk, and in an inner core (e.g., Smith & Gehrz 1998; Smith 2002; Smith et al. 2003a). Further we know that the central source suffers circumstellar extinction. This circumstellar extinction is not uniform: the Weigelt B, C and D blobs, located less than 0.2″ from the central source suffer much less extinction (Hillier & Allen 1992; Davidson et al. 1995). If they did not suffer less extinction, we could not explain their energetics (Davidson & Humphreys 1986, Weigelt et al. 1995). The complex distribution of dust around the central source, and the complicated scattering geometry, can be seen in the UV images of Smith et al. SMG04_UV1 (2004b).
The dust sublimation radius is believed to be approximately 0.07″, assuming a dust sublimation temperature of 1000 K (e.g., Smith et al. 2003b). This radius is similar to the spatial resolution of our HST observations. Recently Chesneau et al. Ches05_eta_IR (2005) found indications, from high spatial resolution IR images, that the dust around seemed to occur outside a radius of 0.130 to 0.170″.
Dust scattering is very important for generating the Homunculus spectrum. However various arguments suggest that it is not the dominant mechanism close to the star. First, dust scattering preserves the basic underlying spectrum. However no theoretical model spectrum generated to date has been able to match the UV spectrum. Another potential problem is that dust scattering varies continuously but smoothly with wavelength. UV observations suggest that the extended UV spectrum varies strongly with wavelength. This variation is especially obvious in UV spectra taken during the 2003 event.
These, and other considerations, lead us to believe (Hillier et al. 2003) that the UV emitting region is very extended, and the UV spectrum we observe arises from bound-bound scattering in material at large radii (e.g., at radii ″). The UV radiation coming from such radii suffers less extinction than does the central star, and hence is more readily detected. Thus while dust does not provide a direct explanation for the UV halo, it does provide the crucial coronagraph which preferentially blocks our line of sight to the central star.
It is worth noting that there are two distinct, but related, processes occurring. First, significant UV emission is coming from around the “point source”. This emission is clearly identified in the images of Smith et al. SMC04_UV2 (2004a), and as Smith et al. note, the contribution of the point source to the total light is lower at UV wavelengths (see below). The visibility of this extended UV emission is enhanced by dust obscuration of the central source. Second, dust is obscuring some of the star and its wind. Because the obscuration is not uniform, we cannot directly compare observed stellar spectra with models. Indeed, it is the non-uniform obscuration that allows the broad [Fe II] lines to be seen in ground-based optical spectra.
For this model to work the dust must have an asymmetric distribution. This is in accord with the observations, since observations of the reflected Homunculus spectrum show that the circumstellar extinction along the bipolar axis of the Homunculus is significantly lower than along our sight line (Hillier & Allen 1992). In addition infrared observations clearly show that the dust is distributed asymmetrically (Smith et al. 2003b, Chesneau et al. 2005).
We can estimate the optical depth of a resonance line in the wind using simple scaling laws. Assuming N(H)/N(He)=5 and a solar mass fraction of Fe, the optical depth can be written in the form
where is the oscillator strength, the fraction of the Fe population in state , and is the exponent which describes the velocity in the wind. For a classic velocity law , but if we have additional acceleration in the outer wind could be significantly greater than 1. In the inner regions the optical depth is determined by the velocity gradient (i.e., through the Sobolev approximation), but in the outer region the static optical depth dominates. It is readily evident that many of Fe II transitions will have optical depths exceeding unity at 0.1″.
Supporting evidence for the importance of resonance scattering comes from optical observations. First, in the SE lobe we can resolve the outermost layers of the wind. The spectrum is dominated by broad permitted and forbidden lines of Fe II. Further, near 3000Å, we see very strong Fe II emission lines. These most likely originate by continuum fluorescence.
As noted above, we postulate that the UV spectrum originating in the inner layers (or, more correctly, from small impact parameters) is absorbed (and scattered) from our line of sight by dust. Thus the UV spectrum we observe is NOT the stellar spectrum — rather it is the spectrum that originates outside some impact parameter.777By stellar spectrum we mean the spectrum of the star, and its wind, as would be observed if the star and its winds were unresolved, and if the Homunculus and other circumstellar ejecta were absent. A model comparison with observation needs to specifically address this origin at large radii. For simplicity we will assume uniform extinction centered on the central star, and which completely blocks the stellar UV light out to some radius (impact parameter). In practice the extinction is likely to vary with radial distance from the star, in azimuth, and depending on the dust properties, with wavelength. The spectrum so computed was found to give much better agreement with observation. Indeed unexplained emission features could now be explained. Note that this does not explain the anomalous extinction observed in the optical, since the optical continuum originates at much smaller impact parameters (as illustrated in Fig. 14)
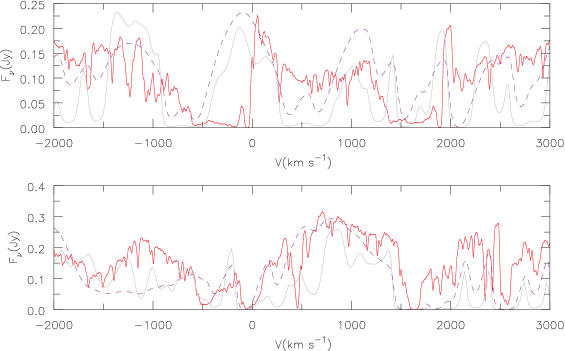
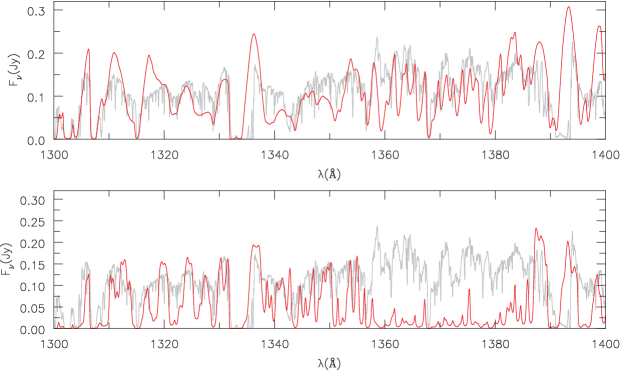
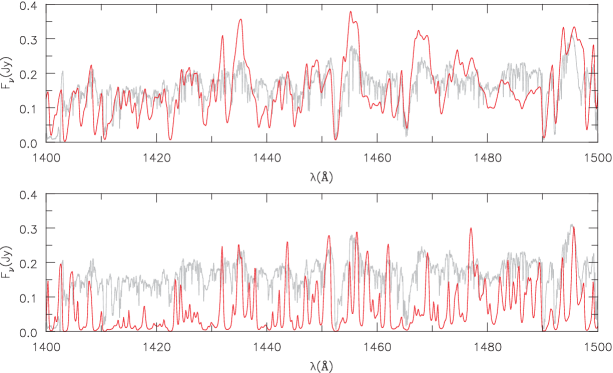
In Figs. 12 & 13 we show a collection of spectra to illustrate the agreement/disagreements between model and observation. In the bottom panel of each figure we show a direct comparison of the observations with the model. In general there is strong disagreement — the theoretical model is too strongly absorbed. However models with lower mass loss, and hence higher excitation, still cannot explain the observations.
In the upper panels we compare the spectrum with that arising from outside 0.033″. There is much better qualitative agreement between the observed and predicted spectra. In particular, notice how the P Cygni emission feature near 1425Å is reproduced in the models. The emission feature is actually a complicated blend arising from many lines. No integrated spectrum from a single mass-loss rate model could reproduce this feature. Interestingly, as noted earlier, the spectrum originating outside 0.033″ also provides a better fit to the FUSE spectrum (Fig. 8).
The choice of 0.033″ was (somewhat) arbitrary, but for “small” changes (see Fig. 15) the conclusions and spectral comparisons are still valid. While 0.033″ may seem unduly small, some support for such a value can be gleaned from the Weigelt blobs. Since the Weigelt blobs suffer much less extinction than the central star, the coronagraph, at least on the NW side extends ″.
In Fig. 14 we provide an illustration of the extension of the star as a function of wavelength. The extension is strongly wavelength dependent, and is largest in the UV, particularly from 2500 to 3000 Å. This figure indicates that at UV wavelengths, particularly from 2500 to 3000Å, a significant fraction of the UV flux originates outside 0.033″. While the source is extended we should note that the model predicts that the star should, in the absence of dust scattering, still have a well defined “stellar core”. This is illustrated in Figure 15. In the upper panel we see that the star has a well defined core, although the size of the core varies with wavelength. In the lower panel, we take into account the integration over area such that the area under the curve, as illustrated, is proportional to the observed flux. In the UV (2700-3000Å) the star is roughly 30 times larger than it is in the optical (5500-6500Å). The smaller peak in the UV probably reflects regions between lines. Despite the extended UV structure, the observed point spread function along the slit of the CCD detector will be dominated by the point spread function of the telescope and instrument (Fig. 16). The model does not explain the very extended UV emission, which presumably arises from dust scattering in the Homunculus.
Detailed quantitative illustrations of the extended UV halo are provided by Smith et al. SMG04_UV1 (2004b). In the F220W and F250W filters there is an extended “bright” halo around the point source, not seen in the optical filters, which extends out to about 0.5″. The extended UV emission can be characterized by the amount of flux emitted in a 0.1″ aperture centered on the star relative to that emitted in a 3.2″ diameter aperture. For the F550M, F330W, F250W, and F220W filters the fractions are 27%, 14%, 9.5%, and 8.6%, respectively.


11.1 The UV spectrum before and during the event
A detailed paper on the variability of the UV spectrum before, during, and after the 2003 minimum will be provided elsewhere. Here we provide only a brief summary. The data sets covering March 2000 to July 2004 are very similar in the UV. In the wavelength region covered by E140M (1150 to 1700Å) there is an overall increase in flux with time — the data set obtained in July 2002 is approximately 40% brighter than that in March 2000. Qualitatively, however, the spectra are similar, and the changes are too small to affect any conclusions drawn in this paper. The blue edge of the P Cygni profiles is remarkably constant, while significant changes are seen on the red side of the absorption profile (weaker in later data sets), and there are some changes in the emission line strengths.
During the UV event, the Fe II forest in the UV becomes much more prominent. In some regions around 2200Å, it is difficult to trace the star in the MAMA aperture. In addition the UV emission is extended, it is not symmetrical about the star, and we no longer have a well defined point source. The enhancement of the Fe II forest was expected, since it was known that the P Cygni absorption components on the Fe II optical lines were much stronger near and during the minimum. Two simple scenarios can be used to explain the absorption profile variability. In the first, a shell is ejected which reduces the UV flux to the outer wind leading to a lower iron ionization and hence enhanced P Cygni profiles. In the second scenario, UV flux from the companion star is blocked from reaching the outer wind material when the star is near periastron.
12 The Optical Outer Wind Spectrum
Using STIS on the HST it is possible to resolve the outer wind. Potentially this could provide a wealth of information on the nature of the stellar wind. Unfortunately the analysis of the spectra will be difficult:
-
1.
The extinction, and the shape of the extinction law, is unknown. It varies with location across the wind on the sky, and within the wind.
-
2.
The outer wind spectrum is contaminated by the stellar (inner wind) spectrum due to dust scattering (Hillier & Allen 1992; Smith et al. 2003a). While the inner wind spectrum can be readily identified, it is not easily removed since the EWs of the scattered wind lines in the spectrum are often lower than those measured on the central source. The reason for this is unknown, although it could simply be a consequence of the wind asymmetry. Alternatively it could be related to the occurrence of dust within the stellar wind, or the properties of the intrinsic coronagraph.
-
3.
Instrumental artifacts (e.g., ghosts) can cause spurious features which can mimic the dust scattered spectrum (e.g, Hill 2000, Martin 2004). The location of these features in long-slit Homunculus spectra will depend on the HST slit orientation. The ghost in CCD spectra are due to window in front of the CCD housing. This is not a problem with the MAMAs although there is a much smaller ghost in the FUV MAMA, closer to the point source, due to the photocathode being on the window a short distance from the microchannel plate.
On the NW side the wind spectrum is not easily discerned. A detailed analysis of the outer wind spectrum will be left to a future paper. In Figs. 17 and 18 we show a comparison of the wind spectrum with that of the Weigelt blobs. The wind spectrum was obtained at 0.2″ NE of the star but still in the SE lobe (PA 69∘) on July 4, 2002. To facilitate the comparison, we have broadened the Weigelt blob spectrum so that the line widths correspond roughly to that seen in the stellar wind. Several similarities can be seen with the Weigelt blob spectra. However, there are also important differences.
-
1.
The stellar spectrum does not show the high excitation lines (e.g., [Ne III] ; [Fe III] 4658, 4701; [Ar III] ) seen in the spectra of the Weigelt blobs (although not at minimum). However blue shifted components of these lines can be seen in the wind spectrum.
-
2.
Many of the forbidden Fe II lines are also seen in the wind spectrum, although they are broadened. The severe blending is seen by direct comparison with the Weigelt blob spectrum.
-
3.
At longer wavelengths (i.e., far red), the [Fe II] spectrum is not as prominent. This can be attributed to several possible causes: the general weakening of the [Fe II] lines, the strong scattered continuum which makes the lines more difficult to discern, and the absence of lines pumped by Ly.
-
4.
In the 3000 to 3300Å region many strong broad lines can be seen. Some of these have counterparts in the star, but NOT in the Weigelt blobs. We attribute these lines to continuum fluorescence.
-
5.
Because of line blending, line profiles are difficult to ascertain. Many lines are fairly symmetric (e.g, Fe II ), and exhibit a parabolic profile with a slight flattening at the top. On the other hand, some lines (e.g., [N II] ) show very asymmetric profiles — the [N II] profile appears blue shifted, and is quite asymmetric. This profile may arise from a distinct emitting region — the profile appears to be related to the blue shifted components of [Fe III] seen at this location (see item 1), and which have been identified in ground-based spectra (Zanella et al. 1984).
Particularly noteworthy is that broad forbidden lines indicate a terminal velocity of 500 km s-1 similar to that derived from the stellar spectrum. The outer wind features give rise to the broad base of the Prussian helmets seen in ground-based spectra (Hillier & Allen 1992). The resolution of the stellar wind at optical wavelengths, and the detection of broad [Fe II] lines, lends support to our interpretation of the UV, and to our model for Carinae.
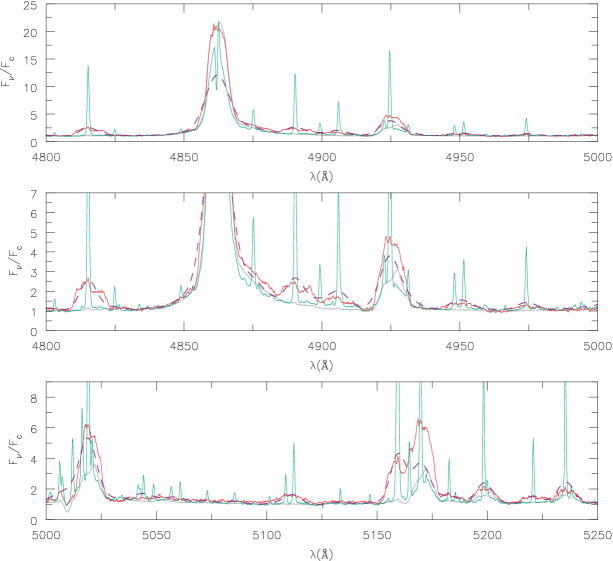
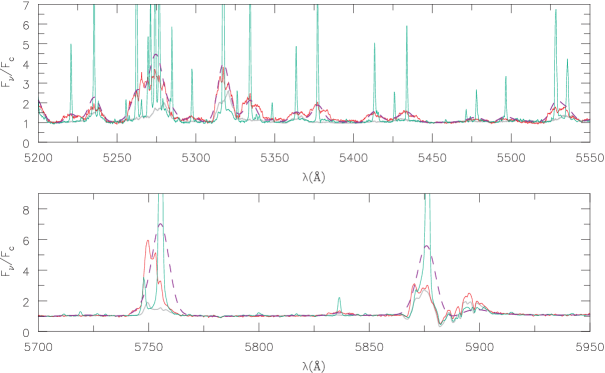
13 Conclusion
A fundamental prerequisite to understanding the reason for the ejection of the Homunculus is to determine the fundamental properties of the primary star. Unfortunately the primary star is shrouded in a dense wind. In addition, dust extinction does not allow an uninterrupted view of the primary star, and its wind.
The UV spectrum of Eta Carinae is dominated by low ionization lines, many exhibiting P Cygni profiles. Some of the strongest lines that can be readily identified include C II 1335 (UV1), Si II 1304, 1309 (UV3); 1264 (UV4), 1527, 1533 (UV 2); 1808, 1817 (UV1), S II 1250, 1253 (UV1), Al II 1671, N I 1493, 1495 (UV4), Mg II 2796, 2803, as well as numerous Fe II lines. Higher excitation lines due to Al III 1855, 1863, and probably Si IV 1394, 1403 can also be identified. The identification of C IV 1548, 1552 is uncertain because of severe line blending.
We have shown that we do not directly observe the star and its wind in the UV — rather, because the inner regions are occulted by dust, we only observe the spectrum created in the outer regions (i.e., at large impact parameters) of the stellar wind. This helps partially explain the flatness of the UV extinction law — the flatness does not simply reflect the properties of the dust. Importantly, it indicates that we cannot simply use the observed UV spectrum to determine the properties of the dust causing the circumstellar extinction. Further the dust in the densest knots will suffer greater shielding from UV radiation, and will have different properties compared to the dust located in other regions. This affects our ability to understand the excitation of the Weigelt blobs. The results reinforce the belief that our view of Eta Carinae is biased. The view from other directions would be significantly different. It is still probable the ionizing flux from the companion star is also influencing the observed spectrum. The high hydrogen column density towards the central star (N(H)) is confirmed from analysis of the Ly profile in HST MAMA data.
We show that the FUSE spectral region is, in principle, the best wavelength region to detect directly the primary star. However, no direct evidence of the companion star, with the properties indicated by X-ray studies (i.e, , and km s-1) is seen in current FUSE data, or in MAMA data. This may be partially a consequence of reprocessing of the companion light by the dense wind of the primary. Alternatively, it may indicate the parameters of the O star, as inferred from the X-ray and Weigelt blob analyses, are incorrect.
The best fit to the FUSE data is obtained using the spectrum for the model of the primary originating beyond 0.033″. The fit, not surprisingly, is far from perfect. As our study has shown modeling of the UV spectra of Eta Car is extremely difficult. It is necessary to allow for the extended nature of the UV emitting region and occulation by dust. Further, the companion will modify the ionization structure of the wind, and while the companion is probably the dominant light source, in the FUSE spectral region, its spectrum will be modified by the dense wind of the primary. Finally, there is extensive evidence for an axi-symmetric wind which also needs to be allowed for in future modeling.
The terminal velocity of the primary’s wind lies between 500 and 600 km s-1 with values near the lower end preferred. This range is consistent with that determined by HDIG from analysis of the optical spectrum. Surprisingly, we find no convincing evidence for higher velocity components.
With the STIS on the HST we have resolved the stellar wind of Eta Carinae. Broad Fe II emission lines are observed directly. These broad wind lines can be seen at a distance of 0.2″ (and beyond) from the central source, and also indicate a wind terminal velocity of approximately 500 km s-1. The wind spectrum shows some similarities to the spectra of B & D Weigelt blobs, but also shows some marked differences in that high excitation lines, and lines pumped by Ly, are not seen.
The observations were made with the NASA/ESA Hubble Space Telescope under HST-GO and STIS-GTO programs through the STScI under NAS5-26555 and with the NASA/CNES/CSA Far Ultraviolet Spectroscopic Explorer, which is operated for NASA by The Johns Hopkins University under NASA contract NAS5-32985. T.R.G., G.S., R.C.I. & D.J.H. acknowledge support from the FUSE Guest Investigator program. The HST Treasury project is supported by NASA programs GO-9420 and GO-9973. K. W. acknowledges support by the state of North Rhine-Westphalia (Lise Meitner fellowship). We would also like to thank K. Davidson and R. M. Humphreys for providing useful comments on an earlier draft of the manuscript.
References
- (1) Allen, D. A., & Hillier, D. J. 1993, Proc. Astr. Soc. Aust., 10, 338
- (2) Allen, D. A., Jones, T. J., & Hyland, A. R. 1985, ApJ, 291, 280
- (3) Babel, J., & Montmerle, T. 1997, ApJ, 485, L29
- (4) van Boekel, R., et al. 2003, A&A, 410, L37
- (5) Busche, J. R., & Hillier, D. J. 2005, AJ, 129, 454
- (6) Cardelli, J. A., Clayton, G. C., & Mathis, J.S. 1988, ApJ, 329, L33
- (7) Cassinelli, J. P., & Olson, G. L. 1979, ApJ, 229, 304
- (8) Chesneau, O., et al. 2005, A&A, 435, 1043
- (9) Corcoran, M. F. 2005, AJ, 129, 2018
- (10) Corcoran, M. F., Rawley, G. L., Swank, J. H., & Petre, R. 1995, ApJ, 445, L121
- (11) Corcoran, M. F., Ishibashi, K., Swank, J. H., & Petre, R. 2001, ApJ, 547, 1034
- (12) Corcoran, M. F., et al. 1998, ApJ, 494, 381
- (13) Cox, P., Mezger, P. G., Sievers, A., Najarro, F., Bronfman, L., Kreysa, E., & Haslam, G. 1995, A&A, 297, 168
- (14) Damineli, A. 1996, ApJ, 460, L49
- (15) Damineli, A., Conti, P. S., & Lopes, D. F. 1997, New. Astr., 2, 107
- (16) Damineli, A., Kaufer, A., Wolf, B., Stahl, O., Lopes, D. F., & de Arauújo, F. X. 2000, ApJ, 528, L101
- (17) Damineli, A., Levenhagen, R., & Leister, N. V. 2005, in ASP Conf. Ser. 332, The Fate of the Most Massive Stars, ed. R. M. Humphreys, K. Stanek (San Francisco: ASP), 122
- (18) Damineli, A., Stahl, O., Kaufer, A., Wolf, B., Quast, G., & Lopes, D. F. 1998, A&AS, 133, 299
- (19) Davidson, K. 1971, MNRAS, 154, 415
- (20) Davidson, K. 1987, ApJ, 317, 760
- (21) Davidson, K. 1999, in ASP Conf. Ser. 179, Eta Carinae at the Millenium, ed. J.A. Morse, R.M. Humphreys, & A. Damineli (San Francisco: ASP), 304
- (22) Davidson, K., Dufour, R. J., Walborn, N. R., & Gull, T. R. 1986, ApJ, 305, 867
- (23) Davidson, K., Ebbets, D., Weigelt, G., Humphreys, R. M., Hajian, A. R., Walborn, N. R., & Rosa, M. 1995, ApJ, 109, 1784
- (24) Davidson, K., & Humphreys, R. M. 1986, A&A, 164, L7
- (25) Davidson, K., & Humphreys, R. M. 1997, ARA&A, 35, 1
- (26) Davidson, K., Ebbets, D., Johannson, S., Morese, J. A., Hamann, F. W., Balick, B., Humphreys, R. M., Weigelt, G., Frank, A. 1997, AJ, 113, 335
- (27) Davidson, K., Gull, T. R., Humphreys, R. M., Ishibashi, K., Whitelock, P., Berdnikov, L., McGregor, P. J., Metacalf, T. S., Polomski, E., & Hamuy, M. 1999a, AJ, 118, 1777
- (28) Davidson, K., Ishibashi, K., Gull, T.R., & Humphreys, R. M. 1999b, in ASP Conf. Ser. 179, Eta Carinae at the Millenium, ed. J.A. Morse, R.M. Humphreys, & A. Damineli (San Francisco: ASP), 227
- (29) Davidson, K., Ishibashi, K., Gull, T. R., Humphreys, R. M., & Smith, N. 2000, ApJ, 530, L107
- (30) Davidson, K., Martin, J. C., Humphreys, R. M., Ishibashi, K., Gull, T. R., Stahl, O., Weis, K., Hillier, D. J., Damineli, A., Corcoran, M., & Hamann, F. 2005, AJ, 129, 900
- (31) Davidson, K., Smith, N., Gull, T., Kazunori, I., & Hillier, D. J. 2001, AJ, 121, 1569
- (32) Duncan, R. A., & White, S. M. 2003, MNRAS, 338, 425
- (33) Duncan, R. A., White, S. M., Reynolds, J. E., & Lim, J. 1999, in ASP Conf. Ser. 179, Eta Carinae at the Millenium, ed. J.A. Morse, R.M. Humphreys, & A. Damineli (San Francisco: ASP), 54
- (34) Ebbets, D. C., Walborn, N. R., & Parker, J. Wm. 1997, ApJ, 489, L161
- (35) Feast, M., Whitelock, P., Mrang, F. 2001, MNRAS, 322, 741
- (36) Georgiev, L. N., Hillier, D. J., & Zsargó J. 2005, A&A, submitted
- (37) Gull, T. R. 2005, in ASP Conf. Ser. 332, The Fate of the Most Massive Stars, ed. R. M. Humphreys, K. Stanek (San Francisco: ASP), 281
- (38) Gull, T. R., Johansson, S., & Davidson, K. (ed) 2001, ASP Conf. Ser. 242, Eta Carinae and Other Mysterious Stars: The Hidden Opportunities of Emission Line Spectroscopy (San Francisco: ASP)
- (39) Gull, T. R., Vieira, G., Bruhweiler, F., Nielsen, K. E., Verner, E., & Danks, A. 2005, ApJ, 620, 442
- (40) Gull, T. R., Nielsen, K. E., Vieira Kober, G. 2006, ApJS, in press
- (41) Hamann, F., Depoy, D. L., Johansson, S., & Elias, J. 1994, ApJ, 422, 626
- (42) Hill, R.S. 2000,“The Geometry and Approximate Correction of STIS CCD Window Ghosts,” STIS Post-Launch SMOV Report #063 (Greenbelt, MD: GSFC)
- (43) Hillier, D. J. 1991, A&A, 247, 455
- (44) Hillier, D. J., Allen, D. A. 1992, A&A, 262, 153
- (45) Hillier, D. J., Crowther, P.A., Najarro, F., & Fullerton, A.W. 1998, A&A, 340, 483
- (46) Hillier, D. J., Davidson, K., Gull, T. R., Humphreys, R. M., Iping, R., Sonneborn, G., & the Eta Car HST Treasury Team 2003, AAS, 203.5806
- (47) Hillier, D. J., Davidson, K., Ishibashi, K., & Gull, T. R. 2001, ApJ, 553, 837 (HDIG)
- (48) Hillier, D. J., Davidson, K., Ishibashi, K., & Gull, T. R. 2001, in ASP Conf. Ser. 242, Eta Carinae and Other Mysterious Stars: The Hidden Opportunities of Emission Line Spectroscopy, ed. T.R. Gull, S. Johansson, & K. Davidson (San Francisco: ASP), 15
- (49) Hillier, D. J., & Miller, D. L. 1998, ApJ, 496, 407
- (50) Hillier, D. J., & Miller, D. L. 1999, ApJ, 519, 354
- (51) Hofmann, K.-H., & Weigelt, G. 1988, A&A, 203, L21
- (52) Humphreys, R. M., & Davidson, K. 1984, Sc, 223, 4633
- (53) Humphreys, R. M., & Davidson, K. 1994, PASP, 106, 1025
- (54) Humphreys, R. M., & Stanek, K. (ed) 2005, ASP Conf Ser. 332, The Most Massive Stars (San Francisco: ASP)
- (55) Humphreys, R. M., HST-FOS Car Team 1999, in ASP Conf. Ser. 179, Eta Carinae at the Millenium, ed. J.A. Morse, R.M. Humphreys, & A. Damineli (San Francisco: ASP), 107
- (56) Iping, R. C., Sonneborn, G., Gull, T. R., Massa, D. L., Hillier, D. J. 2005, ApJ, 633, L37
- (57) Ishibashi, K. 2001, in ASP Conf. Ser. 242, Eta Carinae and Other Mysterious Stars: The Hidden Opportunities of Emission Line Spectroscopy, ed. T.R. Gull, S. Johansson, & K. Davidson (San Francisco: ASP), 53
- (58) Ishibashi, K., Corcoran, M. F., Davidson, K., Swank, J. H., Petre, R., Drake, S. A., Damineli, A., & White, S. 1999, ApJ, 524, 983
- (59) Ishibashi, K. et al. 2003, AJ, 125, 3222
- (60) Johansson, S., Gull, T. R., Hartman, H., & Letokhov, V. S. 2005, A&A, 435, 183
- (61) Kellogg, J. R., Morse, J. A., & Davidson, K. 1999, in ASP Conf. Ser. 179, Eta Carinae at the Millenium, ed. J.A. Morse, R.M. Humphreys, & A. Damineli (San Francisco: ASP), 83
- (62) Kingdon, J. B., & Ferland, G. J. 1996, ApJS, 106, 205
- (63) Kudritzki, R. P., & Puls, J. 2000, ARA&A, 38, 613
- (64) Kudritzki, R. P., Hummer, D. G., Pauldrach, A. W. A., Puls, J., Najarro, F., & Imhoff, J. 1992, A&A, 257, 655
- (65) Kurucz, R. L., & Bell, B. 1995, Kurucz CD-ROM 23, (Cambridge:Smithsonian Astrophysical Observatory) http://cfa_www.harvard.edu/ampdata
- (66) Lindler, D. 1999, CALSTIS Refererence Guide (CALSTIS version 6.4) (Greenbelt, MD: GSFC)
- (67) Lucy, L. B., & White, R. L. 1980, ApJ, 241, 300
- (68) MacFarlane, J. J., Waldron, W. L., Corcoran, M. F., Wolff, M. J., Wang, P., & Cassinelli, J. P. 1993, ApJ, 419, 813
-
(69)
Martin, J. C. 2004, “Removal of the H-alpha Ghost Image from STIS CCD
Data,” Eta Carinae Treasury Project Technical Report #10,
http://etacar.umn.edu/treasury/techmemos/pdf/tmemo010.pdf - (70) Martin, J. C., & Koppelman, M. D. 2004, AJ, 127, 2352
-
(71)
Martin, J. C., Davidson, K., Humphreys, R. M., Hillier, D. J.,
& Ishibashi, K. 2005, ApJ, in press (astro-ph/0504151)
- (72) Morse, J. A., Davidson, K., Bally, J., Ebbets, D., Balick, B., & Frank, A. 1998, AJ, 116, 2443
- (73) Morse, J. A., Humphreys, R. M., & Damineli, A. (ed) 1999, ASP Conf. Ser. 179, Eta Carinae at the Millenium (San Francisco: ASP)
- (74) Nahar, S. N. 1995, A&A, 293, 967
- (75) Nielsen, K. E., Gull, T. R., & Vieira Kober, G. 2005, ApJS, 157, 138
- (76) van Noort, M., Hubeny, I., & Lanz, T. 2002, ApJ, 568, 1066
- (77) Osterbrock, D. E. 1989, Astrophysics of Gaseous Nebulae and Active Galactic Nuclei (CA: University Science Books)
- (78) Owocki, S.P., Castor, J.I., Rybicki, G.B. 1988, ApJ, 335, 914
- (79) Pauldrach, A. W. A, Kudritzki, R. P., Puls, J., Butler, K., & Hunsinger, J. 1994, A&A, 283, 525
- (80) Pittard, J. M., & Corcoran, M.F. 2002, A&A, 383, 636
- (81) Pittard, J. M., & Corcoran, M.F. 2003, RevMexAA, 15, 81
- (82) Schulte-Ladbeck, R.E., Clayton, G.C., Hillier, D.J., Harries, T.J., Howarth, I.D. 1994, ApJ, 429, 846
- (83) Smith, N. 2002, MNRAS, 337, 1252
- (84) Smith, N. 2005, MNRAS, 357, 1330
- (85) Smith, N., Davidson, K., Gull, T., Ishibashi, K., & Hillier, D.J. 2003a, ApJ, 586, 432
- (86) Smith, N., & Gehrz, R. D. 1998, AJ, 116, 823
- (87) Smith, N., Gehrz, R. D., Hinz, P. M., Hoffmann, W. F., Mamajek, E. E., Meyer, M. R., & Hora, J. L. 2002, ApJ, 567, L77
- (88) Smith, N., Gehrz, R. D., Hinz, P. M., Hoffmann, W. F., Hora, J. L., Mamajek, E. E., & Meyer, M. R. 2003b, AJ, 125, 1458
- (89) Smith, N., Gehrz, R. D., & Krautter, J. 1998, AJ, 116, 1332
- (90) Smith, N., Morse, J. A., Collins, N. R., & Gull, T. 2004a, ApJL, 610, 105
- (91) Smith, N., Morse, J., Davidson, K., & Humphreys, R. M. 2000, AJ, 120, 920
- (92) Smith, N. et al. 2004b, ApJ, 605, 405
- (93) Stahl, O., Weis, K., Bomans, D. J., Davidson, K., Gull, T. R., Humphreys, R. M. 2005, A&A, 435, 303
- (94) Steiner, J. E., & Damineli, A. 2004, ApJ, 612, L133
- (95) Sterken, C., van Genderen, A. M., de. Groot, M., & Burki, G. 1999, in ASP Conf. Ser. 179, Eta Carinae at the Millenium, ed. J.A. Morse, R.M. Humphreys, & A. Damineli (San Francisco: ASP), 200
- (96) ud-Doula, A. & Owocki, S. P. 2002, ApJ, 576, 413
- (97) Verner, E. M., Bruhweiler, F., & Gull, T. R. 2005, ApJ, 624, 973
- (98) Verner, E. M., Gull, T. R., Bruhweiler, F., Johansson, S., Ishibashi, K., & Davidson, K. 2002, ApJ, 581, 1154
- (99) Viotti, R., Rossi, L., Cassatella, A., Altamore, A., & Baratta, G. B. 1989, ApJS, 71, 983
- (100) Viotti, R., & Rossi, C. 1999, in ASP Conf. Ser. 179, Eta Carinae at the Millenium, ed. J.A. Morse, R.M. Humphreys, & A. Damineli (San Francisco: ASP), 211
- (101) Walborn, N. R. 1973, ApJ, 179, 517
- (102) Weigelt, G., & Ebersberger, J. 1986, A&A, 163, L5
- (103) Weigelt, G., Albrecht, R., Barbieri, C., et al. 1995, RevMexAA, 2, 11
- (104) Weis, K., Stahl, O., Bomans, D. J., Davidson, K., Gull, T. R., & Humphreys, R. M. 2005, AJ, 129, 1694
- (105) White, S. M., Duncan, R. A., Chapman, J. M., & Koribalski, B. 2005, in ASP Conf. Ser. 332, The Fate of the Most Massive Stars, ed R. M. Humphreys & K. Stanek, (San Francisco: ASP) 129.
- (106) Whitelock, P. A., Feast, M. W., Koen, C., Roberts, G., & Carter, B. S. 1994, MNRAS, 270, 364
- (107) Whitelock, P. A., Feast, M. W., Marang, F., & Breedt, E. 2004, MNRAS, 352, 447
- (108) Zanella, R., Wolf, B., & Stahl, O. 1984, A&A, 137, 79
- (109) Zethson, T., Johansson, S., Davidson, K., Humphreys, R. M., Ishibashi, K., & Ebbets, D. 1999, A&A, 344, 211
- (110) Zhang, H. L., & Pradhan, A. K. 1995, A&A, 293, 953
- (111) Zsargó, J., Hillier, D.J., & Georgiev, L.N. 2005, A&A, submitted