INTEGRAL survey of the Cassiopeia region in hard X rays
We report on the results of a deep 1.6 Ms INTEGRAL observation of the Cassiopeia region performed from December 2003 to February 2004. Eleven sources were detected with the imager IBIS-ISGRI at energies above 20 keV, including three new hard X-ray sources. Most remarkable is the discovery of hard X-ray emission from the anomalous X-ray pulsar 4U 0142+61, which shows emission up to 150 keV with a very hard power-law spectrum with photon index . We derived flux upper limits for energies between 0.75 MeV and 30 MeV using archival data from the Compton telescope COMPTEL. In order to reconcile the very hard spectrum of 4U 0142+61 measured by INTEGRAL with the COMPTEL upper limits, the spectrum has to bend or break between 75 keV and 750 keV. 1E 2259+586, another anomalous X-ray pulsar in this region, was not detected. INTEGRAL and COMPTEL upper limits are provided. The new INTEGRAL sources are IGR J00370+6122 and IGR J00234+6144. IGR J00370+6122 is a new supergiant X-ray binary with an orbital period of days, derived from RXTE All-Sky Monitor data. Archival BeppoSAX Wide-Field Camera data yielded four more detections. IGR J00234+6144 still requires a proper identification. Other sources for which INTEGRAL results are presented are high-mass X-ray binaries 2S 0114+650, Cas, RX J0146.9+6121 and 4U 2206+54, intermediate polar V709 Cas and 1ES 0033+595, an AGN of the BL-Lac type. For each of these sources the hard X-ray spectra are fitted with different models and compared with earlier published results.
Key Words.:
– Stars: neutron – Stars: supergiants – Stars: white dwarfs – X-rays: binaries – X-rays: individuals: 4U~0142+61, 1E~2259+586, IGR~J00370+6122, IGR~J00234+6144, 2S~0114+650, $γ$~Cas, RX~J0146.9+6121, 4U~2206+54, V709~Cas, 1ES~0033+595 – Gamma rays: observations1 Introduction
The INTErnational Gamma-Ray Astrophysics Laboratory INTEGRAL (Winkler et al. 2003) is ESA’s currently operational space-based hard X-ray/soft gamma-ray telescope. Since its launch in October 2002 it has been observing the sky at photon energies between 3 keV and 2 MeV. Aboard INTEGRAL there are two main hard X-ray/soft gamma-ray instruments, the imager IBIS (Ubertini et al. 2003) and the spectrometer SPI (Vedrenne et al. 2003), supplemented by two X-ray monitors, JEM-X (Lund et al. 2003) and an optical monitor, OMC (Mas-Hesse et al. 2003). These instruments are all wide-field instruments with observational coverage over a broad spectral band. In this work only INTEGRAL results from the low-energy detector of IBIS, called ISGRI (Lebrun et al. 2003), will be presented. IBIS-ISGRI is a coded-mask instrument with arcminute-resolution (12′ FWHM; Gros et al. 2003) imaging capabilities in the energy range from 20 keV to 300 keV. Its field of view (FOV) is (full width zero response). The most sensitive part of the FOV of a coded-mask instrument is the fully-coded FOV, which is for IBIS-ISGRI (see in’t Zand 1992, for detailed information on coded-mask instruments).
The main targets of our INTEGRAL observations are the young Galactic supernova remnants Cassiopeia A and Tycho. In this paper these sources will not be addressed in detail; we refer to Vink (2005) and Renaud et al. (2004) for more detailed studies. This paper presents results on compact hard X-ray sources detected in the deep 1.6-Ms observation of the Cassiopeia region. In this direction of the Galactic plane the line of sight crosses the Perseus arm at a distance of 3 kpc. One may expect that the majority of the sources are likely to be associated with this spiral arm. The detected sources are: (Anomalous X-ray Pulsar; AXP) 4U 0142+61, (high-mass X-ray binaries) 2S 0114+650, Cas, RX J0146.9+6121, 4U 2206+54, the newly discovered IGR J00370+6122, (intermediate polar) V709 Cas, (BL-Lac) 1ES 0033+595, and the currently unidentified newly discovered INTEGRAL source IGR J00234+6141. INTEGRAL-flux upper limits are provided for some transient sources and a second AXP (1E 2259+586) in this field.
For the two AXP sources, 0.75–30 MeV archival data from COMPTEL (Schönfelder et al. 1993) are reanalyzed, delivering constraining upper limits for 4U 0142+61. In an attempt to reveal the nature of IGR J00370+6122 archival data from the RXTE All-Sky Monitor and the BeppoSAX Wide-Field Cameras have been studied, as well as a Target of Opportunity (ToO) observation with RXTE PCA.
2 INTEGRAL observations and analysis
| Rev. | year | date | date | ||||||
|---|---|---|---|---|---|---|---|---|---|
| 142 | 2003 | Dec. | 12 | 15:46:50 | Dec. | 14 | 21:11:53 | 178. | 2 |
| 143 | 2003 | Dec. | 15 | 07:19:13 | Dec. | 17 | 21:16:51 | 206. | 8 |
| 144 | 2003 | Dec. | 18 | 07:15:25 | Dec. | 20 | 15:00:42 | 187. | 0 |
| 145 | 2003 | Dec. | 21 | 16:36:36 | Dec. | 23 | 20:59:51 | 173. | 8 |
| 146 | 2003 | Dec. | 24 | 18:50:50 | Dec. | 26 | 20:23:19 | 165. | 0 |
| 147 | 2003 | Dec. | 27 | 06:58:07 | Dec. | 29 | 20:43:13 | 206. | 8 |
| 148 | 2003 | Dec. | 30 | 06:51:06 | Jan. | 01 | 15:10:42 | 189. | 2 |
| 161 | 2004 | Feb. | 07 | 18:13:47 | Feb. | 09 | 18:17:17 | 163. | 2 |
| 162 | 2004 | Feb. | 10 | 17:37:54 | Feb. | 12 | 18:06:20 | 163. | 2 |
Our observations of the Cassiopeia region were made during nine orbital revolutions between December 12, 2003 and February 12, 2004 (see Table 1 for details). INTEGRAL performed the observations in a standard rectangular () dithering mode (Jensen et al. 2003). The data provided by the INTEGRAL Science Data Centre (ISDC; Courvoisier et al. 2003) were screened for Solar-flare events and erratic count-rate fluctuations due to passages through the Earth’s radiation belts. After screening, the net exposure of the fully-coded FOV was 1.6 Ms, from 677 pointings called Science Windows (ScWs). The data were reduced using the Off-line Scientific Analysis (OSA) software package version 4.2 (see Goldwurm et al. 2003, for IBIS-ISGRI scientific data analysis). For each ScW deconvolved IBIS-ISGRI sky maps were created in different energy ranges. These deconvolved sky maps were combined into mosaic maps.
The mosaics were examined for both known and potential new sources. Consistency checks are necessary to eliminate spurious artefacts. In addition to determining the detection significance, the correct source shape (Gaussian in approximation) and the presence or absence of systematic background structures in the maps were verified. In order to accept a source detection in this work, a significance above 3 in at least two (consecutive) energy intervals was required. Source detection significances ( for a background-dominated photon distribution) were determined in the mosaics for known sources at their catalog positions, and for candidate new sources at the positions in the sky maps with the highest detection significances.
For each source and energy band the time-averaged count rate was determined by averaging the count rates from each deconvolved ScW, weighted by the variance.
For converting subsequently count rates into flux values, the source spectra were normalized to the known Crab total spectrum (nebula and pulsar), using a rectangular dithering observation of the Crab performed during revolution 102 as reference. The source fluxes could, thus, be expressed in Crab units and converted in photon fluxes using the average Crab power-law spectrum () with photon index and normalization ph cm-2s-1 at 1 keV (Willingale et al. 2001). This relation is valid throughout the IBIS-ISGRI waveband up to 180 keV, as was verified by Kuiper et al. (2006). This method for deriving IBIS-ISGRI source spectra enables us to determine the spectra without detailed knowledge of the instrument response, which contained significant uncertainties at the time of our analyses.
Spectral-model fitting was performed with XSPEC version 11.3.1 (Arnaud 1996). For power-law fitting the PEGPWR model was used, which is a normal power law, but the program returns the power-law index and the unabsorbed power-law flux () in a chosen energy band instead of a normalization at a given energy to describe the spectrum. This model has been chosen in order to minimize the covariance between the parameters, resulting in the best error estimates.
All errors quoted in this paper are errors, unless stated otherwise.
3 Sky maps and source list
| Source | Exp. | Flux (mCrab) | Flux (mCrab) | Class | ||
|---|---|---|---|---|---|---|
| (ks) | 20–50 keV | 50-100 keV | ||||
| IGR J00234+6141 | 1606 | 0.72 | 0.12 | 1.4 | 0.3 | HMXB? |
| Tycho | 1606 | 0.43 | 0.12 | 1.1 | 0.3b | SNR |
| V709 Cas | 1606 | 3.84 | 0.12 | 2.8 | 0.4 | IP |
| 1ES 0033+595 | 1606 | 0.69 | 0.13 | 1.2 | 0.4b | BL-Lac |
| IGR J00370+6122 | 1606 | 0.78 | 0.13 | 1.1 | 0.4b | SXB |
| IGR J00370+6122a | 489 | 2.7 | 0.2 | 3.6 | 0.7 | |
| Gamma Cas | 1602 | 3.8 | 0.2 | 1.2 | 0.4b | BeXB |
| 2S 0114+650 | 1579 | 7.8 | 0.2 | 4.1 | 0.5 | SXB |
| 2S 0114+650a | 936 | 12.1 | 0.2 | 6.1 | 0.6 | |
| 4U 0142+61 | 1152 | 1.4 | 0.3 | 7.0 | 0.7 | AXP |
| RX J0146.9+6121 | 1133 | 1.6 | 0.3 | 1.5 | 0.8b | BeXB |
| 4U 2206+54 | 731 | 2.8 | 0.5 | 1.8 | 1.2b | BeXB |
| Cassiopeia A | 1609 | 3.54 | 0.13 | 1.8 | 0.4 | SNR |
1 mCrab (20–50 keV) ph cm-2s-1keV-1 , 1 mCrab (50–100 keV) ph cm-2s-1keV-1 ; a optimized data selection; b possibly contaminated by artefact in map. Values to be used with care or used as upper limits.
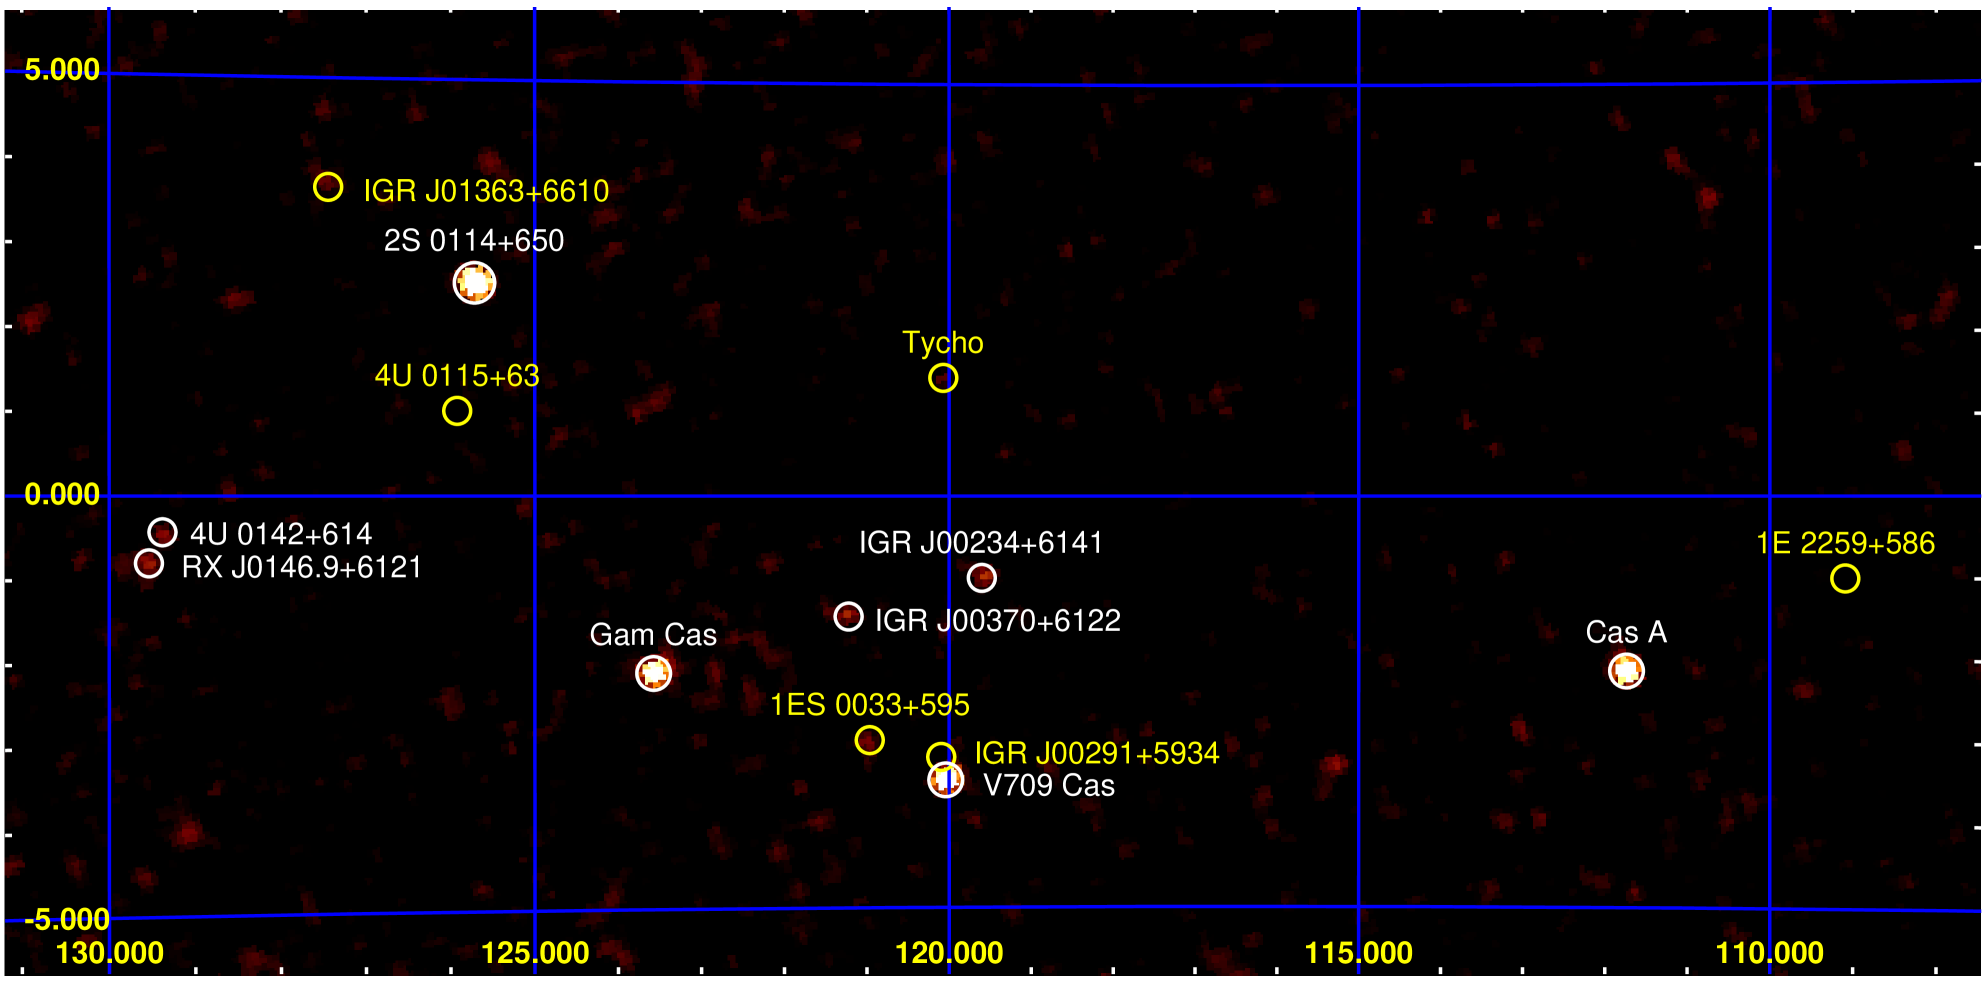
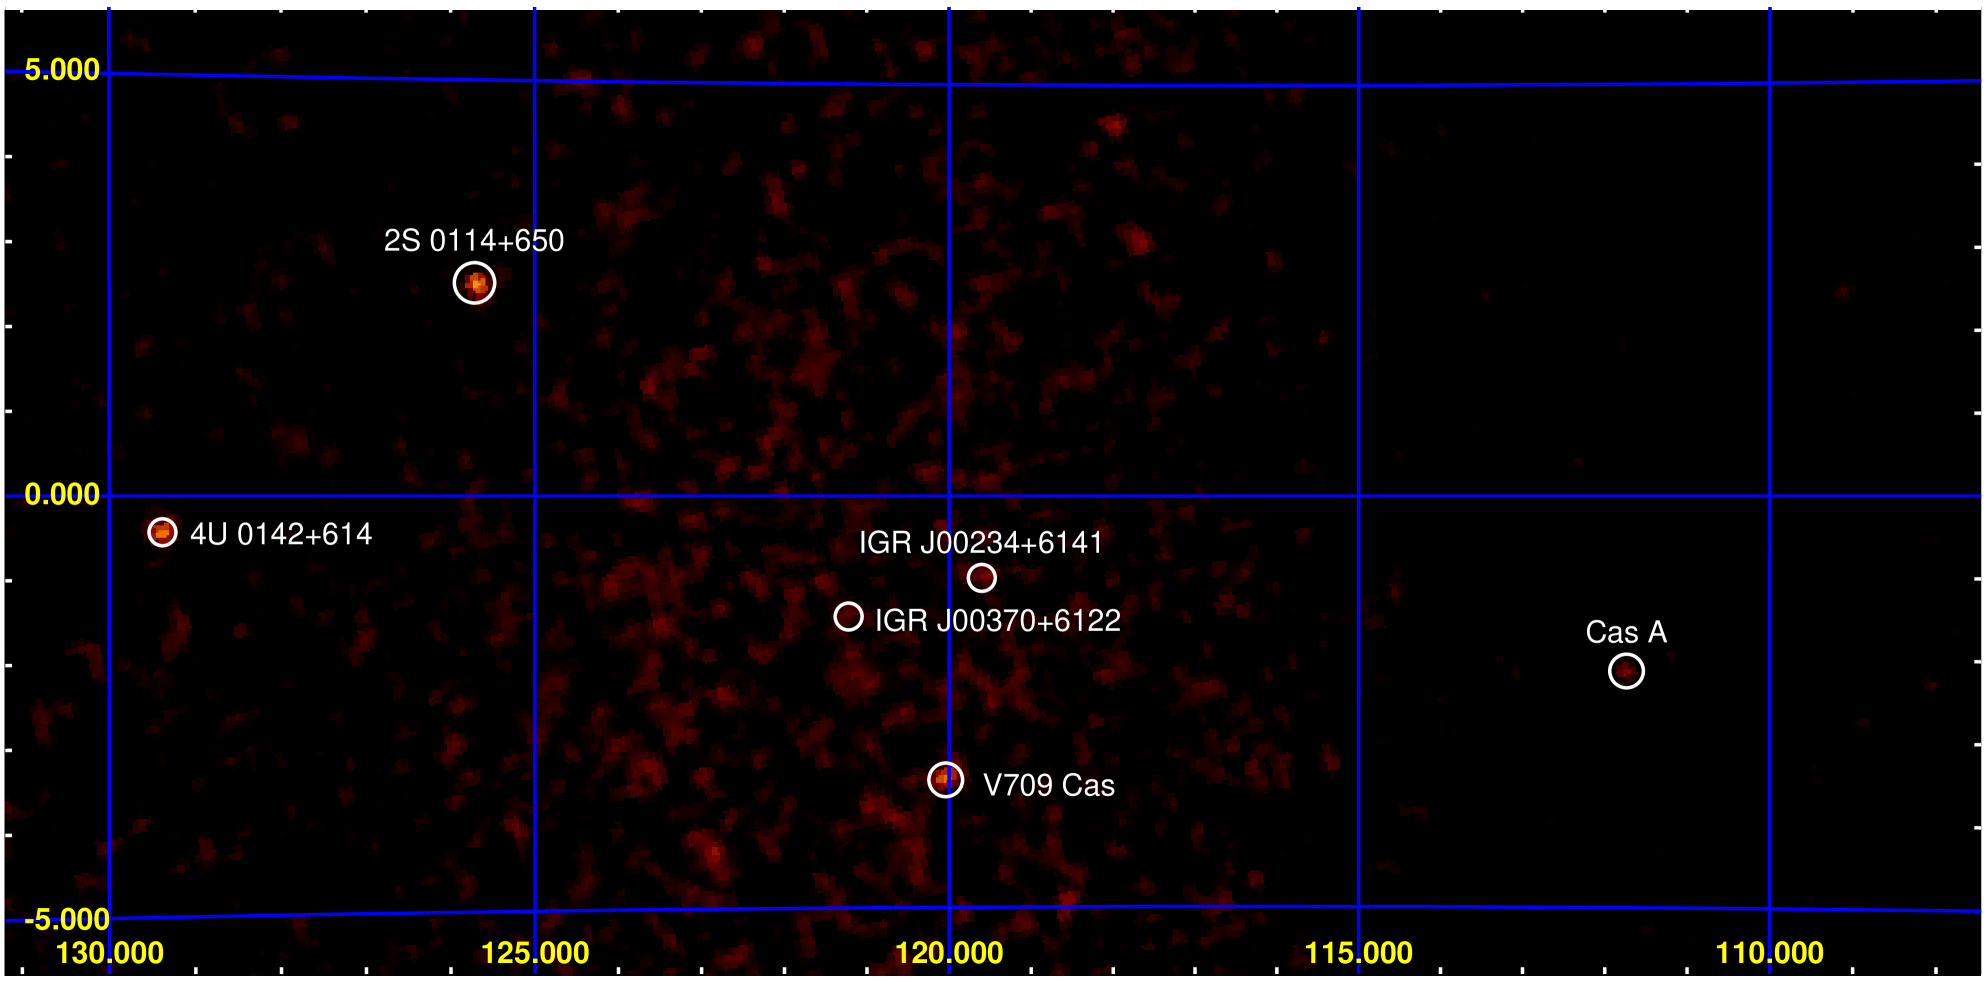
Figures 1 and 2 show sky maps of a large part of the Cassiopeia region in the energy bands 20–50 keV and 50–100 keV, respectively. For presentation purposes the sky regions at higher Galactic latitudes and below Galactic longitude were cropped off. As a result 4U 2206+54, located at , is not shown in Figures 1 and 2. The significantly detected sources that passed our consistency checks as mentioned in Sect. 2 are indicated by white circles and annotation. The yellow circles and annotation indicate weakly detected sources, transient sources, that were detected by INTEGRAL at other epochs and the second AXP in the field, 1E 2259+586, for which there is so far no INTEGRAL detection. The weak (one energy interval) detections and upper limits of the latter sources are given and discussed in Sects. 4.2 and 6. All (weakly) detected sources are listed in Table 2.
4 Anomalous X-ray pulsars
Anomalous X-ray pulsars, originally discussed as a subset of low-mass X-ray binaries (e.g. Hellier 1994; Mereghetti & Stella 1995), are members of a special subset of isolated neutron stars (see Woods & Thompson 2005, for a recent review). So far, there are seven established AXPs and one AXP candidate. Their spin periods () are found in a narrow range between 5.5 s and 11.8 s and their period derivatives () are of the order of s s-1. Their characteristic ages () indicate that they are young objects, though the characteristic age should be interpreted with care, especially for young neutron stars. However, the facts that all the Galactic AXPs (one is located in the SMC) are found within of the Galactic plane and that three of them are associated with supernova remnants (Gaensler et al. 2001) support their young nature. These pulsars are called anomalous, because their X-ray luminosities below 10 keV are orders of magnitude higher than the rotational energy losses. The magnetic field strengths of AXPs, , are of the order G, much stronger than estimated for normal (radio) pulsars ( G).
In order to explain the energy budget of the AXPs, the magnetar model (Thompson & Duncan 1993, 1996) is currently the most accepted model. This model was originally aimed at explaining phenomena observed in Soft Gamma-ray Repeaters (SGRs), but due to recent observations of similar behaviour of SGRs and AXPs, like bursting activity (Gavriil et al. 2002; Kaspi et al. 2003), they are now believed to originate from the same class of objects. This model also explains the glitching phenomena detected in the spin down of two AXPs (Kaspi & Gavriil 2003; Dall’Osso et al. 2003; Woods et al. 2004). The magnetar model postulates that AXPs and SGRs are powered by magnetic-field decay.
In the pre-INTEGRAL era AXPs were known as soft X-ray sources visible up to 10 keV. All AXP spectra, below 10 keV, could be described by a black-body component and a soft power law. However, this view has changed completely since INTEGRAL discovered hard X-rays above 20 keV from the direction of AXPs 1E 1841-045 and 1RXS J170849-400910 (Molkov et al. 2004; Revnivtsev et al. 2004a). In addition, den Hartog et al. (2004a) reported the INTEGRAL detection of 4U 0142+61, in a preliminary analysis of the data used in this work. Kuiper et al. (2004) provided definite evidence that the hard X-rays from the direction of 1E 1841-045 indeed originated from the AXP rather than the associated supernova remnant G27.4+0.0 (Kes 73). They showed that a significant fraction of the hard X-ray emission is pulsed, using RXTE PCA and HEXTE covering the same energy range as INTEGRAL. Also for AXPs 1RXS J170849-400910 and 4U 0142+61 Kuiper et al. (2006) subsequently found pulsed emission in the hard X-ray regime above 20 keV using archival RXTE data.
4.1 4U 0142+61

4U 0142+61 was detected by the Uhuru satellite in the early seventies (Giacconi et al. 1972; Forman et al. 1978). The nature of 4U 0142+61 was unclear for more than two decades, caused by source confusion with the nearby located high-mass X-ray binary RX J0146.9+6121 (24′ from the AXP, see section 5.3). With the discovery of RX J0146.9+6121 in ROSAT 0.1–2.4 keV data (Motch et al. 1991), Mereghetti et al. (1993) realized that the 25-minute periodicity, up to then attributed to 4U 0142+61 (White et al. 1987), was unlikely to originate from 4U 0142+61, because of the characteristics of the modulations. Hellier (1994) showed with ROSAT PSPC observations that this periodicity indeed originated from RX J0146.9+6121. The spin period of 8.7 seconds of 4U 0142+61 was discovered by Israel et al. (1994). They found that the rotational energy loss of 4U 0142+61 is not sufficient to explain its X-ray luminosity below 10 keV.
4U 0142+61 was the first AXP for which optical emission was discovered (Hulleman et al. 2000), which later turned out to be pulsed (Kern & Martin 2002). Hulleman et al. (2004) also discovered near-IR emission from this source, further studied by Morii et al. (2005) in simultaneous X-ray, near-IR and optical observations. They discovered in Subaru observations, that also the near-IR emission is pulsed (Morii et al. 2006, private communication). So far, no radio emission has been detected (Gaensler et al. 2001).
The soft X-ray spectrum observed with Chandra by Patel et al. (2003) shows a typical AXP spectrum. The spectrum can be fitted with a thermal black-body model with a temperature keV and a very soft power-law component with a photon index .
In this work no INTEGRAL-timing analysis has been performed for 4U 0142+61. This will be addressed in future work, exploiting also additional INTEGRAL observations.
4.1.1 4U 0142+61: INTEGRAL results
4U 0142+61 was significantly detected by INTEGRAL as a hard X-ray source (see Figs. 1 and 2; for a preliminary report see den Hartog et al. 2004a), even though this source is located from Cassiopeia A and from Tycho, therefore being always outside the fully-coded FOV of IBIS-ISGRI. In the sky-image mosaic with a total exposure of 1.15 Ms, 4U 0142+61 is detected with , and significances in the energy bands 20–50 keV, 50–100 keV and 100–150 keV, respectively.
The IBIS-ISGRI spectrum for energies above 20 keV, shown in Fig. 3, can be described by a power-law model with a photon index . This fit has a = 2.01 (dof = 7) and thus a null-hypothesis probability of 5% (see Table 3 and Fig. 4a for the fit residuals). Striking is the remarkable hardening of the spectrum above 10 keV when compared to the very-soft Chandra spectrum, also shown in Fig. 3. The transition occurs between the Chandra and IBIS-ISGRI energy windows where it can be studied with RXTE (Kuiper et al. 2006).

4.1.2 4U 0142+61: COMPTEL archival-data analysis
The Compton telescope COMPTEL (Schönfelder et al. 1993) aboard the Compton Gamma-Ray Observatory (CGRO, 1991–2000) is sensitive to gamma-ray photons between 0.75 MeV and 30 MeV, thereby covering the harder gamma-ray band adjacent to the INTEGRAL one. The very-hard spectrum measured with IBIS-ISGRI for 4U 0142+61 prompted us to reanalyze the COMPTEL data archive to search for a signal from 4U 0142+61. COMPTEL has a wide circular field of view covering 1 steradian. Therefore, during the long mission lifetime of CGRO, most of the sky, particularly the Galactic plane, has been viewed with long exposures. Sky maps and source parameters can be obtained with the maximum-likelihood method (de Boer et al. 1992), which is implemented in the standard COMPTEL data-analysis package. For the analysis and data selections the approach described by Zhang et al. (2004) was followed. The effective on-axis exposure time on this AXP, accumulated over the total mission, amounts to 4.2 Ms. Standard energy intervals were selected for the analysis. In the lower-energy intervals, 0.75–3 MeV and 3–10 MeV, weak, low significance () excesses were found. In the 10–30 MeV energy band no positive-flux measurement was derived. The upper limits for these energy intervals are ph cm-2s-1keV-1 , ph cm-2s-1keV-1 and ph cm-2s-1keV-1 , respectively. These are shown in Fig. 3, and can be directly compared with the hard X-ray spectrum. If the power-law spectrum fitted to the IBIS-ISGRI data extends to the MeV energy range, it would result in a photon flux of ph cm-2s-1keV-1 (0.75–3 MeV), i.e. a bright COMPTEL source, inconsistent with the COMPTEL upper limits. It shows that the spectrum has to bend or break below 0.75 MeV. To search for possible indications of this break in the IBIS-ISGRI data, a power-law model with a high-energy cutoff was fitted to the data. This resulted in a fit improvement of 2.34 with a of 7.9 for 2 extra free parameters (see Table 3 and Fig. 3). This fit gives an extremely hard power law in the lower energy part with a photon index = – 0.11 0.43 and a high-energy cutoff at 73 15 keV with an e-folding energy of 37 18 keV. With this model no significant flux is expected in the COMPTEL energy range. Figure 4b shows the residuals from the fits. We merely consider this fit improvement as a hint for a break. With recently performed additional INTEGRAL observations we expect to obtain tighter constraints.
| Power law (20–150 keV) | |
|---|---|
| erg cm-2s-1 | |
| (dof) | 2.01 (7) |
| Power law with High-Energy cutoff (20–150 keV) | |
| erg cm-2s-1 | |
| keV | |
| keV | |
| (dof) | 1.23 (5) |
| erg cm-2s-1 | |
4.2 1E 2259+586

1E 2259+586 has been very important for AXP research. Not only was it the first of the currently known AXPs recognized as a peculiar source (Fahlman & Gregory 1981), but it also played a key role in unifying AXPs and SGRs as magnetar candidates when this source showed more than 80 SGR-like bursts in 2002 (Kaspi et al. 2003). The soft X-ray spectrum, which can be described with a black body with a temperature keV and a very soft power-law with photon index , is a typical AXP spectrum (see Patel et al. 2001, for recent X-ray observations). Interestingly, Woods et al. (2004) observed significant spectral changes (for energies below 10 keV) before and after the 2002 outburst.
Contrary to 4U 0142+61, 1E 2259+586 is associated with a young supernova remnant G109.1-1.0 (CTB 109), which was discovered by Gregory & Fahlman (1980) (see also Rho & Petre 1997; Patel et al. 2001; Sasaki et al. 2004). The supernova remnant does not influence the INTEGRAL analysis as it is only detected up to 4 keV (Sasaki et al. 2004).
4.2.1 1E 2259+586: INTEGRAL results
1E 2259+586 is located only from Cassiopeia A (see Fig. 1). Therefore it was optimally exposed for 1.6 Ms in the fully-coded FOV. Even with the current high exposure, the sensitivity of INTEGRAL is not sufficient to detect this AXP above 20 keV. Only upper limits could be extracted from the IBIS-ISGRI data. In the energy bands 20–50 keV, 50–100 keV and 100–150 keV the upper limits are ph cm-2s-1keV-1 , ph cm-2s-1keV-1 and ph cm-2s-1keV-1 , respectively. Given the reported variability below 10 keV, the data were also analyzed in separate revolutions, but 1E 2259+586 was not detected.
4.2.2 1E 2259+586: COMPTEL archival-data analysis
Also for 1E 2259+586, analysis of COMPTEL archival data is performed as described for 4U 0142+61 in Sect. 4.1.2. The effective on-axis exposure time on 1E 2259+586, accumulated over the total mission, amounts to 4.9 Ms. As for 4U 0142+61 COMPTEL was not sensitive enough to significantly detect this AXP. The upper limits for the 0.75–3 MeV, 3–10 MeV and 10–30 MeV bands are ph cm-2s-1keV-1 , ph cm-2s-1keV-1 and ph cm-2s-1keV-1 , respectively. The upper limits are shown in Fig. 5, together with the IBIS-ISGRI upper limits and spectral fits to two different spectra measured below 10 keV by Chandra (Patel et al. 2001) and by XMM-Newton (Woods et al. 2004). A spectral shape including a hard spectral tail like measured for 4U 0142+61 (Fig. 3), is allowed by all upper limits above 10 keV.
Recently Kuiper et al. (2006) detected pulsed emission up to 24 keV with the RXTE-PCA, indicating the likely onset of a hard tail, which is still consistent with the upper limits derived in this work. This detection is promising for a future INTEGRAL detection. The total exposure on 1E 2259+586 will be more than 5 Ms by the end of 2006.
5 Binaries

Since launch, INTEGRAL has discovered 107 new hard X-ray sources111see http://isdc.unige.ch/rodrigue/html/igrsources.html for the complete IGR-sources list, among which a large number of binaries (see e.g. Revnivtsev et al. (2004a, b); Molkov et al. (2004, 2005); Bird et al. (2004, 2006) and references therein). One of the important discoveries of INTEGRAL is the discovery of a previously missed class of objects, namely highly absorbed High-Mass X-ray Binaries (HMXBs) (; see Kuulkers 2005, for a recent review).
HMXBs can be divided in two classes (Corbet 1986): the Be X-ray binaries (BeXBs) and the supergiant X-ray (SXBs) binaries, which have an OB supergiant or a bright giant as donor star. Currently there are about 150 HMXBs known, out of which 65 are located in our own Galaxy. Of these 150 systems, about 20 are of the supergiant class. From the new INTEGRAL sources, for which follow-up observations are performed, already 10 are identified as supergiant X-ray binaries with a high intrinsic absorption. Including the new INTEGRAL SXBs, the sample of SXBs has grown to about 30. See e.g. Negueruela (2005); Negueruela et al. (2006) and Lutovinov et al. (2006) for the latest developments and implications of the newly found HMXBs by INTEGRAL.
In this section the binaries that were detected in the Cassiopeia field (see Table 2) are introduced and the results are presented. It concerns four HMXBs, one Intermediate-Polar (IP) and the new source IGR J00234+6141 which is most likely an HMXB.
5.1 2S 0114+650
2S 0114+650 is a supergiant X-ray binary. The supergiant companion LSI~ $+65^∘010$ is of the B1Ia type (Reig et al. 1996). This system exhibits X-ray modulations with a period of 2.7 hours (Finley et al. 1992; Corbet et al. 1999; Bonning & Falanga 2005) which are interpreted as originating from the neutron star’s spin - the slowest known to date. The orbital period of 11.59 days (Crampton et al. 1985) is quite normal for a SXB. Recently, Farrell et al. (2004) found evidence for a super-orbital period of 30.7 days, which they interpret as an indication for the presence of a precessing warped accretion disk.
2S 0114+650 has been observed in the soft X-ray band several times (10 keV; e.g. Hall et al. 2000; Apparao et al. 1991). However, before INTEGRAL little information was available for the high-energy part of the spectrum. Koenigsberger et al. (1983) published an OSO-8 spectrum taken in 1976, which could be fitted with a hard power law with photon index and a high-energy cutoff 14 keV. The source was detected up to 30 keV.
5.1.1 2S 0114+650: INTEGRAL results

INTEGRAL observed 2S 0114+650 for 1.58 Ms. It was detected at significance levels of and in the 20–50 keV and 50–100 keV bands, respectively. The light curve, presented in Fig. 6, shows a variable source with periods of flaring and quiescence, both lasting of the order of less than a day to days. This source is known to show flaring activity adding up to a single broad pulse when folding with the orbital ephemeris over a long time span (Koenigsberger et al. 1983; Apparao et al. 1991; Corbet et al. 1999; Hall et al. 2000). Using an ephemeris (maximum flux expected at MJD = ) created with the available online RXTE-ASM data (MJD 50087–53100), we find that the phases of the flares are distributed consistently over the phase interval of the broad time-averaged pulse.

For the spectral analysis, four time intervals in which the source was in a weak/quiet state are omitted. The omitted intervals in MJD are: 52988–52990, 52992–52996, 52997–53000 and 53004–53006 (these intervals are indicated in Fig. 6). The remaining data consist of 374 ScWs adding up to an exposure of 935.8 ks. For this selection of observation times the detection significances increased to and in the 20–50 keV and 50–100 keV bands, respectively.
The time-averaged high-energy spectrum (20–150 keV) of 2S 0114+650 is shown in Fig. 7. A fit with a single power-law model () gives an acceptable fit up to 150 keV (see Table 4 and Fig. 8a). A more physical thermal-bremsstrahlung model could not fit the data satisfactorily up to 150 keV. Above 70 keV it underestimates the high-energy flux and the fit is therefore not acceptable (see Table 4 and Fig. 8b). Adding a power-law component to the bremsstrahlung model, a good fit is achieved. However, statistically it can not be favoured over, nor distinguished from the single power-law model (see Table 4 and Fig. 8a,c). To explain the hardest part of the spectrum comptonization models are invoked. The models by Titarchuk (1994, compTT) and Poutanen & Svensson (1996, compPS) are able to model the high-energy part of the spectrum better than the bremsstrahlung model, but the parameters are poorly constrained. Therefore the high-energy tail which has been observed by INTEGRAL for the first time can be described by either comptonization in a thermal or non-thermal plasma. It is not clear whether it originates in a hot corona or in a putative accretion disk. The accretion-disk scenario, however, is less likely for SXB systems.
Recently Filippova et al. (2005) and Bonning & Falanga (2005) have independently observed 2S 0114+65 with INTEGRAL. Filippova et al. (2005) caught the source in a low state and measured a simple power law () which is marginally consistent () with our findings. Bonning & Falanga (2005) observed 2S 0114+6 for 180 ks in December 2004. They find similar results compared to Hall et al. (2000) combining JEM-X and IBIS-ISGRI data. Their best-fit model is a power law with a high-energy cutoff: photon index and high-energy cutoff keV with an e-folding energy keV (90% errors). Fitting our data with these parameters, leaving the normalization free, gives an unacceptable fit. This model also fails to fit the hard tail and therefore underestimates the flux above 70 keV. Already in their spectrum it can be seen that the model is below their data points above 70 keV, but just because of the larger statistical errors their model was still acceptable to describe their spectrum. Bonning & Falanga (2005) note the indication for a possible cyclotron absorption feature at 44 keV. Our data do not confirm this indication, despite the much longer exposure time.
Even more recently, Masetti et al. (2005) published results from a BeppoSAX observation of 63 ks with the narrow field instruments, sensitive between 0.1 keV and 300 keV. The spectrum of 2S 0114+65 is determined in the 1.5–100 keV band. Their findings agree with the findings of Bonning & Falanga (2005), except that they also do not find evidence for a cyclotron absorption line. Compared to our spectrum their fit results also fail to detect the hard tail.
| Power law (20–150 keV) | |
|---|---|
| erg cm-2s-1 | |
| (dof) | 1.21 (14) |
| Bremsstrahlung (20–150 keV) | |
| keV | |
| norm | |
| (dof) | 2.45 (14) |
| erg cm-2s-1 | |
| Bremsstrahlung + Power law (20–150 keV) | |
| keV | |
| norm | |
| 2.0 0.7 | |
| erg cm-2s-1 | |
| (dof) | 1.12 (12) |
| erg cm-2s-1 | |
5.2 Cas
Cas is a bright B0.5 IVe star and represents the prototypical Be star (Secchi 1867). It was discovered in X-rays by Jernigan (1976) and Mason et al. (1976). The X-ray characteristics of Cas made it a peculiar star because its X-ray luminosity is several times higher than measured for other Be stars, but 20 times weaker than the weakest BeXB (Murakami et al. 1986). Through radial velocity analysis of spectral lines, it was found to be a binary (Harmanec et al. 2000).
Determining whether the nature of the compact companion is a neutron star or a white dwarf was a challenge for a long time. Rappaport & van den Heuvel (1982) argued that the X-ray luminosity of erg s-1 combined with a wide orbit, and the hardness of its spectrum, support a neutron-star companion. However, most authors agree that a white dwarf companion is more likely: its spectrum can be fitted with a thermal optically thin plasma with an extremely high temperature of 10–12 keV; a strong Fe emission line at 6.8 keV with an equivalent width of 280 eV is present (Murakami et al. 1986; Owens et al. 1999); and also rapid fluctuations on timescales of seconds hinting towards a white-dwarf companion are detected (Kubo et al. 1998; Smith et al. 1998).
Owens et al. (1999) observed Cas with BeppoSAX. The spectrum of Cas could be extracted up to 30 keV with the HPGSPC and 40 keV with the PDS. The best fit to their X-ray spectrum from 0.2–40 keV is achieved with a MEKAL model (Mewe et al. 1995) with an additional Carbon line (at 0.3 keV), or a two component MEKAL model. The temperature of the hot plasma in both models is keV.
5.2.1 Cas: INTEGRAL results

INTEGRAL detected Cas with high significance up to 50 keV (). Between 50 keV and 100 keV a 3 flux point is measured (see Table 2), however, this flux point is likely contaminated by surrounding artefacts. For this reason it was discarded in the spectrum, shown in Fig. 9.
The INTEGRAL spectrum of Cas can best be described by a power-law model with a high-energy cutoff. However, the residuals are large. With = 2.81 (dof = 4) and thus a null-hypothesis probability of 2.4%, this fit can hardly be considered statistically acceptable. However, other models, like a single power law ( = 7.32, dof = 6) or a bremsstrahlung model ( = 4.77, dof = 7), result in significantly worse fits. This is due to the very low flux in the 40–50 keV bin with respect to the 20–40 keV spectrum, requiring a cutoff.
A bremsstrahlung fit over the 20–40 keV interval yields a temperature of (13.6 1.5) keV with = 1.44 (dof = 5), which is (within errors) comparable to the temperature found by Owens et al. (1999). However, over the 20–50 keV energy range the best-fit temperature is keV. This temperature is in agreement with reports by Kubo et al. (1998) and Smith et al. (1998), but the quality of the bremsstrahlung fit to our spectrum is unacceptable.
The spectral properties of Cas are more reminiscent of a typical HMXB spectrum than a WD-binary spectrum, leaving the question about the nature of the compact companion still open.
| Power law with High-Energy cutoff (20–50 keV) | |
|---|---|
| erg cm-2s-1 | |
| keV | |
| keV | |
| (dof) | 2.81 (4) |
| erg cm-2s-1 | |
| Bremsstrahlung (20–40 keV) | |
| keV | |
| norm | |
| (dof) | 1.44 (5) |
| erg cm-2s-1 | |
5.3 RX J0146.9+6121
RX J0146.9+6121 (V* V831 Cas), a BeXB located 24′ from AXP 4U 0142+61 (see section 4.1), was discovered by Motch et al. (1991) with ROSAT. Its companion star (LS~I~+61~235) was spectrally classified as a B1Ve by Reig et al. (1997). White et al. (1987) discovered a 25 minutes periodicity which was then attributed to AXP 4U 0142+61. However, Hellier (1994) proved that this periodicity originated from RX J0146.9+6121, using the ROSAT-PSPC imager. RX J0146.9+612 also shows long-term, up to an order of magnitude, variability (Haberl et al. 1998a).
X-ray spectra derived from ASCA, RXTE and BeppoSAX data (Haberl et al. 1998b, a; Mereghetti et al. 2000) could be modelled up to 25 keV with power laws with or without high-energy cutoffs or with bremsstrahlung models. However, the spectra derived from the non-imaging instruments onboard RXTE and BeppoSAX are contaminated by 4U 0142+61. For the soft X-ray spectrum (10 keV) the contribution of 4U 0142+61 was corrected for by including fixed model parameters, but for the hard X-ray spectrum (10 keV) the contribution of 4U 0142+61 was still unknown. The GIS instrument onboard ASCA was able to resolve RX J0146.9+6121 and 4U 0142+61 in the 0.5–10 keV band.
5.3.1 RX J0146.9+6121: INTEGRAL results
Like AXP 4U 0142+61, this source was always in the partially-coded FOV of IBIS-ISGRI with a total exposure of 1.13 Ms. With the high spatial resolution of INTEGRAL it is possible to resolve RX J0146.9+6121 and the AXP, and therefore there is no source confusion. In the 20–50 keV mosaic the source is detected with a detection significance of 5.3 with a corresponding photon flux of ph cm-2s-1keV-1 . In narrow-band (5 keV) mosaics the source is only detected in the 20–25 keV and 25–30 keV bands with photon fluxes ph cm-2s-1keV-1 () and ph cm-2s-1keV-1 (), respectively. In the 30–40 keV band RX J0146.9+6121 is still (just) visible with ph cm-2s-1keV-1 (), but in the 40–50 keV band only a 2 upper limit of ph cm-2s-1keV-1 could be extracted. We fitted a power-law model to these data points to obtain an indication for the photon index and flux. The photon index is with a flux erg cm-2s-1 (20–40 keV).
Comparing these results with the previously published results from Haberl et al. (1998b, a) and Mereghetti et al. (2000), our data points nicely extend the previously observed spectra. Leaving the normalization as the only free parameter, acceptable fits can be found for all reported fits, except for one, namely the single power-law fit with photon index observed with ASCA (Haberl et al. 1998b), does not give an acceptable fit to our data points. However, the bremsstrahlung model fitted to the same ASCA data returns the best slope for the INTEGRAL energy band between 20 and 40 keV. The fluxes in the 0.5–10 keV band are also comparable with erg cm-2s-1 for ASCA and erg cm-2s-1 for INTEGRAL (extrapolated towards lower energies). The power-law with a high-energy cutoff model (, , ), fitted to RXTE data Mereghetti et al. (2000), gives a slightly too steep spectral slope in the INTEGRAL energy range. However, their normalization of this power law is in full agreement with the towards lower energies extrapolated INTEGRAL normalization of erg cm-2s-1 .
Recently, Filippova et al. (2005) reported the detection of RX J0146.9+6121 with independent INTEGRAL observations. They reported a weak detection of 3 mCrab (18–60 keV) and a spectrum fitted with a single power law with photon index . The slopes of our spectra are fully consistent, however during their observation the source was about twice as bright.
5.4 IGR J00370+6122
5.4.1 IGR J00370+6122: Discovery and identification
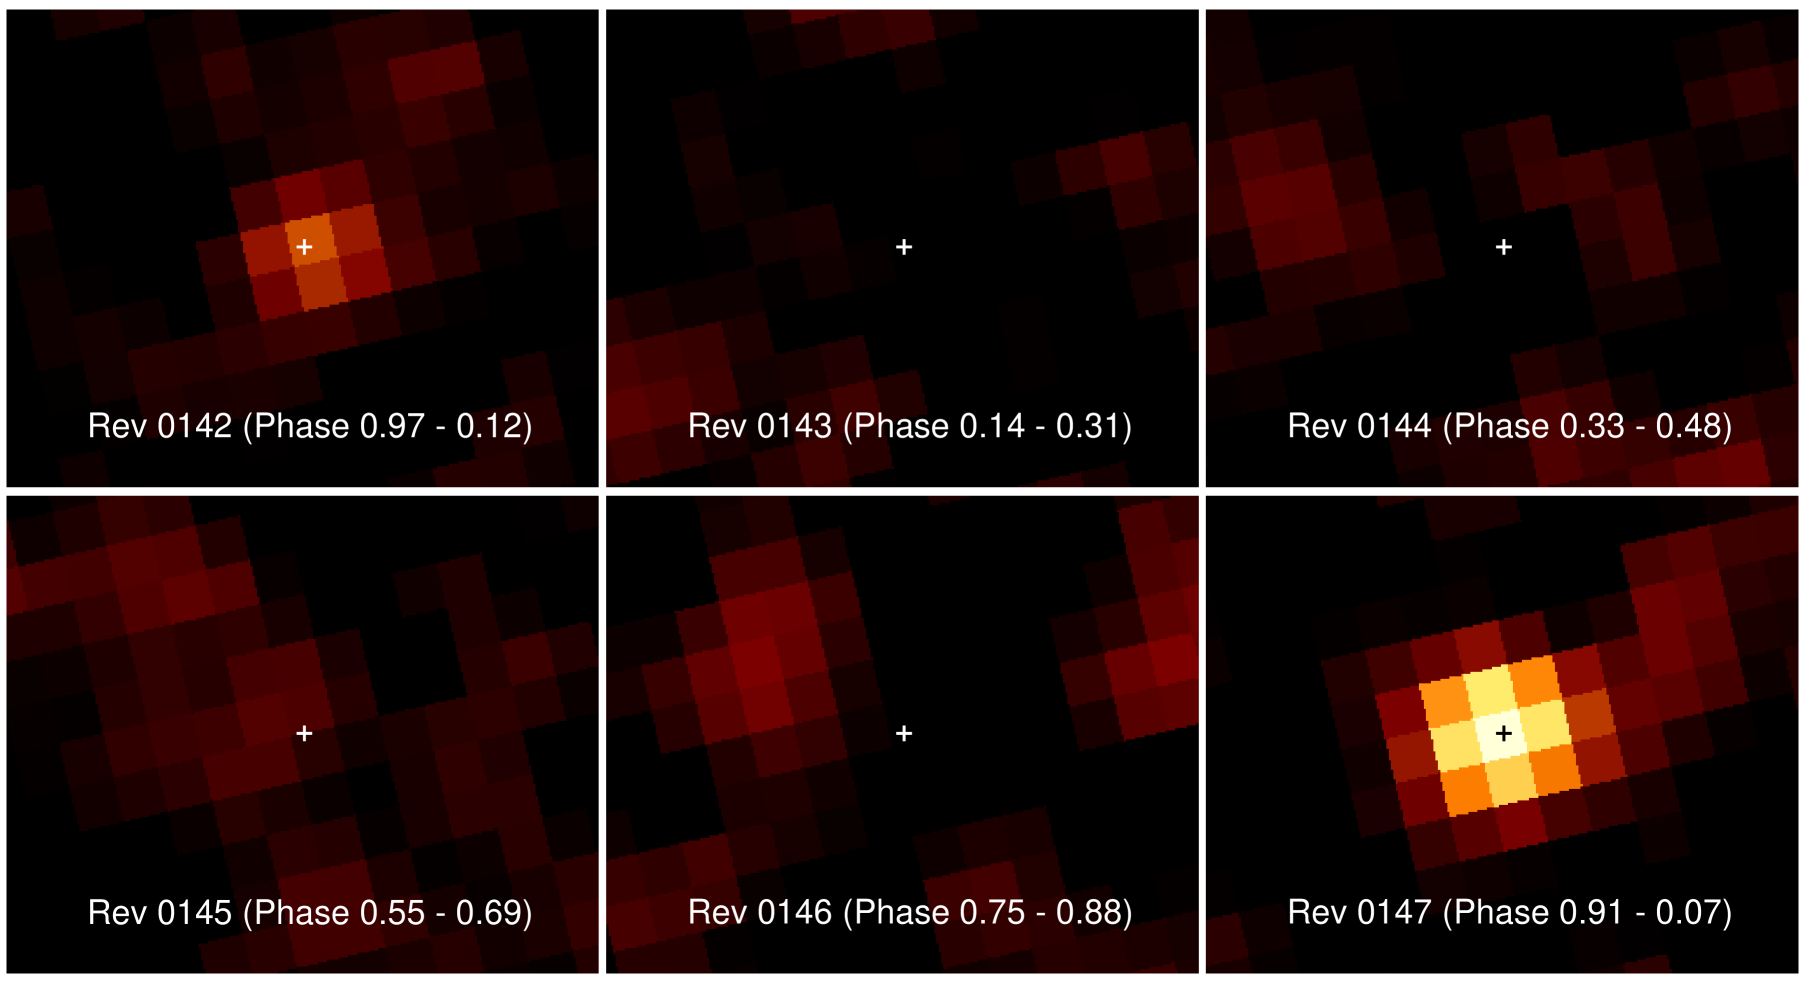
IGR J00370+6122 is the first newly found INTEGRAL source in the Cassiopeia region (den Hartog et al. 2004b). The source did not show up in the integrated mosaics of revolutions 142–148 (1.6 Ms), but it did appear in two single revolutions. For this paper the data were reanalyzed with OSA 4.2, confirming our initial results (see Fig. 10). The source is significantly detected in revolution 147 with a significance of and a flux of ph cm-2s-1keV-1 (4.6 mCrab) in the 20–50 keV energy band. In the other revolutions the source is not detected except in revolution 142 where it appeared more weakly with a significance of and a flux of ph cm-2s-1keV-1 (2.1 mCrab, 20–50 keV).
We redetermined the source position in the 20–50 keV mosaic of revolution 147: R.A. = , Decl. = (J2000) with an estimated 2′ accuracy (90% confidence), which is 037 from the originally distributed coordinates (den Hartog et al. 2004b).
A search through SIMBAD yields a possible ROSAT X-ray counterpart, 1RXS J003709.6+612131 (Voges et al. 1999), located only 043 from the updated coordinates. The ROSAT source has an optical counterpart within its 17″ error radius, namely a 10th-magnitude (B and V bands) B1Ib supergiant, BD~+60~73 (Rutledge et al. 2000). Follow-up optical observations by Reig et al. (2005) reassessed the spectral type of BD +60 73 to be BN0.5II-III, which belongs to the bright giant class. The estimated distance to the source is 3 kpc. No radio emission is found from this source in the NVSS online archive. Also Cameron et al. (2004) did not find a radio signal with new VLA observations.
We obtained a RXTE All-Sky Monitor (RXTE-ASM) light curve (MJD 50087–53124) and found a periodicity of (15.665 0.006) days. The folded light curve in Fig. 11 shows a single peak with a peak flux of 3.3 mCrab and a quiescent level below 1 mCrab (after subtracting a 1 mCrab systematic bias). The peak flux remains above 2 mCrab for 3 days. The epoch of maximum flux during the INTEGRAL and contemporaneous RXTE-ASM observations is MJD 53001.7 0.3. A HMXB with an eccentric orbit where the compact object is accreting from wind accretion near periastron, can exhibit a light curve like in Fig. 11. Therefore this periodicity can be interpreted as the orbital period of a binary system.
Using this ephemeris we found that the detections during revolutions 142 and 147 fall within orbital phases 0.97–1.12 and 0.91–1.07, respectively, both at epochs of expected maximum flux. This shows that IGR J00370+6122 is indeed the hard X-ray counterpart of the variable source which was found with RXTE-ASM and is most likely 1RXS~J003709.6+612131.
To derive an IBIS-ISGRI spectrum we selected only ScWs falling within the orbital-phase window 0.8–1.2, resulting in 489 ks of exposure. IGR J00370+6122 is detected up to 80 keV. The spectrum is shown in Fig. 12 and can be fitted with a single power-law model with a photon index of (see Table 6).

5.4.2 IGR J00370+6122: BeppoSAX archival observations
BeppoSAX (Boella et al. 1997), operational for six years between April 1996 and April 2002, observed this field with the Wide-Field Cameras (WFCs; Jager et al. 1997) serendipitously on a regular basis, resulting in a total exposure of 1.37 Ms. We revisited these data and detected IGR J00370+6122 on four occasions in one-day averaged time bins. The spectral data were extracted in 31 channels between 2 and 28 keV. Channels 1, 2 and 31 are not well calibrated and were excluded. The 2–28 keV fluxes of the detections are mCrab (MJD 50840.1776–50841.3167), mCrab (MJD 50980.1576–50981.2459), mCrab (51135.8108–51136.4929) and mCrab (MJD 51371.9518–51373.0377). All four detections are within 0.1 orbital period from the expected peak as derived from the ASM light curve. The WFCs have covered 23 more epochs between orbital phase 0.9 and 1.1, but the source was not detected in any of these observations with upper limits less than 2 mCrab. This indicates the variable nature of the peak maxima. The spectrum of the brightest maximum is shown in Fig. 12. The data are fitted with an absorbed power law () (see Table 6).
5.4.3 IGR J00370+6122: RXTE ToO observations
In order to search for a possible X-ray pulsar we proposed a public ToO observation with RXTE (Bradt et al. 1993), which was approved. Two short observations were performed on 2004-05-19 and 2004-06-02 (928 s and 3728 s; observation ID: 90415-01). The first observation was performed near orbital phase 0.14, which is during the decaying part of the peak. The second observation was performed near orbital phase 0.02, which is at the maximum of the peak. In both observations, however, the source was found to be in a low state with fluxes of 1.4 and 1.1 mCrab, respectively. In Fig. 12 the background subtracted spectrum of the longest RXTE observation is shown. The data are modeled with an absorbed power-law (, see Table 6). Within the errors the spectra of both observations are similar.

| INTEGRAL: Power law (20–80 keV) | |
|---|---|
| erg cm-2s-1 | |
| (dof) | 1.62 (3) |
| BeppoSAX: Power law (2–20 keV) | |
| erg cm-2s-1 | |
| (dof) | 1.00 (21) |
| RXTE: Power law (3–20 keV) | |
| erg cm-2s-1 | |
| (dof) | 0.45 (39) |
5.4.4 IGR J00370+6122: Variability and absorption
The INTEGRAL, BeppoSAX and RXTE spectra in Fig. 12 clearly show that the activity of the source varies widely from orbit to orbit. We compare the three observations in the 5–20 keV band, to minimize effects due to possible absorption variations. During the (brightest) BeppoSAX observation, the flux was erg cm-2s-1 , while during the RXTE observation, the flux was an order of magnitude less with erg cm-2s-1 . The (towards lower energies extrapolated) flux estimated from the INTEGRAL observations falls in between the BeppoSAX and RXTE observations with a flux of erg cm-2s-1 .
Comparing the BeppoSAX and the RXTE spectra, i.e. the most extreme flux measurements, show similar power laws, for the RXTE data and for the BeppoSAX data. The fitted absorption () to the BeppoSAX data of is a factor of two higher than the fitted absorption to the RXTE data of . However, due to the large error on the BeppoSAX value it is impossible to verify whether the intrinsic absorption differs from one maximum to another.
5.5 V709 Cassiopeia (V709 Cas)
V709 Cas was recognized as an Intermediate Polar (IP) by Haberl & Motch (1995). IPs represent a subclass of Cataclysmic Variables (CVs) which consist of a weakly ( G) magnetized White Dwarf (WD) showing asynchronous rotation and accretion from a Roche-lobe filling low-mass companion star (see Patterson 1994, for a review). Haberl & Motch (1995) found the WD spin period of 312.8 seconds. The orbital period was determined to be 5.34 hours by Bonnet-Bidaud et al. (2001). IPs are hard X-ray sources. The hard X-ray photons are believed to originate from the post-shock region above the magnetic poles. Their X-ray spectra can be described by a thermal optically-thin bremsstrahlung model with plasma temperatures of tens of keV. de Martino et al. (2001) observed V709 Cas with BeppoSAX and RXTE. The time-averaged spectrum can be modeled with a plasma of temperature = 27 keV, plus a reflection component from the white-dwarf surface. The BeppoSAX PDS could observe V709 Cas up to 70 keV. The spin modulation was observed up to 25 keV with a decreasing amplitude at higher energies, which is typical for IPs.

| Power law (20–70 keV) | |
|---|---|
| erg cm-2s-1 | |
| (dof) | 2.18 (8) |
| Bremsstrahlung (20–70 keV) | |
| keV | |
| norm | |
| (dof) | 2.49 (8) |
| erg cm-2s-1 | |
| Bremsstrahlung (20–50 keV) | |
| keV | |
| norm | |
| (dof) | 1.37 (6) |
| erg cm-2s-1 | |
| For all models the Galactic absorption was fixed at | |
5.5.1 V709 Cas: INTEGRAL results
With a total exposure time of 1.6 Ms, V709 Cas is detected up to 70 keV (see Fig. 13). The best achieved fit of this spectrum is a power-law model (, see Table7). However, with = 2.18 (dof = 8) the fit is not really acceptable. When fitted with a thermal-bremsstrahlung model the fit is similarly unsatisfactory with = 2.49 (dof = 8). The high is due to the flux values in the 40–50 keV and 50–60 keV energy intervals, but there is no reason to discard these, since we did not find similar discrepancies in our sample of source spectra. Nevertheless, an acceptable fit can only be achieved when the energy bins above 50 keV are ignored. The spectrum of V709 Cas in the 20–50 keV energy range can then be described by a thermal-bremsstrahlung model ( = 1.37; dof = 6), with a plasma temperature keV. However, the plasma temperatures for the bremsstrahlung fits in both energy ranges are comparable. Compared with the results of de Martino et al. (2001), the temperatures are significantly lower. However, they used a bremsstrahlung model including a reflection component from the WD. A reflection bump and a higher plasma temperature can mimic the spectral slope of a simple bremsstrahlung model with a lower plasma temperature. Fitting our spectrum with the spectral shape modeled by de Martino et al. (2001) (model SAX #2; keV including a reflection component), leaving the normalization as only free parameter, gives an unacceptable fit with = 3.4 (dof = 9). The towards lower energies extrapolated unabsorbed flux (2–10 keV) of erg cm-2s-1 is similar ( lower) to the flux measured with BeppoSAX. Adding the plasma temperature as second free parameter, the fitted temperature is keV (somewhat higher than without a reflection component) with an unabsorbed flux erg cm-2s-1 ( = 2.8; dof = 8).
Falanga et al. (2005a), in a parallel study of a shorter IBIS-ISGRI observation of V709 Cas (revolutions 262 and 263 for 181.9 ks), derived a spectrum which they can also describe with a bremsstrahlung model. Their plasma temperature ( keV) is higher, but statistically consistent with our results.
5.6 IGR J00234+6141
IGR J00234+6141, the second new INTEGRAL source detected in the Cassiopeia field, has no proper identification yet. The source was detected in the mosaics for all available data, with a total exposure of 1.6 Ms. IGR J00234+6141 is seen as a weak source ( mCrab) with a significance of in the energy band 20–50 keV and with a significance of ( mCrab) in the 50–100 keV band, corresponding to ph cm-2s-1keV-1 and ph cm-2s-1keV-1 , respectively. The best source position is R.A. = , Decl. = +61°41′32″ (J2000) with an estimated 3′ accuracy (90% confidence level), derived in the 20–30 keV mosaic where the source is detected with significance.
Archival searches through SIMBAD yielded a possible ROSAT soft X-ray counterpart, 1RXS~J002258.3+614111 (Voges et al. 1999), which is located 315 from the INTEGRAL centroid. It is marginally consistent with the INTEGRAL position. The RXTE-ASM revealed a marginal detection, but no modulation was found in the light curve. No reliable optical or IR counterpart can be found in the INTEGRAL error box, because of the crowded field. Online available radio data from NVSS showed no radio source.
Given its position close to the Galactic plane (b = -10), the lack of a radio counterpart and the nature of the majority of previously reported new INTEGRAL sources near the Galactic plane, it is more likely to be an X-ray binary, than an extragalactic source.
6 Weakly and non-detected sources
In this section information can be found on additional sources that have been weakly detected during this Cassiopeia-region survey, or have been detected with INTEGRAL at other epochs. The sources 4U 2206+54 and 1ES 0033+595 are only detected in one energy band with a significance greater than . 4U 0115+63, IGR J00291+5434 and IGR J01363+6610 were not detected during our observations.
| Source (Class): Exposure | |||
|---|---|---|---|
| Energy band | Flux (ph cm-2s-1keV-1 ) | Significance | |
| 4U 2206+54 (BeXB): 731 ks | |||
| 20–30 keV | |||
| 30–40 keV | |||
| 1ES 0033+595 (BL-Lac): 1.6 Ms | |||
| 20–30 keV | |||
| 30–40 keV | UL | ||
| 4U 0115+63 (BeXB): 1.58 Ms | |||
| 20–50 keV | UL | ||
| 50–100 keV | UL | ||
| 100–150 keV | UL | ||
| IGR J00291+5434 (accreting msec pulsar): 1.6 Ms | |||
| 20–50 keV | UL | ||
| 50–100 keV | UL | ||
| 100–150 keV | UL | ||
| IGR J01363+6610 (BeXB): 1.1 Ms | |||
| 20–50 keV | |||
| 50–100 keV | UL | ||
| (a) likely artefact | |||
6.1 4U 2206+54
BeXB 4U 2206+54 is a hard X-ray source (Giacconi et al. 1972) with BD~+53 2790 as optical counterpart (Negueruela & Reig 2001). The orbital period is 9.6 days (Corbet & Peele 2001). Observational evidence indicate that the compact companion is most likely a neutron star (Corbet & Peele 2001; Torrejón et al. 2004; Masetti et al. 2004; Blay et al. 2005).
4U 2206+54 is located more than 11 degrees from Cassiopeia A. Therefore, the available exposure of 731 ks was completely obtained in the partially-coded FOV of the IBIS-ISGRI detector. Nevertheless, INTEGRAL has detected this source with a significance of and a flux of ph cm-2s-1keV-1 (20–50 keV; see Tables 2 and 8). For a more detailed study of 4U 2206+54 with INTEGRAL, we refer to Blay et al. (2005).
6.2 1ES 0033+595
1ES 0033+595, an AGN of the BL-Lac type, was detected as a hard X-ray source by BeppoSAX (Costamante et al. 2001). This source was also found with INTEGRAL by Kuiper et al. (2005) with a photon flux of ph cm-2s-1keV-1 (20–45 keV). We detected it in the 20–50 keV band, with significance (see Tables 2 and 8 for our flux values). Comparing the high-energy fluxes of Costamante et al. (2001) and Kuiper et al. (2005) with our flux, shows the variable nature of this BL Lac. While the source was a factor of 2.4 brighter during the observations of Kuiper et al. (2005), it was 4.7 times brighter during the observations of Costamante et al. (2001) with a photon flux of ph cm-2s-1keV-1 (20–50 keV) in December 1999.
6.3 Non detected 4U 0115+63, IGR J00291+5434 and IGR J01363+6610
In this field three other sources were detected by INTEGRAL at other epochs. 4U 0115+63 was in outburst late August and September 2004 (Lutovinov et al. 2004; Zurita Heras et al. 2004), reaching a peak flux of about 400 mCrab. For INTEGRAL-ToO results we refer to Ferringo et al. (2006). IGR J00291+5434 was discovered by INTEGRAL early December 2004 (Eckert et al. 2004). This new transient turned out to be the fastest accretion-powered X-ray pulsar known to date (Markwardt et al. 2004b, a). More detailed INTEGRAL and RXTE results are published by Shaw et al. (2005); Falanga et al. (2005b) and Galloway et al. (2005). IGR J01363+6610 is a short transient discovered with INTEGRAL by Grebenev et al. (2004) in April 2004. The source was seen only once for 2.3 hours. We have not detected any of these sources neither in the total exposure mosaics, nor in single revolutions, nor in single SCWs. For flux upper limits see Table 8.
7 Summary
We report results from a first deep observation of the Cassiopeia region in the hard X-ray energy window of 20–200 keV, exploiting the good imaging capabilities and the wide field of view of the IBIS-ISGRI telescope aboard INTEGRAL. We report results on nine detected sources of various kinds: Anomalous X-ray Pulsar 4U 0142+61, several high-mass X-ray binaries, intermediate polar V709 Cas, BL-Lac 1E 0033+595, and a still unidentified new INTEGRAL source IGR J00234+6141. In addition the upper limits are presented of the non-detected AXP 1E 2259+586 and three more high-mass X-ray binaries.
The discovery in this work of the very hard spectral tail between 20 and 150 keV of AXP 4U 0142+61, increases the number of IBIS-ISGRI AXP detections to three, the others being 1E 1841-045 (Molkov et al. 2004; Kuiper et al. 2004) and 1RXS J170849-400910 (Revnivtsev et al. 2004a). This suggests that such a hard, highly luminous spectral component is a common property of AXPs. Of these three AXPs, 4U 0142+61 appears to exhibit the most extreme spectral shape (see Fig. 3): below 10 keV it has the softest spectrum with a black-body temperature of keV and a very soft power-law component with photon index . Above 10 keV this drastically changes into a very hard power-law component with photon index 0.730.17 (possibly even as hard as till 70 keV if the indication for a break around that energy is real, see the fits in Fig. 3). The X-ray luminosity between 20 and 100 keV for the single power-law fit is erg s-1, a factor of 440 higher than the rotational energy loss, amounting erg s-1 (assuming , km for a homogeneous sphere and a distance of 3 kpc). Such a high hard X-ray luminosity has to find its origin in the magnetosphere of the magnetar, fed from the magnetic energy reservoir in the strong magnetic field. The underlying scenario of production processes is not yet well understood. To constrain different model scenarios, more detailed observational parameters are needed. One of these is the detailed spectral shape of the hard X-ray component. The reported COMPTEL upper limits for energies between 0.75 MeV and 30 MeV already indicate that the power-law spectrum of 4U 0142+61 has to bend/break below this energy window. So far AXP 1E 2259+586 has not been detected with INTEGRAL, however, the flux upper limits extracted from INTEGRAL and COMPTEL data do not exclude the existence of a high-energy tail.
INTEGRAL has increased the number of known supergiant X-ray binaries significantly (see e.g. Kuulkers 2005; Negueruela et al. 2006; Lutovinov et al. 2006). We introduce a new SXB, i.e. IGR J00370+6122. We detected this source in two INTEGRAL revolutions, at a position consistent with that of the ROSAT source 1RXS J003709.6+612131, which has a BN0.5II-III bright-giant counterpart. Analysis of archival RXTE-ASM data revealed the day orbital period. Follow-up studies using a ToO RXTE observation and BeppoSAX-WFC archival data rendered a consistent picture of a new, by an order of magnitude variable, wind-accreting SXB. The source exhibits below 20 keV a power-law spectrum with index 2.7, and a hard power-law spectrum with index in the INTEGRAL window 20–80 keV.
We report the detection of a second SXB, 2S 0114+650. For the first time the spectrum has been measured up to 150 keV. The good statistics in the time-averaged spectrum above 70 keV, showed that a single bremsstrahlung model cannot fit the data satisfactorily. In addition, a power-law component with index is required, or the spectrum can be explained with a single power law with index .
Our deep survey of the Cassiopeia region rendered also detections of three Be X-ray binaries: Cas, RX J0146.9+6121 and 4U 2206+54. For the first two, the INTEGRAL spectra were measured to higher energies than published earlier, and are discussed in comparison to these earlier reports.
The intermediate polar V709 Cas was detected up to 70 keV. The best model fit was obtained for a power-law model yielding a photon index of , different from the bremsstrahlung-model fits reported in literature.
Finally, two more hard-X-ray sources are found: 1) IGR J00234+6141, discovered as a weak (1 mCrab) source up to 100 keV. No counterpart could be found yet. Since it is located close to the Galactic plane and there is no radio counterpart, it is likely an X-ray binary, rather than an AGN. 2) 1ES 0033+595, an AGN of the BL Lac type, also detected in this work at the 1-mCrab level.
Acknowledgements.
We would like to thank R.H.D. Corbet, R. Remillard and the ASM/RXTE team for the rapid processing of the light curves for IGR J00370+6122 and IGR J00234+6141 and for useful discussions. The results in this paper are based on observations with INTEGRAL, an ESA project with instruments and science data centre funded by ESA member states (especially the PI countries: Denmark, France, Germany, Italy, Switzerland, Spain), Czech Republic and Poland, and with the participation of Russia and the USA. We also acknowledge CDS SIMBAD and NRAO/VLA Sky Survey.References
- Apparao et al. (1991) Apparao, K. M. V., Bisht, P., & Singh, K. P. 1991, ApJ, 371, 772
- Arnaud (1996) Arnaud, K. A. 1996, in ASP Conf. Ser. 101: Astronomical Data Analysis Software and Systems V, 17–20
- Bird et al. (2006) Bird, A. J., Barlow, E. J., Bassani, L., et al. 2006, ApJ in press
- Bird et al. (2004) Bird, A. J., Barlow, E. J., Bassani, L., et al. 2004, ApJ, 607, L33
- Blay et al. (2005) Blay, P., Ribó, M., Negueruela, I., et al. 2005, A&A, 438, 963
- Boella et al. (1997) Boella, G., Butler, R. C., Perola, G. C., et al. 1997, A&AS, 122, 299
- Bonnet-Bidaud et al. (2001) Bonnet-Bidaud, J. M., Mouchet, M., de Martino, D., Matt, G., & Motch, C. 2001, A&A, 374, 1003
- Bonning & Falanga (2005) Bonning, E. W. & Falanga, M. 2005, A&A, 436, L31
- Bradt et al. (1993) Bradt, H. V., Rothschild, R. E., & Swank, J. H. 1993, A&AS, 97, 355
- Cameron et al. (2004) Cameron, P. B., Grcevich, J., Gugliucci, N., et al. 2004, The Astronomer’s Telegram, 312, 1
- Corbet (1986) Corbet, R. H. D. 1986, MNRAS, 220, 1047
- Corbet et al. (1999) Corbet, R. H. D., Finley, J. P., & Peele, A. G. 1999, ApJ, 511, 876
- Corbet & Peele (2001) Corbet, R. H. D. & Peele, A. G. 2001, ApJ, 562, 936
- Costamante et al. (2001) Costamante, L., Ghisellini, G., Giommi, P., et al. 2001, A&A, 371, 512
- Courvoisier et al. (2003) Courvoisier, T. J.-L., Walter, R., Beckmann, V., et al. 2003, A&A, 411, L53
- Crampton et al. (1985) Crampton, D., Hutchings, J. B., & Cowley, A. P. 1985, ApJ, 299, 839
- Dall’Osso et al. (2003) Dall’Osso, S., Israel, G. L., Stella, L., Possenti, A., & Perozzi, E. 2003, ApJ, 599, 485
- de Boer et al. (1992) de Boer, H., Bennett, K., den Herder, H., et al. 1992, in Data Analysis in Astronomy - IV, ed. V. Di Gesù, L. Scarsi, R. Buccheri, P. Crane, M. C. Maccarone and H. U. Zimmermann (Plenum Press, New York, USA), 241–249
- de Martino et al. (2001) de Martino, D., Matt, G., Mukai, K., et al. 2001, A&A, 377, 499
- den Hartog et al. (2004a) den Hartog, P. R., Kuiper, L., Hermsen, W., & Vink, J. 2004a, The Astronomer’s Telegram, 293, 1
- den Hartog et al. (2004b) den Hartog, P. R., Kuiper, L. M., Corbet, R. H. D., et al. 2004b, The Astronomer’s Telegram, 281, 1
- Eckert et al. (2004) Eckert, D., Walter, R., Kretschmar, P., et al. 2004, The Astronomer’s Telegram, 352, 1
- Fahlman & Gregory (1981) Fahlman, G. G. & Gregory, P. C. 1981, Nature, 293, 202
- Falanga et al. (2005a) Falanga, M., Bonnet-Bidaud, J. M., & Suleimanov, V. 2005a, A&A, 444, 561
- Falanga et al. (2005b) Falanga, M., Kuiper, L., Poutanen, J., et al. 2005b, A&A, 444, 15
- Farrell et al. (2004) Farrell, S., Sood, R., & O’Neill, P. 2004, The Astronomer’s Telegram, 283, 1
- Ferringo et al. (2006) Ferringo, C., , Secreto, A., et al. 2006, in prep.
- Filippova et al. (2005) Filippova, E. V., Tsygankov, S. S., & Lutovinov, A. A. a. R. A. 2005, Astronomy Letters, 31, 729
- Finley et al. (1992) Finley, J. P., Belloni, T., & Cassinelli, J. P. 1992, A&A, 262, L25
- Forman et al. (1978) Forman, W., Jones, C., Cominsky, L., et al. 1978, ApJS, 38, 357
- Gaensler et al. (2001) Gaensler, B. M., Slane, P. O., Gotthelf, E. V., & Vasisht, G. 2001, ApJ, 559, 963
- Galloway et al. (2005) Galloway, D. K., Markwardt, C. B., Morgan, E. H., Chakrabarty, D., & Strohmayer, T. E. 2005, ApJ, 622, L45
- Gavriil et al. (2002) Gavriil, F. P., Kaspi, V. M., & Woods, P. M. 2002, Nature, 419, 142
- Giacconi et al. (1972) Giacconi, R., Murray, S., Gursky, H., et al. 1972, ApJ, 178, 281
- Goldwurm et al. (2003) Goldwurm, A., David, P., Foschini, L., et al. 2003, A&A, 411, L223
- Grebenev et al. (2004) Grebenev, S. A., Ubertini, P., Chenevez, J., Orr, A., & Sunyaev, R. A. 2004, The Astronomer’s Telegram, 275, 1
- Gregory & Fahlman (1980) Gregory, P. C. & Fahlman, G. G. 1980, Nature, 287, 805
- Gros et al. (2003) Gros, A., Goldwurm, A., Cadolle-Bel, M., et al. 2003, A&A, 411, L179
- Haberl et al. (1998a) Haberl, F., Angelini, L., & Motch, C. 1998a, A&A, 335, 587
- Haberl et al. (1998b) Haberl, F., Angelini, L., Motch, C., & White, N. E. 1998b, A&A, 330, 189
- Haberl & Motch (1995) Haberl, F. & Motch, C. 1995, A&A, 297, L37
- Hall et al. (2000) Hall, T. A., Finley, J. P., Corbet, R. H. D., & Thomas, R. C. 2000, ApJ, 536, 450
- Harmanec et al. (2000) Harmanec, P., Habuda, P., Štefl, S., et al. 2000, A&A, 364, L85
- Hellier (1994) Hellier, C. 1994, MNRAS, 271, L21
- Hulleman et al. (2000) Hulleman, F., van Kerkwijk, M. H., & Kulkarni, S. R. 2000, Nature, 408, 689
- Hulleman et al. (2004) Hulleman, F., van Kerkwijk, M. H., & Kulkarni, S. R. 2004, A&A, 416, 1037
- in’t Zand (1992) in’t Zand, J. J. M. 1992, Ph.D. Thesis, Utrecht University, The Netherlands
- Israel et al. (1994) Israel, G. L., Mereghetti, S., & Stella, L. 1994, ApJ, 433, L25
- Jager et al. (1997) Jager, R., Mels, W. A., Brinkman, A. C., et al. 1997, A&AS, 125, 557
- Jensen et al. (2003) Jensen, P. L., Clausen, K., Cassi, C., et al. 2003, A&A, 411, L7
- Jernigan (1976) Jernigan, J. G. 1976, IAU Circ., 2900, 2
- Kaspi & Gavriil (2003) Kaspi, V. M. & Gavriil, F. P. 2003, ApJ, 596, L71
- Kaspi et al. (2003) Kaspi, V. M., Gavriil, F. P., Woods, P. M., et al. 2003, ApJ, 588, L93
- Kern & Martin (2002) Kern, B. & Martin, C. 2002, Nature, 417, 527
- Koenigsberger et al. (1983) Koenigsberger, G., Swank, J. H., Szymkowiak, A. E., & White, N. E. 1983, ApJ, 268, 782
- Kubo et al. (1998) Kubo, S., Murakami, T., Ishida, M., & Corbet, R. H. D. 1998, PASJ, 50, 417
- Kuiper et al. (2006) Kuiper, L., Hermsen, W., den Hartog, P. R., & Collmar, W. 2006, submitted to ApJ
- Kuiper et al. (2005) Kuiper, L., Hermsen, W., in ’t Zand, J. J. M., & den Hartog, P. R. 2005, The Astronomer’s Telegram, 662, 1
- Kuiper et al. (2004) Kuiper, L., Hermsen, W., & Mendez, M. 2004, ApJ, 613, 1173
- Kuulkers (2005) Kuulkers, E. 2005, in AIP Conf. Proc. 797: Interacting Binaries: Accretion, Evolution, and Outcomes, 402–409
- Lebrun et al. (2003) Lebrun, F., Leray, J. P., Lavocat, P., et al. 2003, A&A, 411, L141
- Lund et al. (2003) Lund, N., Budtz-Jørgensen, C., Westergaard, N. J., et al. 2003, A&A, 411, L231
- Lutovinov et al. (2004) Lutovinov, A., Budtz-Jorgensen, C., Turler, M., et al. 2004, The Astronomer’s Telegram, 326, 1
- Lutovinov et al. (2006) Lutovinov, A., Revnivtsev, M., Gilfanov, P., et al. 2006, accepted A&A, astro-ph/0411550
- Markwardt et al. (2004a) Markwardt, C. B., Galloway, D. K., Chakrabarty, D., Morgan, E. H., & Strohmayer, T. E. 2004a, The Astronomer’s Telegram, 360, 1
- Markwardt et al. (2004b) Markwardt, C. B., Swank, J. H., & Strohmayer, T. E. 2004b, The Astronomer’s Telegram, 353, 1
- Mas-Hesse et al. (2003) Mas-Hesse, J. M., Giménez, A., Culhane, J. L., et al. 2003, A&A, 411, L261
- Masetti et al. (2004) Masetti, N., Dal Fiume, D., Amati, L., et al. 2004, A&A, 423, 311
- Masetti et al. (2005) Masetti, N., Orlandini, M., Dal Fiume, D., et al. 2005, A&A in press, astro-ph/0508451
- Mason et al. (1976) Mason, K. O., White, N. E., & Sanford, P. W. 1976, Nature, 260, 690
- Mereghetti & Stella (1995) Mereghetti, S. & Stella, L. 1995, ApJ, 442, L17
- Mereghetti et al. (1993) Mereghetti, S., Stella, L., & de Nile, F. 1993, A&A, 278, L23
- Mereghetti et al. (2000) Mereghetti, S., Tiengo, A., Israel, G. L., & Stella, L. 2000, A&A, 354, 567
- Mewe et al. (1995) Mewe, R., Kaastra, J. S., & Liedahl, D. A. 1995, Legacy, 6, 16
- Molkov et al. (2004) Molkov, S. V., Cherepashchuk, A. M., Lutovinov, A. A., et al. 2004, Astronomy Letters, 30, 534
- Molkov et al. (2005) Molkov, S. V., Cherepashchuk, A. M., Lutovinov, A. A., et al. 2005, VizieR Online Data Catalog, 903, 589
- Morii et al. (2005) Morii, M., Kawai, N., Kataoka, J., et al. 2005, Advances in Space Research, 35, 1177
- Morii et al. (2006) Morii, M., Kawai, N., & Shibazaki, N. 2006, in prep. for ApJ
- Motch et al. (1991) Motch, C., Belloni, T., Buckley, D., et al. 1991, A&A, 246, L24
- Murakami et al. (1986) Murakami, T., Koyama, K., Inoue, H., & Agrawal, P. C. 1986, ApJ, 310, L31
- Negueruela (2005) Negueruela, I. 2005, in The Many Scales of the Universe, ed. J.C. del Toro Iniesta et al. (Kluwer Academic Publishers, in press, astro-ph/0411759)
- Negueruela & Reig (2001) Negueruela, I. & Reig, P. 2001, A&A, 371, 1056
- Negueruela et al. (2006) Negueruela, I., Smith, D. M., Reig, P., Chaty, S., & Torrejon, J. M. 2006, in ESA-SP 604: The X-ray Universe 2005 (astro-ph/0511088)
- Owens et al. (1999) Owens, A., Oosterbroek, T., Parmar, A. N., et al. 1999, A&A, 348, 170
- Patel et al. (2001) Patel, S. K., Kouveliotou, C., Woods, P. M., et al. 2001, ApJ, 563, L45
- Patel et al. (2003) Patel, S. K., Kouveliotou, C., Woods, P. M., et al. 2003, ApJ, 587, 367
- Patterson (1994) Patterson, J. 1994, PASP, 106, 209
- Poutanen & Svensson (1996) Poutanen, J. & Svensson, R. 1996, ApJ, 470, 249
- Rappaport & van den Heuvel (1982) Rappaport, S. & van den Heuvel, E. P. J. 1982, in IAU Symp. 98: Be Stars, 327–344
- Reig et al. (1996) Reig, P., Chakrabarty, D., Coe, M. J., et al. 1996, A&A, 311, 879
- Reig et al. (1997) Reig, P., Fabregat, J., Coe, M. J., et al. 1997, A&A, 322, 183
- Reig et al. (2005) Reig, P., Negueruela, I., Papamastorakis, G., Manousakis, A., & Kougentakis, T. 2005, A&A, 440, 637
- Renaud et al. (2004) Renaud, M., Lebrun, F. andBallet, J., Decourchelle, A., Terrier, R., & Prantzos, N. 2004, in ESA SP-552: 5th INTEGRAL Workshop on the INTEGRAL Universe, 81–86
- Revnivtsev et al. (2004a) Revnivtsev, M. G., Sunyaev, R. A., Varshalovich, D. A., et al. 2004a, Astronomy Letters, 30, 382
- Revnivtsev et al. (2004b) Revnivtsev, M. G., Sunyaev, R. A., Varshalovich, D. A., et al. 2004b, VizieR Online Data Catalog, 903, 430
- Rho & Petre (1997) Rho, J. & Petre, R. 1997, ApJ, 484, 828
- Rutledge et al. (2000) Rutledge, R. E., Brunner, R. J., Prince, T. A., & Lonsdale, C. 2000, ApJS, 131, 335
- Sasaki et al. (2004) Sasaki, M., Plucinsky, P. P., Gaetz, T. J., et al. 2004, ApJ, 617, 322
- Schönfelder et al. (1993) Schönfelder, V., Aarts, H., Bennett, K., et al. 1993, ApJS, 86, 657
- Secchi (1867) Secchi, A. 1867, Astronomische Nachrichten, 68, 63
- Shaw et al. (2005) Shaw, S. E., Mowlavi, N., Rodriguez, J., et al. 2005, A&A, 432, L13
- Smith et al. (1998) Smith, M. A., Robinson, R. D., & Corbet, R. H. D. 1998, ApJ, 503, 877
- Thompson & Duncan (1993) Thompson, C. & Duncan, R. C. 1993, ApJ, 408, 194
- Thompson & Duncan (1996) Thompson, C. & Duncan, R. C. 1996, ApJ, 473, 322
- Titarchuk (1994) Titarchuk, L. 1994, ApJ, 434, 570
- Torrejón et al. (2004) Torrejón, J. M., Kreykenbohm, I., Orr, A., Titarchuk, L., & Negueruela, I. 2004, A&A, 423, 301
- Ubertini et al. (2003) Ubertini, P., Lebrun, F., Di Cocco, G., et al. 2003, A&A, 411, L131
- Vedrenne et al. (2003) Vedrenne, G., Roques, J.-P., Schönfelder, V., et al. 2003, A&A, 411, L63
- Vink (2005) Vink, J. 2005, Advances in Space Research, 35, 976
- Voges et al. (1999) Voges, W., Aschenbach, B., Boller, T., et al. 1999, A&A, 349, 389
- White et al. (1987) White, N. E., Mason, K. O., Giommi, P., et al. 1987, MNRAS, 226, 645
- Willingale et al. (2001) Willingale, R., Aschenbach, B., Griffiths, R. G., et al. 2001, A&A, 365, L212
- Winkler et al. (2003) Winkler, C., Courvoisier, T. J.-L., Di Cocco, G., et al. 2003, A&A, 411, L1
- Woods et al. (2004) Woods, P. M., Kaspi, V. M., Thompson, C., et al. 2004, ApJ, 605, 378
- Woods & Thompson (2005) Woods, P. M. & Thompson, C. 2005, in Compact Stellar X-ray Sources, ed. W.H.G. Lewin, M. van der Klis (Cambridge, MA: Cambridge University Press. in press astro-ph/0406133)
- Zhang et al. (2004) Zhang, S., Collmar, W., Hermsen, W., & Schönfelder, V. 2004, A&A, 421, 983
- Zurita Heras et al. (2004) Zurita Heras, J. A., Shaw, S. E., Kreykenbohm, I., et al. 2004, The Astronomer’s Telegram, 331, 1