XMM–Newton View of the Warm–Hot Intergalactic Medium Toward Markarian 421
Abstract
The recent detection with Chandra of two warm–hot intergalactic medium (WHIM) filaments toward Mrk 421 by Nicastro et al. provides a measurement of the bulk of the “missing baryons” in the nearby universe. Since Mrk 421 is a bright X-ray source, it is also frequently observed by the XMM–Newton Reflection Grating Spectrometer (RGS) for calibration purposes. Using all available archived XMM observations of this source with small pointing offsets (″), we construct the highest–quality XMM grating spectrum of Mrk 421 to date with a net exposure time (excluding periods of high background flux) of 437 ks and counts per resolution element at 21.6 Å, more than twice that of the Chandra spectrum. Despite the long exposure time neither of the two intervening absorption systems is seen, though the upper limits derived are consistent with the Chandra equivalent width measurements. This appears to result from (1) the larger number of narrow instrumental features caused by bad detector columns, (2) the degraded resolution of XMM/RGS as compared to the Chandra/LETG, and (3) fixed pattern noise at Å. The non–detection of the WHIM absorbers by XMM is thus fully consistent with the Chandra measurement.
1 Introduction
Most of the baryons that comprise 4% of the mass–energy budget of the universe are found in the intergalactic medium (IGM), primarily appearing as the Lyman–alpha “forest” in high–redshift quasar spectra (Weinberg, 1997). At more recent times () the process of structure formation has shock–heated the IGM to temperatures of K, thus rendering the hydrogen nearly fully ionized and producing (at most) broad, extremely weak Lyman–alpha absorption (e.g. Sembach et al., 2004; Richter et al., 2004). Known as the warm–hot intergalactic medium (WHIM), this phase is predicted to contain roughly half of the baryonic matter at low redshifts (Cen & Ostriker, 1999; Davé et al., 2001). Its extremely low density (typically ) precludes the detection of WHIM thermal or line emission with current facilities, so the only way to directly measure these “missing” baryons is through far–ultraviolet and X-ray spectroscopic measurements of absorption lines from highly ionized heavy elements (Perna & Loeb, 1998; Hellsten et al., 1998; Fang, Bryan, & Canizares, 2002).
Several early attempts to detect these intervening WHIM absorbers in X-rays (e.g. Fang et al., 2002; Mathur, Weinberg, & Chen, 2003; McKernan et al., 2003) and more recent surveys (Fang et al., 2005) yielded only tentative detections at best. Intervening Lyman–alpha (Shull et al., 1996; Sembach et al., 2004) and O VI (e.g. Savage et al., 2002) absorbers had also been seen in FUSE and HST quasar spectra, but their ionization states and possible galactic halo origins (e.g. Tumlinson et al., 2005) are quite uncertain. These uncertainties are largely mitigated with the recent detection by Nicastro et al. (2005a, b) of two X-ray absorption systems at and along the line of sight to the blazar Mrk 421. These filaments account for a critical density fraction of , fully consistent with the mass of the missing baryons in the local universe (albeit with large uncertainties). While future proposed missions such as Constellation–X, XEUS, or Pharos (Nicastro et al., in preparation) will be able to measure to far greater precision with detections of numerous weaker X-ray forest lines, the Nicastro et al. (2005a, hereafter N05) results present a key early confirmation of numerical predictions using observational capabilities that are currently within our grasp — hence any test of their correctness is of great importance.
Although each of these two absorption systems was detected with high confidence through multiple redshifted X-ray absorption lines, the individual absorption lines were generally quite weakly detected, mostly at the level. Moreover, while they employed high–quality Chandra and FUSE data taken during exceptionally bright outbursts of Mrk 421, the many archived XMM–Newton observations of this source were not included in the analysis. With roughly twice the effective area of Chandra/LETG, XMM/RGS is in principle superior for X-ray grating spectroscopy between Å; however, its slightly worse resolution (approximately 60 mÅ FWHM, versus 50 mÅ for Chandra/LETG), higher susceptibility to background flares, and multitude of narrow instrumental features can present serious complications for WHIM searches.
Independent confirmation of the Chandra results with a separate instrument like XMM is thus important. While some groups have searched for WHIM features in a limited number of XMM Mrk 421 spectra (e.g., Ravasio et al., 2005), a complete and systematic analysis has yet to be performed. Here we present a search for WHIM features employing all “good” observations of Mrk 421 available in the XMM archive, and a comparison of these results to those presented by N05.
2 Data Reduction and Measurements
We searched the XMM archive for all Mrk 421 Reflection Grating Spectrometer (RGS) data. Although 31 separate observations were available, 16 had pointing offsets ″ while the rest were offset by less than 15″. Since spectral resolution and calibration quality can degrade at large offsets, we only included those with ″. One extremely short observation (0158971101, with s) was also excluded to simplify the data reduction process. Using the standard XMM Science Analysis System version 6.5.0 routines111See http://xmm.vilspa.esa.es/sas, RGS1 light curves were built for the remaining 14 “good” observations (see Table 1), and the spectra were reprocessed to exclude periods of high background levels and coadded. These combined, filtered RGS1 and RGS2 spectra have effective exposure times of ks and over combined RGS1RGS2 first–order counts between Å with counts per 0.06 Å resolution element in RGS1 near 21 Å, over twice that in the N05 Mrk 421 Chandra spectrum.
We first used the spectral fitting program Sherpa222http://cxc.harvard.edu/sherpa/ to fit a simple power law plus Galactic foreground absorption model to the RGS1 and RGS2 data; however, at such high spectral quality the RGS response model does not appear to be well–determined, and large residuals remained. For line measurements, we thus only considered Å windows around each wavelength of interest, using a power law to independently model the RGS1 and RGS2 continua within each window and excluding the strongest narrow detector features (with typical widths of 70 mÅ or less). None of the intervening absorption lines were apparent through a visual inspection of the XMM spectrum, though several of the lines reported by Williams et al. (2005) could be seen clearly.
A narrow Gaussian absorption line (FWHM mÅ) was included in the model for each line measurement or upper limit reported by N05. When convolved with the RGS instrumental response these absorption lines appeared broadened to the RGS line spread function (LSF) widths (typically FWHM mÅ; den Herder et al., 2001). The upper limits on all equivalent widths were then calculated (allowing the central line wavelengths to vary within the errors reported by N05). Since the shapes of the RGS1 and RGS2 instrumental responses are quite different, these limits were calculated using both a joint fit to the RGS1RGS2 spectra as well as the individual RGS1 and RGS2 spectra. It should be noted that wherever one RGS unit is unusable, the total response is effectively halved, at which point it has a similar effective area to Chandra/LETG. The resulting equivalent width limits are listed in Table 2.
3 Discussion
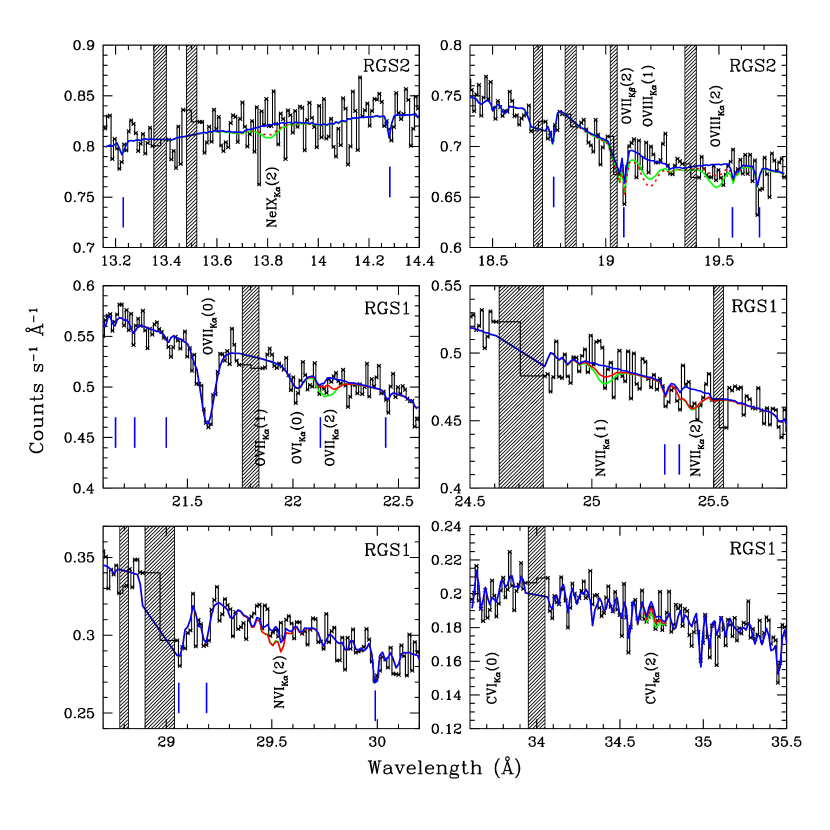
Figure 1 shows the spectral windows used to determine upper limits on the N05 measured lines, with the data (black), continuum fit (blue), Chandra measurements and limits (N05; red solid and dotted lines respectively), and XMM limits (green) overplotted. In all cases, the N05 measurements (or upper limits) appear to be consistent with the upper limits we have derived directly from the XMM data, as shown in the figure and listed in Table 2. The O VII line at looks as though it might be visible in the spectrum, but this is most likely due to the weak instrumental feature at Å. For two lines (N VII and N VI at ) the XMM upper limits are approximately equal to the N05 best–fit measurements, but since the N05 values are quite uncertain this result is still consistent.
Why, then, with times the counts per resolution element, was XMM unable to detect the intervening absorption systems seen by Chandra? Several factors appear to have been involved in this non–detection, primarily: (1) narrow instrumental features caused by bad detector columns, (2) the broader LSF as compared to Chandra/LETG, and (3) fixed–pattern noise at long wavelengths:
-
1.
While broad instrumental features can be taken into account by modifications to the continuum model (as in N05), it is difficult or impossible to distinguish narrow features from true absorption lines; thus, any line falling near one of the detector features shown in Figure 2 can easily be lost333These response file data can be found at http://www.astronomy.ohio-state.edu/$∼$smita/xmmrsp/. This was responsible for the non-detection of the O VII K line. Although it was the strongest line reported by N05, its wavelength falls directly on a narrow RGS1 feature and within the non–functional CCD4 region on RGS2, thereby preventing this line from being detectable with either RGS. Since 18% of the wavelength space for studying redshifted O VII ( Å) toward Mrk 421 is directly blocked by these narrow features (with this number climbing to about 60% if resolution elements immediately adjacent to bad columns are included), these bad columns present the single greatest hindrance to XMM/RGS studies of the WHIM.
-
2.
Even for lines where both RGS1 and RGS2 data are available and the instrumental response appears to be relatively smooth, the lower resolution of XMM contributes to the nondetectability of the weaker absorption lines. Figure 3 shows the LSFs for both XMM/RGS1 (solid) and Chandra/LETG assuming an unresolved line with mÅ at 21.6 Å. While the core of the RGS1 response is % broader than that of the LETG, the RGS1 LSF has extremely broad wings: only 68% of the line flux is contained within the central 0.1Å of the RGS1 LSF, as opposed to 96% for the LETG. This reduces the apparent depth of absorption lines by about a factor of two as compared to Chandra/LETG, severely decreasing the line detectability.
-
3.
At long wavelengths ( Å) strong fixed–pattern noise is apparent as a sawtooth pattern in the instrumental response, strongly impeding the detection of species such as N VI and C VI. Indeed, in these wavelength regimes (the lower two panels of Figure 1), the N VI and C VI absorption lines are nearly indistinguishable from the continuum.
4 Conclusion
We have presented the highest signal–to–noise coadded XMM grating spectrum of Mrk 421 to date, incorporating all available archival data. This spectrum serves as an independent check on the recent detection of two WHIM filaments by N05. While none of the Chandra–detected absorption lines are seen in the XMM spectrum, the upper limits derived from the XMM data are consistent with the equivalent widths reported by N05 (even though the XMM data contain a larger number of counts), and hence do not jeopardize the validity of the Chandra measurement. The non–detections can be attributed primarily to narrow instrumental features in RGS1 and RGS2, as well as the inferior spectral resolution of XMM and fixed–pattern noise at longer wavelengths. This underscores the extreme difficulty of detecting the WHIM, illustrates how the aforementioned (apparently small) effects can greatly affect the delicate measurement of weak absorption lines, and re–emphasizes the importance of high resolution and a smooth instrumental response function for current and future WHIM absorption line studies.
References
- Cen & Ostriker (1999) Cen, R., & Ostriker, J. P. 1999, ApJ, 514, 1
- Davé et al. (2001) Davé, R., et al. 2001, ApJ, 552, 473
- den Herder et al. (2001) den Herder, J. W., et al. 2001, A&A, 365, L7
- Fang et al. (2002) Fang, T., Marshall, H. L., Lee, J. C., Davis, D. S., & Canizares, C. R. 2002, ApJ, 572, L127
- Fang, Bryan, & Canizares (2002) Fang, T., Bryan, G. L., & Canizares, C. R. 2002, ApJ, 539, 532
- Fang et al. (2005) Fang, T., Canizares, C. R., & Marshall, H. L. 2005, ApJ, 633, 61
- Hellsten et al. (1998) Hellsten, U., Gnedin, N. Y., & Miralda–Escudé, J. 1998, ApJ, 509, 56
- Mathur, Weinberg, & Chen (2003) Mathur, S., Weinberg, D. H., & Chen, X. 2003, ApJ, 582, 82
- McKernan et al. (2003) McKernan, B., Yaqoob, T., Mushotzsky, R., George, I. M., & Turner, T. J. 2003, ApJ, 589, L83
- Nicastro et al. (2005a) Nicastro, F., et al. 2005, ApJ, 629, 700
- Nicastro et al. (2005b) Nicastro, F., et al. 2005, Nature, 433, 495
- Perna & Loeb (1998) Perna, R., & Loeb, A. 1998, ApJ, 503, L135
- Ravasio et al. (2005) Ravasio, M., Tagliaferri, G., Pollock, A. M. T., Ghisellini, G., & Tavecchio, F. 2005, A&A, 438, 481
- Richter et al. (2004) Richter, P., Savage, B. D., Tripp, T. M., & Sembach, K. R. 2004, ApJS, 153, 165
- Savage et al. (2002) Savage, B. D., Sembach, K. R., Tripp, T. M., & Richter, P. 2002, ApJ, 564, 631
- Sembach et al. (2004) Sembach, K. R., Tripp, T. M., Savage, B. D., & Richter, P. 2004, ApJS, 155, 351
- Shull et al. (1996) Shull, J. M., Stocke, J. T., & Penton, S. 1996, AJ, 111, 72
- Tumlinson et al. (2005) Tumlinson, J., Shull, J. M., Giroux, M. L., & Stocke, J. T. 2005, ApJ, 620, 95
- Weinberg (1997) Weinberg, D. H. 1997, ApJ, 490, 564
- Williams et al. (2005) Williams, R. J., et al. 2005, ApJ, 631, 856
| ID | Date | aaTotal observation duration. | bbEffective RGS1 exposure time after filtering for periods of high background levels. | RateccAverage count rate in the filtered RGS1 first–order source spectral extraction region. |
|---|---|---|---|---|
| ks | ks | s-1 | ||
| 0099280101 | 2000 May 25 | 63.8 | 21.2 | 15.7 |
| 0099280201 | 2000 Nov 01 | 40.1 | 34.1 | 5.4 |
| 0099280301 | 2000 Nov 13 | 49.8 | 46.6 | 15.3 |
| 0099280501 | 2000 Nov 13 | 21.2 | 17.8 | 17.2 |
| 0136540101 | 2001 May 08 | 38.8 | 36.1 | 11.7 |
| 0136540301 | 2002 Nov 04 | 23.9 | 20.5 | 11.7 |
| 0136540401 | 2002 Nov 04 | 23.9 | 20.1 | 13.6 |
| 0136540701 | 2002 Nov 14 | 71.5 | 62.8 | 16.4 |
| 0136541001 | 2002 Dec 01 | 70.0 | 58.1 | 8.3 |
| 0158970101 | 2003 Jun 01 | 43.0 | 25.3 | 9.0 |
| 0158970201 | 2003 Jun 02 | 9.0 | 6.6 | 9.7 |
| 0158970701 | 2003 Jun 07 | 48.9 | 29.9 | 5.4 |
| 0158971201 | 2004 May 06 | 65.7 | 40.5 | 19.5 |
| 0162960101 | 2003 Dec 10 | 30.0 | 17.5 | 9.8 |
| TOTAL | 572.3 | 437.1 | 12.2 |
| Line | aa Line wavelength, redshift, and equivalent width measurements (or upper limits) from Nicastro et al. (2005a). | aa Line wavelength, redshift, and equivalent width measurements (or upper limits) from Nicastro et al. (2005a). | aa Line wavelength, redshift, and equivalent width measurements (or upper limits) from Nicastro et al. (2005a). | bb equivalent width upper limits measured from the RGS1 only (R1), RGS2 only (R2), and joint (R1+R2) fits to the XMM–Newton spectrum, when available. | bb equivalent width upper limits measured from the RGS1 only (R1), RGS2 only (R2), and joint (R1+R2) fits to the XMM–Newton spectrum, when available. | bb equivalent width upper limits measured from the RGS1 only (R1), RGS2 only (R2), and joint (R1+R2) fits to the XMM–Newton spectrum, when available. | Note |
|---|---|---|---|---|---|---|---|
| Å | mÅ | mÅ | mÅ | mÅ | |||
| Ne IXKα | 1 | ||||||
| O VIIKβ | |||||||
| O VIIIKα | |||||||
| O VIIIKα | 2 | ||||||
| O VIIKα | 2,3 | ||||||
| O VIIKα | 3 | ||||||
| N VIIKα | |||||||
| N VIIKα | |||||||
| N VIKα | |||||||
| C VIKα |
Note. — (1) A nearby chip gap in RGS1 renders this measurement unreliable, so only the RGS2 measurement was used in Figure 1; (2) Line was unmeasurable in RGS1 because of a detector feature; (3) Line was unmeasurable in RGS2 because of a detector feature.