The Surface of 2003 in the Near Infrared
Abstract
We report the detection of crystalline water ice on the surface of 2003 . Reflectance spectra were collected from Gemini North telescope from 1.0 to 2.4 µm wavelength range, and from the Keck telescope across the 1.4 to 2.4 µm wavelength range. The signature of crystalline water ice is obvious in all data collected. Like the surfaces of many outer solar system bodies, the surface of 2003 is rich in crystalline water ice, which is energetically less favored than amorphous water ice at low temperatures, suggesting that resurfacing processes may be taking place. The near infrared color of the object is much bluer than a pure water ice model. Adding a near infrared blue component such as hydrogen cyanide or phyllosilicate clays improves the fit considerably, with hydrogen cyanide providing the greatest improvement. The addition of hydrated tholins and bitumens also improves the fit but is inconsistent with the neutral reflectance of 2003 . A small decrease in reflectance beyond 2.3 µm may be attributable to cyanide salts. Overall, the reflected light from 2003 is best fit by a model of 2/3 to 4/5 pure crystalline water ice and 1/3 to 1/5 near infrared blue component such as hydrogen cyanide or kaolinite. The surface of 2003 is unlikely to be covered by significant amounts of dark material such as carbon black, as our pure ice models reproduce published albedo estimates derived from the spin state of 2003 .
1 Introduction
The Kuiper belt objects (KBOs) have been known for a decade to have the most diverse surfaces of any minor planet population in terms of global color at visible wavelengths (Luu & Jewitt, 1996). The carrier of this color has been tentatively identified as a red tholin-like compound (Jewitt & Luu, 2001). The situation is much different in the near-infrared, where signatures of the most primitive solar system volatiles can be seen. Although many attempts have been made to detect ices on KBOs in the near-infrared, very few to date have been successful.
Barring the decades of study of Pluto, Charon and Triton (each of which could share origins with the KBOs), detections of simple organic ices on KBOs have been relatively few. Indisputable methane ice detections have been presented for 2003 and 2005 (Brown et al., 2006; Barkume et al., 2005; Licandro et al., 2006). The KBO Sedna has also been reported to have a Triton-like spectrum, largely dominated by methane ice (Barucci et al., 2005). The following KBOs have all shown signs of water ice: (19308) 1996 (Brown et al., 1999), (26375) 1999 (Jewitt & Luu, 2001) and (90482) Orcus (Trujillo et al., 2005). The object (50000) Quaoar has been the only KBO so far to show signs of crystalline water ice (Jewitt & Luu, 2004). This finding is significant in that crystalline water ice is unstable on 10 Myr timescales. However, crystalline water ice has been seen on many other outer solar system bodies such as Charon and the giant planet moons, which argues for a common resurfacing process throughout the solar system.
In this work, we report the discovery of large amounts of crystalline water ice on 2003 from observations obtained at the Gemini North telescope and Keck Observatory. The object 2003 is a unique object in dynamical terms. It is the only known ternary or higher system in the Kuiper belt (excepting Pluto, Weaver et al., 2005), with the brighter moon’s orbit reported in Brown et al. (2005) and the fainter moon reported in Brown et al. (2006). Not only is 2003 a ternary system, but it is the most rapid large ( km) rotator in the solar system (Rabinowitz et al., 2005). The extreme rotational state of 2003 combined with the measured orbit of its brighter moon yields a surprisingly large amount of information about the physical parameters of the system including limits on its shape, density and albedo (Rabinowitz et al., 2006). With the discovery of crystalline water ice on the surface of 2003 , we can now place constraints on the surface fraction of water ice on the body as well as other components.
2 Observations
Observations of 2003 were collected at the Gemini North and the Keck telescopes on Mauna Kea, Hawaii. The Gemini data were collected in queue mode on 4 separate UT dates, as detailed in Table 1. The Keck observations were collected in classical (i.e. full night) mode on UT 2005 Apr 26 and 27. Total integration times for Gemini were 4.0 hours in -band, 1.3 hours in -band and 1.7 hours in -band using NIRI (Hodapp et al., 2003). From Keck, total integration times were 3.1 hours in a single grism setting using NIRC (Matthews & Soifer, 1994). Some of the data were taken through cirrus, however, removal of the cirrus data did not affect results, so they were included in this work. A telluric standard star was observed on each night with similar airmass to the science observations. On the two photometric Gemini nights, photometry data for 2003 and UKIRT faint standards were collected.
3 Data Reduction
3.1 Photometry
On the two photometric Gemini nights, synthetic aperture photometry was used to measure the broad-band colors of 2003 . A large aperture of 4.7 arcseconds diameter (40 pixels) was selected due to the poor seeing (0.9 arcseconds full width at half maximum in ). This chosen aperture encompassed the secondary, which is up to 1 arcsecond away from and 3.3 magnitudes fainter than the primary. The primary has a known visible lightcurve with peak-to-peak amplitude magnitudes and a period of hours in the visible without color dependence (Rabinowitz et al., 2006). Flux measurements for , , and were made during UT 2005 Mar 02 10:34 – 11:08 and also on UT 2005 Apr 25 07:25 – 07:44. Flux measurements were compared to the Mauna Kea JHK system UKIRT standard stars FS23 and FS131 on the two respective nights (Simons & Tokunaga, 2002; Tokunaga et al., 2002; Leggett, 2006). Near-infrared colors were consistent between the two nights with and . These near-infrared colors were used to later scale the Gemini , and grism settings to a common relative reflectance scale. This scale was consistent with the lower resolution Keck spectrum which collected and using a single grism setting.
The individual , and magnitudes were all brighter on UT 2005 Apr 25 by an average of magnitudes, which is consistent with the visible lightcurve measured by Rabinowitz et al. (2006). Thus, it is likely that the visible and near infrared lightcurves have the same shape and phase information, just as the , , , and colors do, as would be expected for a shape-dominated lightcurve. The two near infrared photometry epochs (UT 2005 Mar 02 10:51 and UT 2005 Apr 25 07:35) correspond to the lightcurve phases 0.834 and 0.016, which occur at and magnitudes from the mean visible magnitude. Using the assumption that the near-infrared lightcurve and visible lightcurves match in phase and magnitude, we find the following for the mean near-infrared magnitudes for 2003 : , , . These numbers are uncorrected for the solar phase angle because solar phase corrections are unmeasured in the near infrared and likely differ from the visible. However, the solar phase angles for the two epochs are similar (0.71 degrees and 0.65 degrees, respectively), so the above magnitudes should be valid for the mean solar phase angle of 0.68 degrees. From Rabinowitz et al. (2006), we determine the mean visible magnitude to be at 0.68 degrees solar phase and heliocentric and geocentric distances of AU and AU, corresponding to the midpoint between our near infrared photometric epochs. Thus we produce the following visible to near-infrared color: , which is consistent with solar color (Jewitt & Luu, 2001).
3.2 Spectroscopy
Both the Gemini and Keck spectral data were processed using standard near infrared techniques. First, spectra dithered along the slit were pairwise sky subtracted to remove detector bias and dark current as well as produce a first order removal of sky lines. These images were divided by a composite flat of the slit observed through the grism. The resultant image pairs were cleaned of residual bad pixels and cosmic rays. Images were rectified such that the wavelength and spatial axes were orthogonal prior to spectral extraction. Source spectra were extracted from each dither position along with adjacent sky regions. A composite residual sky spectrum was subtracted from a composite source spectrum for each night of data. Telluric G2V star spectra were put through the same processing pipeline prior to being divided into the source spectra for telluric correction to produce relative reflectance. Data from each night were then combined into a single science spectrum.
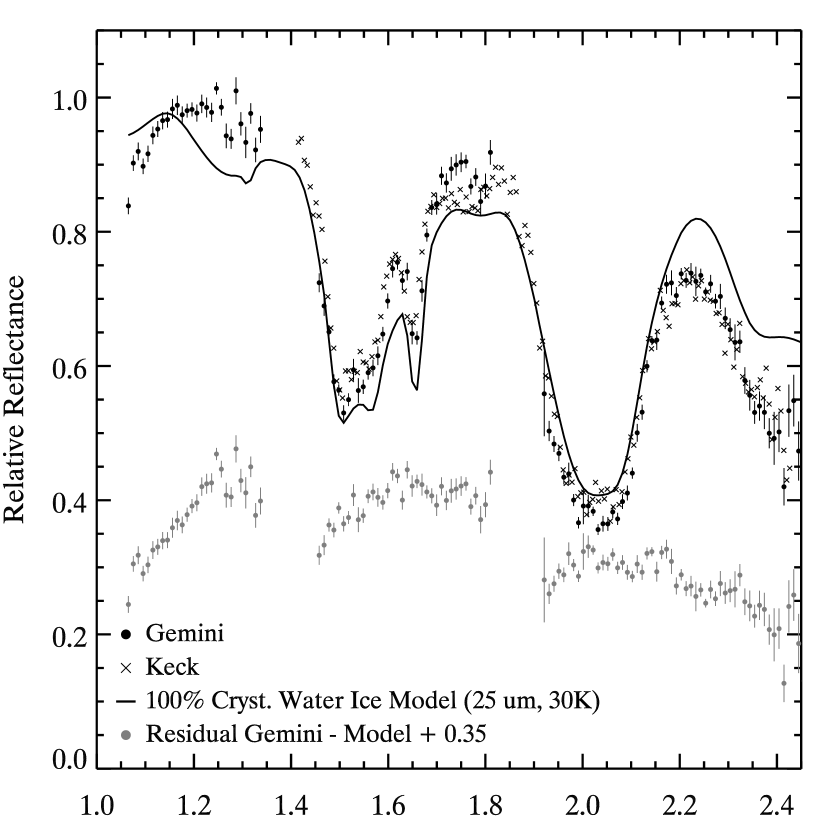
Finally, the spectral resolution of the Gemini data was reduced to match the Keck NIRC data after a search for narrow-band features resulted in no significant detections. The Gemini spectrum was converted to reflectance by using the measured and colors of 2003 to scale the 3 separate , and grism settings of NIRI. Since no photometric data were collected at the Keck telescope, we scaled the single grism setting for Keck NIRC to the Gemini spectrum. The color-corrected Gemini spectrum in the and regions was consistent with the single Keck grism setting, so we believe that both spectra are accurate in terms of reflectance. The data from the two telescopes can be found in Figure 1. We found no significant evidence for rotational variation of spectral features in our data. There was some variation in the 1.7 µm to 1.8 µm range between the March and April Gemini data (%) as well as the between the Gemini data and the Keck data (, seen in Figure 1). We note that this region has many strong OH lines and conclude that the variations observed are likely from residual sky contamination and are not significant given the signal to noise of our data.
4 Pure Crystalline Water Ice Model
We produced a simple reflectance spectrum using a Hapke model and published optical constants for crystalline water ice, similar to that used by Trujillo et al. (2005). The feature at 1.65 µm, which is obvious in our data, is found in crystalline water ice but not amorphous water ice nor crystalline water ice at high temperatures (Hansen & McCord, 2004). Thus, we begin our modelling of the reflectance from 2003 with crystalline water ice only. The wavelength dependent absorption coefficient was drawn from Grundy & Schmitt (1998) for 30 K, and the real index of refraction from Warren (1984) was used. Isotropically scattering grains were assumed, and an amplitude of opposition effect was used. Many grain sizes were modeled: from 10 µm up to 1 cm diameter in size. Small grain sizes of 25 µm to 50 µm were universally favored to reproduce both the depth and width of the absorption. We were unable to reproduce the behavior of our spectrum shortward of 1.2 µm with any of our models. This region is the most uncertain in the Grundy & Schmitt (1998) laboratory work, with up to factors of 2 in absorption due to fundamental limitations of their instrumental apparatus. Such large discrepancies can easily cause errors of in modelled albedo, so we have ignored all wavelengths shortward of 1.2 µm in our fits. The region beyond 2.35 µm is also poorly fit by our models and was ignored in fitting. This wavelength region is addressed in Section 4.3.
An initial fit of the composite spectrum shows that a pure water ice model fits the major features of the spectrum and the color quite well, to a few percent (Figure 1). However, the overall color measured for 2003 from the Gemini photometry, and the Keck grism measurement is roughly 20% lower in flux than the pure water ice model. Regardless of the specific crystalline water ice temperature and grain sizes, if the depth of the broad absorptions are matched, the overall color of the body does not match. It is clear that a component with a blue near-IR color would improve the fit, but we find no evidence for specific transitions that might indicate a particular species responsible for the blue color. We therefore considered several non-unique models which could contribute to the blue color below.
4.1 The Blue Component
The water ice model residuals in Figure 1 suggest that addition of a component with an overall blue color at near-infrared wavelengths can improve the fit substantially. Since there are no spectral signatures apparent besides the overall color, it is impossible to identify the blue component accurately. However, a survey of published infrared absorptions shows that there are at least a few common components that are blue in the near-infrared with few strong absorptions. We discuss these models below with the understanding that it is very likely that the true composition of 2003 is quite complex and could include any, all or none of the components listed below. We believe it is still useful to report on this analysis as future work may help to identify the blue component more accurately.
The three compounds that we found to improve the fit in the near-infrared are pure hydrogen cyanide, hydrated Titan tholin and phyllosilicate clays. Since the near-infrared colors were consistent on both photometric nights at Gemini, which probed different longitudes of the body, we believe the blue component is likely to be present across a wide surface area of the minor planet. A summary of the pure water ice model and the additional blue components is presented in Table 2 and discussion appears in following sections.
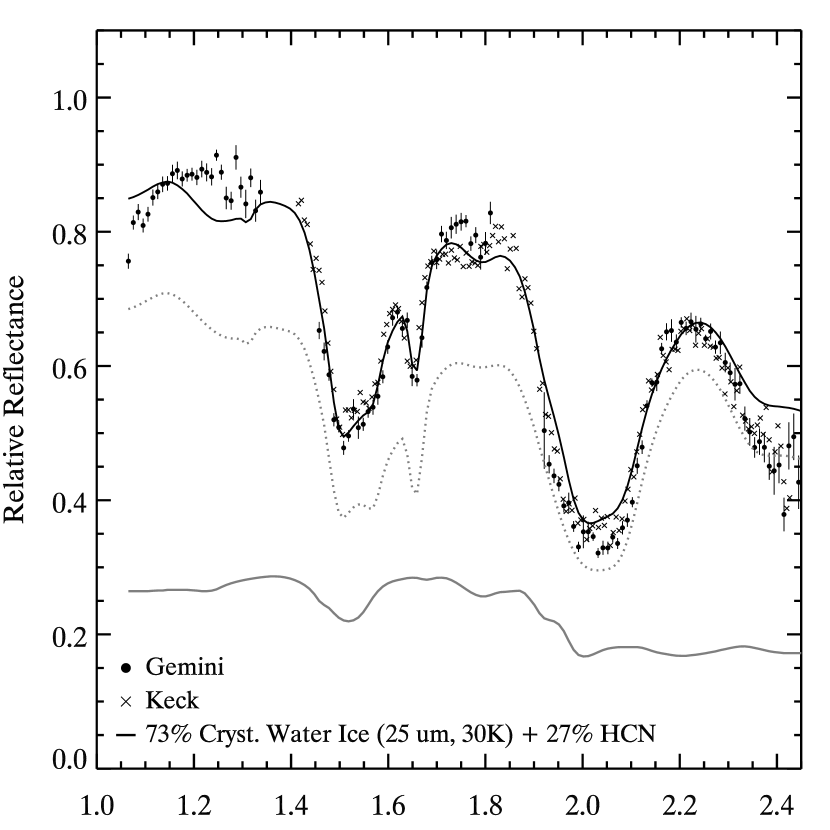
4.1.1 Hydrogen Cyanide
Hydrogen cyanide (HCN) is one of the components we found to improve the fit significantly. A model of water ice (73%) + hydrogen cyanide (27%) improves the fit significantly as estimated by analysis and by eye. The best-fit water ice model in this case is a 30 K model with a 25 µm grain diameter. The hydrogen cyanide model used was that of room temperature HCN (Dumas et al., 2001). Hydrogen cyanide is colorless in the visible, so HCN is consistent with the neutral color measurement in this work, and the neutral color reported by Rabinowitz et al. (2006). The lack of specific narrow features in HCN does not allow unequivocal identification in our data. Hydrogen cyanide has several weak features at 1.52 µm, 1.68 µm, and 2.01 µm which are very close to nearby water absorptions and are thus unsuitable for identification of HCN in our data. The 1.80 µm feature is likely the most diagnostic of HCN, but it is near two prominent OH lines, making identification of the 1.80 µm HCN feature impossible in our dataset.
4.1.2 Hydrated Tholins
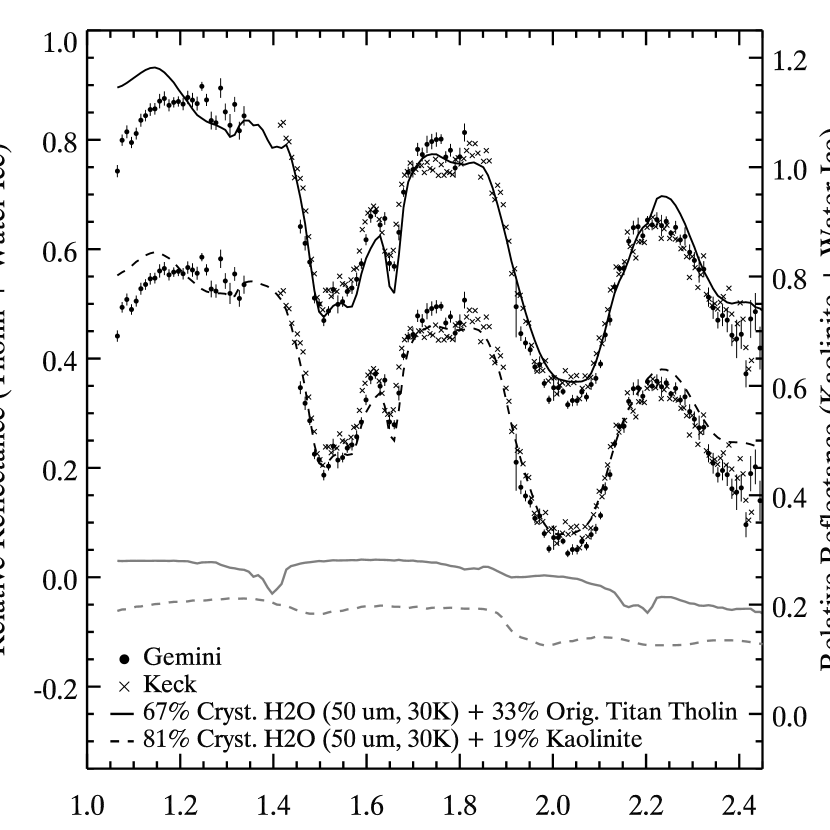
The effect of adding hydrated tholins to the fit was estimated by using the 3 tholin types discussed by Roush & Dalton (2004). The three types were the original Titan tholin manufactured by Khare et al. (1984) and measured by Cruikshank et al. (1991), as well as the Denver and Ames tholins (Roush & Dalton, 2004). Addition of all three tholins improved the fit, but only the original Titan tholin, which was less hydrated than the other samples, improved the fit at the statistically significant () level as judged by a analysis. The best results occurred for original tholin with 67% water ice at 30 K with 50 µm grains + 33% original tholin, shown in Figure 3. We remark that there are a wide variety of Titan tholins published, and even multiple measurements of apparently identical compounds also have resulted in discrepant laboratory spectra, adding uncertainty to all tholin models. The strongest evidence against tholins comes from our color, which is neutral in reflectance and the neutral color reported by Rabinowitz et al. (2006). The addition of substantial amounts (i.e. the 1/3 in our best-fit spectrum) of tholin material would result in a very red surface, so although the original Titan tholin fits the near-infrared spectrum, we consider tholins unlikely to reproduce the visible spectrum of 2003 , which is colorless throughout the visible.
4.1.3 Phyllosilicate Clays
The addition of the common Earth phyllosilicate clay kaolinite (Clark et al., 2003, W1R1Bb sample) also improves the fit somewhat. A analysis shows that the amount of improvement falls short of formal significance, yet it was a larger improvement than for any other component tested and produced an improvement to the eye, so we include it here. The best-fit model is composed of 81% crystalline water ice with 50 µm grains at 30K + 19% kaolinite, shown in Figure 3. The common phyllosilicate clay montmorillonite Roush (2005) was also found to improve the fit, but to even a smaller degree than kaolinite. Since the presence of phyllosilicate clays improves the overall fit of the spectrum, we consider these to be a possible source of the near-infrared blue color of 2003 . Most montmorillonite and kaolinite clays are colorless or nearly so in the visible, so we consider these to be a reasonable component to reproduce the blue color of the near-infrared spectrum without affecting the visible color of 2003 .
4.1.4 Failed Models
We tested many other models that are somewhat blue in the near infrared as shown in Table 2 and the references therein. Several models provided no improvement at all over the water ice model including methanol ice (Cruikshank et al., 1998), asphaltite and kerite (Moroz et al., 2004). Several models showed some improvement, but not at the formally significant level: ammonia hydrate (Dumas et al., 2001), ammonia ice (Brown & Calvin, 2000), amorphous water ice (Schmitt et al., 1998, best fit with 25 µm grains), methane ice (Grundy et al., 2002, best fit with 50 µm grains), montmorillonite (Roush, 2005) and the Ames and Denver tholin compounds (Roush & Dalton, 2004). A few of these compounds deserve additional comment. Tholin compounds and montmorillonite were discussed above in Sections 4.1.2 and 4.1.3, respectively. The inclusion of asphaltite and kerite are mentioned below, in Section 4.3.
Ammonia ice and ammonia hydrate have been reported on Charon and on Quaoar (Brown & Calvin, 2000; Jewitt & Luu, 2004) and are of particular interest because when dissolved in water, they lower its melting point. Such compounds may make it easier to resurface a body with crystalline water ice, but we find no evidence of such compounds in our data.
Amorphous water is known to co-exist with crystalline water ice on the Galilean satellites (Hansen & McCord, 2004), thus it seems possible that this could be the case for 2003 , although we find no formal evidence for this in our data. It is possible that large amounts of the water ice could be amorphous (up to ) without detection in our data because of the large degeneracy between crystalline water ice grain size, temperature, and amount of amorphous water ice, all of which affect the depth of the 1.65 µm crystalline water ice feature. Much higher signal to noise spectra in the band would place a stronger limit on the amount of amorphous water ice.
Although the addition of methane ice does not significantly improve our fit, because it is a known component on other solar system bodies and highly volatile, it is interesting to ask how much could be on the surface without being detected. We find that the addition of 10% methane ice (grain size of 50 µm) results in a significant () deviation of the model from the data in terms of as well as by eye.
4.2 Neutral Absorber
We also modeled the presence of a neutral absorber; the addition of a neutral absorber of any albedo did not improve the overall fit significantly for the water ice + blue component models. Our reflectance models alone cannot specifically test for the presence of highly absorbing, featureless compounds such as carbon black. The addition of such an absorber would not change the relative reflectance or the depths of the absorption bands we observe, only the overall albedo of the body. However, by using published albedo measurements, we can place some constraint on the presence of dark absorbers.
Previously, Rabinowitz et al. (2006) placed constraints on the albedo of 2003 from lightcurve and binary orbit measurements. The spheroidal and ellipsoidal models place the -band albedo in the range. Such albedo measurements are consistent with our models, which include no dark or neutral materials. Since the color is roughly solar, then the albedo and albedo are roughly equal. Using this information, we find that all of the two-component models in Figures 2–3 fall within , showing a reasonable consistency between the dynamical spin models and our icy near-infrared reflectance models. Thus, we expect the true surface fractions of ices on 2003 to be very close to the reflectance model fractions presented here, with very little low albedo material present on the surface.
4.3 The 2.35 µm Drop
We note that there is a clear drop in the spectrum of 2003 beyond 2.35 µm compared to the crystalline water ice model as well as the water ice + blue component models. This drop is observed in both the Keck spectrum and the Gemini spectrum. The feature appears to start at about 2.35 µm and continues until atmospheric sky noise overcomes the object signal at µm, indicating that the central wavelength of this absorption is at or beyond 2.45 µm. High signal to noise observations of Charon have shown a similar feature, but the carrier was never identified (Brown & Calvin, 2000). A similar absorption has been reported on Phoebe, and has been attributed to a cyanide combination, possibly potassium cyanide or cyanide trihydrate (Clark et al., 2005b). Such absorption has also been reported by Clark et al. (2005a) for Iapetus, Dione, and the F-ring. Judging from Clark et al. (2005b), the reflectance of 2003 appears to be most consistent with copper potassium cyanide in this region, as it is broad ( µm) and in the correct location. We did not specifically model this compound in more detail because we were unable to find data on its absorption shortward of 1.8 µm in any available literature or chemical database. Although potassium cyanide and cyanide trihydrate may be responsible for the observed drop, other inorganic cyanide salts () are not a good match. Nickel cyanide, cadmium cyanide and zinc cyanide all produce very narrow transitions (widths about 0.03 µm) shortward of 2.36 µm (Clark et al., 2003). Organic nitrile compounds () share the same triple bond of inorganic cyanide salts, but we were unable to find suitable spectral information for these components. The addition of bitumens such as kerite, asphaltite or wurtzilite, which have a drop at 2.3 µm could also explain the 2.35 µm drop (Moroz et al., 1998). We examined the use of both powdered kerite and asphaltite (Moroz et al., 2004), but neither appeared to improve the overall fit significantly due to the steep red slope seen at wavelengths shorter than 1.5 µm.
5 Discussion
The basic result of our observations is that the spectrum of 2003 is consistent with a model with roughly 2/3 to 4/5 pure crystalline water ice combined with 1/3 to 1/5 pure blue material. The best candidates for the blue material are pure hydrogen cyanide or possibly phyllosilicate clays, although this identification is not unique. Likely there are many possible materials that could fit the near-infrared color of 2003 , of which only a fraction have laboratory spectra available. No neutral absorbers are needed in appreciable amounts to model the relative reflectance of the body. The only feature noted in the near infrared spectrum besides that of crystalline water ice and the basic blue color is the drop in reflectance beyond 2.3 µm which is consistent with copper potassium cyanide. Laboratory data on cyanide compounds are sparse, so it is likely that other cyanide or nitrile compounds could produce such behavior.
The presence of crystalline water ice has been widely reported for many outer solar system bodies such as the satellites of the major planets, Charon and most recently Quaoar. As noted by Jewitt & Luu (2004) for (50000) Quaoar, the presence of crystalline water ice is considered problematic in the Kuiper belt because, in general, lower energy amorphous ice is favored in cold environments. Crystalline water ice may have been prevalent in the early solar nebula and may have been incorporated into bodies at low temperatures ( K) if the deposition flux of water molecules was low (Kouchi et al., 1994). However, the disruptive action of cosmic ray and solar flux bombardment on the outer surfaces of icy bodies is expected to rearrange crystalline water ice to amorphous in the outer solar system (Hansen & McCord, 2004).
Both solar flux and cosmic ray bombardment can cause extensive radiation damage to the outer surface layers of KBOs. Estimating the time scale of such radiation damage is very difficult due to the sparse amount of data available about energetic particles in the solar system, which comes primarily from spacecraft. In addition, assumptions about the timescale for density changes in the local interstellar medium must be made which directly affects all estimates of the extent of the heliosphere, which is a key component of radiation damage models. Our near-infrared reflectance spectra probe only the first mm of the KBO surface when surface density and multiple scattering effects are taken into account. Cooper et al. (2003) suggest that disruptive amounts of energy (of order eV per 16 amu) can be delivered to mm depths by Galactic Cosmic Ray bombardment throughout the heliosphere. Timescales several orders of magnitude shorter may be plausible both closer to and farther from the sun than the AU region of the Kuiper Belt due to proton bombardment from a variety of sources. As many of these KBOs have been at their present location for years even in extreme dynamical models (Gomes et al., 2005), it appears that a solar system wide model for surface renewal is likely needed to explain the presence of crystalline water ice.
Hydrogen cyanide, one of the species that can explain the blue near infrared color of 2003 , is also photolysed rapidly in the outer solar system environment. Whether alone or frozen in solution with water ice, hydrogen cyanide is destroyed after deposition of about 100 eV per molecule by both irradiation and photolysis (Gerakines et al., 2005). Thus if HCN is to be considered as a source of the blue material on 2003 , it has the same stability problems as crystalline water ice. The phyllosilicate clays, another possible infrared blue material, do not share this sensitivity to radiation damage.
6 Summary
Using the Gemini and Keck telescopes, we have measured the near-infrared reflectance spectrum of 2003 on a global scale. We find the following:
-
•
The presence of crystalline water ice dominates the spectrum. Best fit models require between 2/3 and 4/5 of the reflectance to be attributed to pure crystalline water ice.
-
•
As for other outer solar system bodies, crystalline water ice is unstable on solar system timescales, suggesting some kind of global surface renewal process.
-
•
The addition of a second component that is blue in the near-infrared dramatically increases the goodness of fit and is responsible for 1/3 to 1/4 of the reflectance. The most likely carriers for this component are hydrogen cyanide or phyllosilicate clays, although this identification is not unique. Although hydrated titan tholins do improve the near-infrared fit, they are inconsistent with the neutral visible color observed for 2003 .
-
•
The presence of inorganic cyanide salts such as copper potassium cyanide may explain the observed absorption beyond 2.3 µm, as has been postulated for Phoebe and other Saturnian bodies (Clark et al., 2005b).
-
•
There is likely to be very little low albedo material on the surface of 2003 as our pure ice model albedos are consistent with published lightcurve/orbit dynamical constraints (Rabinowitz et al., 2006). Thus, the fractions described for reflectance are similar to the global surface coverage for the ices described. This surface coverage can only be estimated to the mm depth, due to our wavelength of observation.
-
•
No more than % of the surface of 2003 could be covered with methane ice without detection.
-
•
The near-infrared photometric differences between the two epochs at which we observed are consistent with the previously published visible lightcurve of 2003 , which is attributed to pronounced global rotational distortion of the body. The ubiquity of these variations from 0.4 – 2.5 µm adds more evidence to the conclusion that the extreme lightcurve of 2003 is due to shape only.
References
- Barkume et al. (2005) Barkume, K. M., Brown, M. E., & Schaller, E. L. 2005, AAS/Division for Planetary Sciences Meeting Abstracts, 37
- Barucci et al. (2005) Barucci, M. A., Cruikshank, D. P., Dotto, E., Merlin, F., Poulet, F., Dalle Ore, C., Fornasier, S., & de Bergh, C. 2005, A&A, 439, L1
- Brown et al. (2005) Brown, M. E., et al. 2005, ApJ, 632, L45
- Brown & Calvin (2000) Brown, M. E., & Calvin, W. M. 2000, Science, 287, 107
- Brown et al. (2006) Brown, M. E., Trujillo, C. A., & Rabinowitz, D. L. 2006, Submitted to ApJ
- Brown et al. (2006) Brown, M. E., et al. 2006, submitted to ApJ
- Brown et al. (1999) Brown, R. H., Cruikshank, D. P., & Pendleton, Y. 1999, ApJ, 519, L101
- Clark et al. (2005a) Clark, R. N., et al. 2005a, AGU Fall Meeting Abstracts, A2
- Clark et al. (2005b) Clark, R. N., et al. 2005b, Nature, 435, 66
- Clark et al. (2003) Clark, R. N., Swayze, G. A., Wise, R., Livo, K. E., Hoefen, T. M., Kokaly, R. F., & Sutley, S. J. 2003, U.S. Geological Survey, Open File Report 03-395
- Cooper et al. (2003) Cooper, J. F., Christian, E. R., Richardson, J. D., & Wang, C. 2003, Earth Moon and Planets, 92, 261
- Cruikshank et al. (1991) Cruikshank, D. P., Allamandola, L. J., Hartmann, W. K., Tholen, D. J., Brown, R. H., Matthews, C. N., & Bell, J. F. 1991, Icarus, 94, 345
- Cruikshank et al. (1998) Cruikshank, D. P., et al. 1998, Icarus, 135, 389
- Dumas et al. (2001) Dumas, C., Terrile, R. J., Brown, R. H., Schneider, G., & Smith, B. A. 2001, AJ, 121, 1163
- Gerakines et al. (2005) Gerakines, P. A., Bray, J. J., Davis, A., & Richey, C. R. 2005, ApJ, 620, 1140
- Gomes et al. (2005) Gomes, R., Levison, H. F., Tsiganis, K., & Morbidelli, A. 2005, Nature, 435, 466
- Grundy & Schmitt (1998) Grundy, W. M., & Schmitt, B. 1998, J. Geophys. Res., 103, 25809
- Grundy et al. (2002) Grundy, W. M., Schmitt, B., & Quirico, E. 2002, Icarus, 155, 486
- Hansen & McCord (2004) Hansen, G. B., & McCord, T. B. 2004, Journal of Geophysical Research (Planets), 109, 1012
- Hodapp et al. (2003) Hodapp, K. W., et al. 2003, PASP, 115, 1388
- Jewitt & Luu (2004) Jewitt, D. C., & Luu, J. 2004, Nature, 432, 731
- Jewitt & Luu (2001) Jewitt, D. C., & Luu, J. X. 2001, AJ, 122, 2099
- Khare et al. (1984) Khare, B. N., Sagan, C., Arakawa, E. T., Suits, F., Callcott, T. A., & Williams, M. W. 1984, Icarus, 60, 127
- Kouchi et al. (1994) Kouchi, A., Yamamoto, T., Kozasa, T., Kuroda, T., & Greenberg, J. M. 1994, A&A, 290, 1009
- Leggett (2006) Leggett, S. 2006, In preparation
- Licandro et al. (2006) Licandro, J., Pinilla-Alonso, N., Pedani, M., Oliva, E., Tozzi, G. P., & Grundy, W. M. 2006, A&A, 445, L35
- Luu & Jewitt (1996) Luu, J., & Jewitt, D. 1996, AJ, 112, 2310
- Matthews & Soifer (1994) Matthews, K., & Soifer, B. T. 1994, in Infrared Astronomy with Arrays: the Next Generation, 239
- Moroz et al. (2004) Moroz, L., Baratta, G., Strazzulla, G., Starukhina, L., Dotto, E., Barucci, M. A., Arnold, G., & Distefano, E. 2004, Icarus, 170, 214
- Moroz et al. (1998) Moroz, L. V., Arnold, G., Korochantsev, A. V., & Wasch, R. 1998, Icarus, 134, 253
- Rabinowitz et al. (2005) Rabinowitz, D., Tourtellotte, S., Brown, M., & Trujillo, C. 2005, AAS/Division for Planetary Sciences Meeting Abstracts, 37,
- Rabinowitz et al. (2006) Rabinowitz, D. L., Barkume, K., Brown, M. E., Roe, H., Schwartz, M., Tourtellotte, S., & Trujillo, C. A. 2006, to appear in ApJ
- Roush (2005) Roush, T. L. 2005, Icarus, 179, 259
- Roush & Dalton (2004) Roush, T. L., & Dalton, J. B. 2004, Icarus, 168, 158
- Schmitt et al. (1998) Schmitt, B., Quirico, E., Trotta, F., & Grundy, W. M. 1998, in ASSL Vol. 227: Solar System Ices, 199
- Simons & Tokunaga (2002) Simons, D. A., & Tokunaga, A. 2002, PASP, 114, 169
- Tokunaga et al. (2002) Tokunaga, A. T., Simons, D. A., & Vacca, W. D. 2002, PASP, 114, 180
- Trujillo et al. (2005) Trujillo, C. A., Brown, M. E., Rabinowitz, D. L., & Geballe, T. R. 2005, ApJ, 627, 1057
- Warren (1984) Warren, S. G. 1984, Appl. Opt., 23, 1206
- Weaver et al. (2005) Weaver, H. A., et al. 2005, IAU Circ., 8625, 1
| UT date | UT time | Grating | Airmass | Exposure | Sky |
|---|---|---|---|---|---|
| Time [min] | |||||
| 2005 Jan 27 | 13:36 – 14:46 | -grism | 1.098 – 1.013 | 65 | Thin Cirrus |
| 2005 Jan 27 | 15:51 – 16:18 | -grism | 1.008 – 1.024 | 25 | Photometric |
| 2005 Mar 02 | 10:34 – 10:40 | photometry | 1.239 – 1.218 | 4 | Photometric |
| 2005 Mar 02 | 10:40 – 10:47 | photometry | 1.215 – 1.196 | 4 | Photometric |
| 2005 Mar 02 | 10:47 – 11:08 | photometry | 1.193 – 1.135 | 4 | Photometric |
| 2005 Mar 02 | 11:25 – 12:18 | -grism | 1.091 – 1.024 | 50 | Photometric |
| 2005 Mar 02 | 12:24 – 13:17 | -grism | 1.015 – 1.000 | 50 | Photometric |
| 2005 Mar 02 | 13:21 – 13:53 | -grism | 1.002 – 1.015 | 30 | Photometric |
| 2005 Apr 25 | 07:25 – 07:31 | photometry | 1.153 – 1.138 | 4 | Photometric |
| 2005 Apr 25 | 07:32 – 07:38 | photometry | 1.136 – 1.122 | 4 | Photometric |
| 2005 Apr 25 | 07:38 – 07:44 | photometry | 1.120 – 1.107 | 4 | Photometric |
| 2005 Apr 25 | 08:04 – 08:57 | -grism | 1.065 – 1.013 | 50 | Photometric |
| 2005 Apr 25 | 11:29 – 12:09 | -grism | 1.133 – 1.239 | 25 | Photometric |
| 2005 Apr 25 | 12:10 – 12:41 | -grism | 1.260 – 1.381 | 30 | Photometric |
| 2005 May 31 | 08:56 – 09:59 | -grism | 1.111 – 1.294 | 50 | Cirrus |
| 2005 May 31 | 10:00 – 11:01 | -grism | 1.320 – 1.688 | 45 | Cirrus |
| Water Grain | Water Ice | Secondary | Secondary | Improvement over | Visible |
|---|---|---|---|---|---|
| Size [µm] | Fraction | Component | Fraction | water ice model | Color |
| 25 | 100% | 50 µm Water iceaaGrundy & Schmitt (1998) and Warren (1984) | 0% | N/A | Neutral |
| 25 | 73% | HCNbbDumas et al. (2001) | 27% | Significant | Neutral |
| 50 | 67% | Original tholinccRoush & Dalton (2004) | 33% | Significant | Red |
| 50 | 81% | KaoliniteddClark et al. (2003) | 19% | Borderline | Neutral |
| Ammonia hydratebbDumas et al. (2001) | Insignificant | Neutral | |||
| Ammonia iceeeBrown & Calvin (2000) | Insignificant | Neutral | |||
| 25 µm Amorphous WaterffSchmitt et al. (1998) | Insignificant | Neutral | |||
| 50 µm Methane iceggGrundy et al. (2002) | Insignificant | Neutral | |||
| MontmorillonitehhRoush (2005) | Insignificant | Neutral | |||
| Ames tholinccRoush & Dalton (2004) | Insignificant | Red | |||
| Denver tholinccRoush & Dalton (2004) | Insignificant | Red | |||
| Methanol iceiiCruikshank et al. (1998) | None | Neutral | |||
| AsphaltitejjMoroz et al. (2004) | None | Red | |||
| KeritejjMoroz et al. (2004) | None | Red |
Note. — Compounds that are neutral or nearly so in the visible are favored because of the neutral visible color of 2003 . See text for complete discussion.