Diffuse radio sources in the cluster of galaxies Abell 548b
Abstract
We report extensive VLA and ATCA observations of the two diffuse radio sources in the cluster of galaxies Abell 548b, which confirm their classification as relics. The two relics (named A and B) show similar flux density, extent, shape, polarization and spectral index and are located at projected distances of about 430 and 500 kpc from the cluster center, on the same side of the cluster’s X-ray peak. On the basis of spectral indices of discrete radio sources embedded within the diffuse features, we have attempted to distinguish emission peaks of the diffuse sources from unrelated sources. We have found that both relics, in particular the B-relic, show possible fine structure, when observed at high resolution. Another diffuse source (named C) is detected close in projection to the cluster center. High-resolution images show that it contains two discrete radio sources and a diffuse component, which might be a candidate for a small relic source. The nature and properties of the diffuse radio sources are discussed. We conclude that they are likely related to the merger activity in the cluster.
keywords:
Radio continuum: general – Galaxies: clusters: general – Galaxies: clusters: individual: A548b – diffuse radiation.1 Introduction
In recent years growing interest has been directed toward the study of diffuse radio sources in clusters of galaxies. Cluster radio halos have been found to permeate cluster centers, and diffuse radio sources classified as relics have been detected in the cluster peripheries (see e.g. review by Feretti 2003). Extended relics, showing a steep spectrum, high polarization degree and no obvious association with any cluster galaxy, have been suggested to originate along cluster merger shocks, either by diffusive shock acceleration of electrons (Enßlin et al. 1998) or adiabatic recompression of fossil radio plasma (Enßlin & Brüggen 2002). Currently we know about 30 clusters showing relics, but detailed studies are available for only a few sources of this class (see e.g. Giovannini & Feretti 2004 for a review). In six clusters, the relics are double and located on symmetric sides with respect to the cluster center. Relics may show quite different observational structures and locations, which might indicate different physical properties. New information on relic sources is therefore of great importance.
| RA (2000) | DEC | Freq. | Bandw. | R.Tel. (Config.) | Date | Durat. | Figure |
|---|---|---|---|---|---|---|---|
| h m s | ∘ ′ ′′ | MHz | MHz | min | |||
| 05 45 10.0 | 25 50 00 | 1365/1435 | 50 | VLA (C) | 28 Apr 00 | 110 | Figs. 1, 2, 3 |
| 05 45 04.9 | 25 47 40 | 1385/1465 | 50 | VLA (BnA) | 18 May 02 | 20 | Fig. 6 |
| 4835/4885 | 50 | VLA (BnA) | 18 May 02 | 20 | Fig. 5 | ||
| 8435/8485 | 50 | VLA (BnA) | 18 May 02 | 20 | |||
| 05 45 22.1 | 25 47 31 | 1385/1465 | 50 | VLA (BnA) | 18 May 02 | 8 | |
| 4835/4885 | 50 | VLA (BnA) | 18 May 02 | 8 | |||
| 05 44 51.4 | 25 50 45 | 1384 | 104 | ATCA (6A) | 17 Feb 00 | 720 | Fig. 4 |
| 1384 | 104 | ATCA (6B) | 22 Jun 00 | 720 | Fig. 4 | ||
| 1704 | 104 | ATCA (6B) | 22 Jun 00 | 720 | |||
| 2496 | 104 | ATCA (6A) | 17 Feb 00 | 720 | Fig. 7 |
The presence of a relic source in A548 was suggested by Giovannini et al. (1999), using radio data of the NRAO VLA Sky Survey (NVSS, Condon et al. 1998). The cluster A548, at an average redshift z=0.04 (Struble & Rood 1999), shows a rather complex structure both in the optical and in the X-ray band. Based on ROSAT data, Davis et al. (1995) pointed out the existence of three main sub-clusters. These are confirmed by optical data which indicate also significant further substructures, some of which overlap along the line of sight (Escalera et al. 1994, Den Hartog & Katgert 1996, Andreuzzi et al. 1998, Wegner et al. 1999, Colless et al. 2001, Nikogossian 2001, Smith et al. 2004). The combination of X-ray and optical data indicates that A548 is a cluster in a collapsing phase and therefore not yet dynamically relaxed.
The diffuse relic source detected by Giovannini et al. (1999) by inspection of the NVSS is located in the subcluster A548b, referred to in the literature also as A548S or A548W or A548SW, at a redshift z= 0.0424 (Den Hartog & Katgert 1996).
Radio data for this cluster were published previously by Gregorini et al. (1994) and Marvel et al. (1999), but they refer to radio galaxies only and Marvel et al’s image does not cover the region discussed in the present paper.
We present in this paper the results of new radio observations obtained with the Very Large Array (VLA) and the Australia Telescope Compact Array (ATCA) to study the radio emission in A548b. The VLA observations were aimed at imaging the diffuse emission with improved sensitivity and resolution with respect to the NVSS. The aim of the ATCA observations was to search for fine structure in the image of the radio relic similar to that seen in four relics by Slee et al. (2001), and resolve possible discrete sources. Thanks to the high surface brightness sensitivity of the present radio data, we detect for the first time in a cluster two radio relics located on the same side with respect to the cluster center. Moreover, a third possible diffuse source is detected close in projection to the cluster center. The paper is organized as follows: the radio data are presented in Sect. 2, the results from low resolution images in Sect. 3, those from high resolution images in Sect. 4. The results are discussed in Sect. 5.
For the computation of intrinsic parameters, we adopt the concordance cosmology with H0=70 km s-1 Mpc-1, = 0.3, and = 0.7. The luminosity distance DL of the subcluster under study is 188 Mpc; at this distance 1 arcsec corresponds to 0.84 kpc.
2 Radio Observations
2.1 Very Large Array
Radio observations at 1.4 GHz were obtained with the VLA in the C configuration (see Table 1) in order to achieve good sensitivity to the extended low-brightness structure. The sources 3C48, 3C138 and J0608223 were observed as calibrators of the flux density scale, the polarization position angle and the antenna gains and phases, respectively.
Short exposures were obtained with the VLA in the BnA configuration at 1.4, 4.8 and 8.4 GHz centred on two unresolved sources in the region of the diffuse emission, in order to obtain information on their structure and spectra. The sources 3C48 and J0530250 were used as calibrators.
The data were calibrated and reduced with the Astronomical Image Processing System (AIPS). Removal of bad data and interference was done by editing and by means of the task VLALB, kindly provided by W.D. Cotton. Images were produced by Fourier-Transform, CLEAN and RESTORE. Several cycles of imaging and self-calibration were performed, to minimize the effects of amplitude and phase variations. The process started with a few iterations of phase calibration only, then both phase and gain calibration solutions were obtained with a long integration time, until no further improvement in the solutions was obtained. For the C configuration data, separate images for each of the two observing frequencies were produced, in order to obtain an estimate of the spectral index. We also obtained an image of the polarized intensity in the standard way.
2.2 Australia Telescope Compact Array
Radio observations of A548b were obtained at 1.4, 1.7 and 2.5 GHz with the ATCA in two 6 km configurations; the observing sessions are summarized in Table 1. The sources J1939637 and J0608223 were used to calibrate the flux density scale and antenna gains and phases respectively.
The data were edited, calibrated and reduced with the MIRIAD software package, and the images were produced by following the standard procedure of Fourier inversion (INVERT), CLEAN and RESTOR, combined with two iterations of phase SELFCAL, followed by one iteration of both phase and amplitude SELFCAL.
To search for fine structure in the image of the radio relic similar to that seen in four relics by Slee et al. (2001), we needed to image with the highest angular resolution available in the 1.4 and 2.5 GHz bands. We were aware that the spatial frequencies available are not low enough to reproduce a smooth image of several arcmin in angular extent of the type detected by the NVSS at 1.4 GHz and reported by Giovannini et al. (1999). However, if fine-scale structure with scale size up to 1 arcmin were present, the 6A and 6B configurations would be able to image it with reasonable sensitivity.
We did not attempt to combine the 1.4 GHz data from the different VLA configurations and from ATCA because of the very different pointing positions and bandwidths. We note that the diffuse sources are only detected on the short baselines of the VLA C configuration, thus the combination of the uv-data would not improve the sensitivity to these low surface brightness features.
| Name | RA (2000) | DEC | S | Largest Size | P | Fract. pol. |
|---|---|---|---|---|---|---|
| h m s | ∘ ′ ′′ | mJy | arcsec kpc | 1023 W Hz-1 | % | |
| A | 05 44 50 | 25 51 00 | 615 | 310 260 | 2.60.2 | 30 |
| B | 05 45 22 | 25 47 30 | 605 | 370 310 | 2.50.2 | 30 |
| C | 05 45 26 | 25 55 16 | 776 | 160 135 | 3.20.3 | 7 |
3 Results from low resolution images

3.1 Radio emission
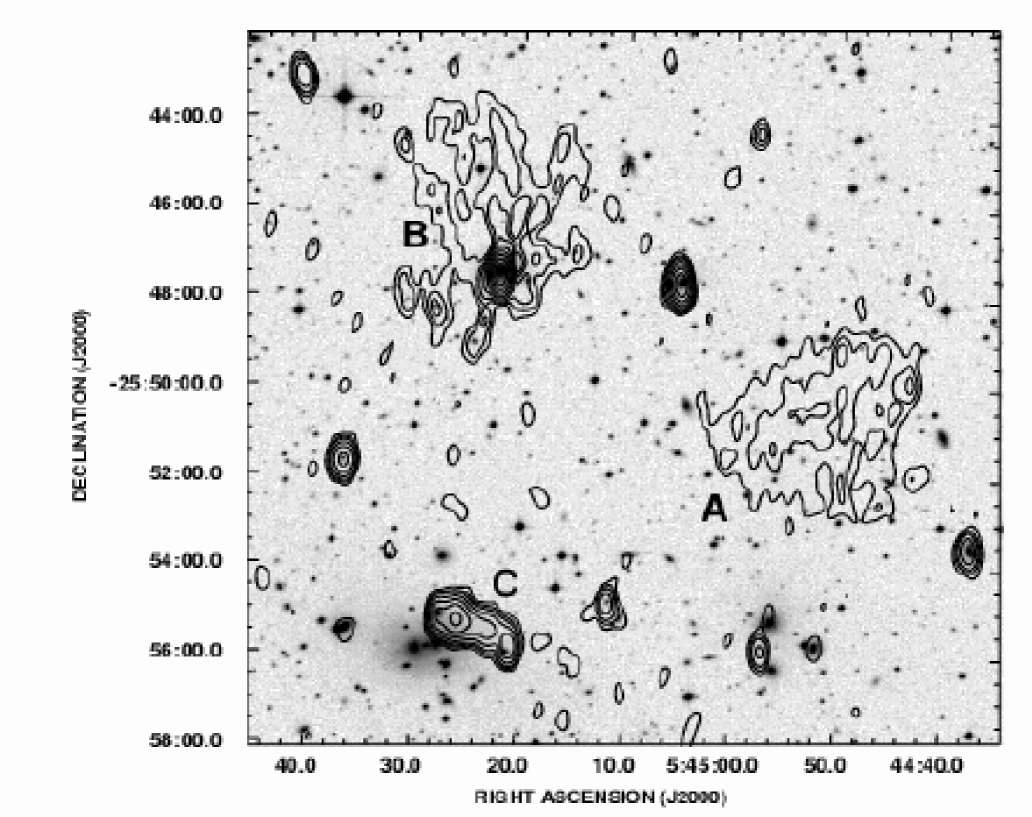
The radio image at 1.4 GHz, presented in Fig. 1, shows that the diffuse radio emission in this cluster is quite complex. A diffuse source is detected in the western cluster region (A in Fig. 1), confirming the emission seen in the NVSS. This extended source has a quite regular morphology and it is not associated with any galaxy.
Also, diffuse radio emission is detected in the northern cluster region (B in Fig. 1) around a strong pointlike radio source, in agreement with the traces of faint diffuse radio emission in the NVSS image (Giovannini et al. 1999). This extended emission is filamentary and irregular. The embedded radio galaxy (ESO 488-G 006 or PGC 17735) is not at the center of the diffuse radio emission, but located toward its southern boundary. The source parameters, presented in Table 2, indicate that the two diffuse sources A and B are strikingly similar in the total flux density at 1.4 GHz and size. We also note that there is a radio galaxy almost midway between the two diffuse sources (see discussion in Sect. 4.3).
Another apparently diffuse source (labeled C in Fig. 1) is detected 6′ south of the diffuse feature B. It is elongated, with no obvious optical identification, although it is located 1′ NW of the galaxy triplet VV 162, also classified in the literature as a dumbbell, studied by Gregorini et al. (1994). Higher resolution images (see Sect. 4.4) are crucial to disentangle the nature of this radio source.
We attempted an estimate of the spectral index111The spectral index is defined by S() of the two relics A and B, by comparing the images obtained from the two separate VLA frequencies in L band, 1365 MHz and 1435 MHz. Although the frequencies are quite close, there is indication of a steep spectrum with spectral index 2 1.
Polarized flux is detected in the diffuse radio sources at 1.4 GHz, as shown in Fig. 2, where polarization vectors are overlayed onto the total intensity contours. The large relics (A and B) are polarized at a level of 30%. Polarized flux is also detected in the central region of the source C, at a level of 7%. No information on the rotation measure can be obtained, thus no attempt was made to correct the electric vectors for Faraday rotation.
3.2 Radio versus X-ray comparison
The X-ray emission of the cluster A548b has been analyzed by several authors. A temperature of kT= 3.1 0.1 keV is obtained from ASCA data (White 2000). No cooling flow is reported at the cluster center (White et al. 1997). The cluster vignetting-corrected X-ray surface brightness profile can be represented by a -model:
with = 0.52 and core radius rc = 115 arcsec (Neumann & Arnaud 1999), corresponding to 96 kpc.

In order to compare the radio emission with the X-ray emission, we have retrieved the X-ray image of A548 from the ROSAT archive (seq. number 800246). It was obtained with the Position Sensitive Proportional Counter (PSPC) for a total exposure time of 10.9 ksec. In Fig. 3 we show the overlay of the radio and X-ray images, for a morphological comparison. The radio image is the same as that presented in Fig. 1.
The centroid that we derive for the X-ray emission of A548b is consistent with the position given in the REFLEX catalogue RA2000 = , DEC2000 = 25∘56′ 20′′ (Böhringer et al. 2004), and with the position of the dumbbell galaxy VV 162. The two relics A and B are at projected distances of 500 and 430 kpc from the cluster center and lie at the boundary of the X-ray brightness distribution. They are well outside of the cluster core radius, but still well within the conventional Abell radius.
Source C is clearly displaced from the cluster center and is located about 1′ (corresponding to 50 kpc) due NW, i.e. within the cluster core radius (unless strongly affected by projection effects).
4 Results from high resolution images
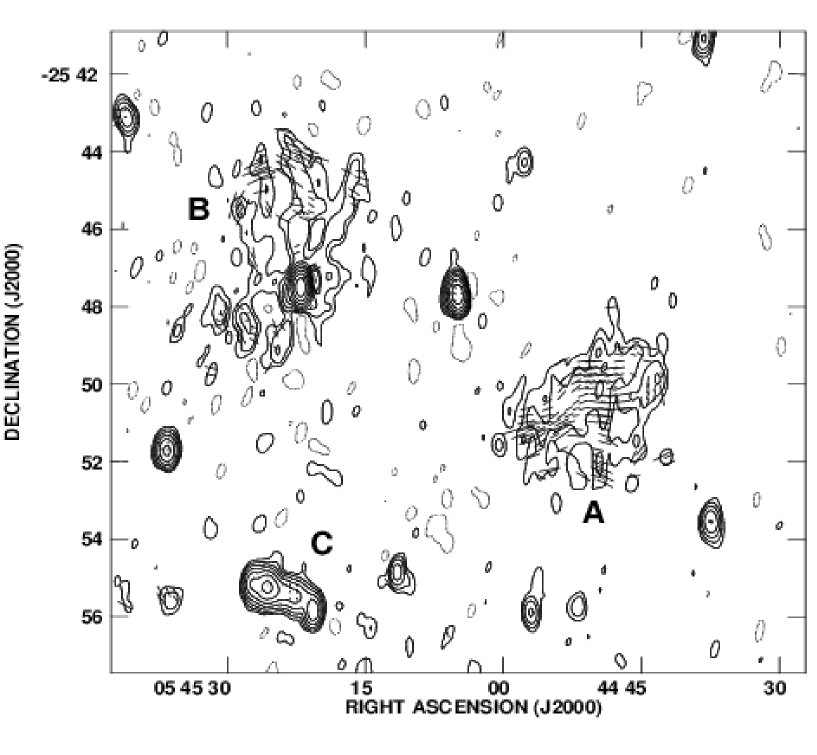
The two 1.4 GHz data sets from the ATCA (see Table 1) were concatenated to produce the contour image of Fig. 4, which is a naturally weighted map covering the same area as the VLA map of Fig. 1. The angular resolution of the ATCA map is 24.6′′ 8.0′′ (FWHM) in PA = 0.5∘ and the rms noise after three iterations of SELFCAL is 33 Jy/beam. Similar images were made at 1.7 and 2.5 GHz, but with somewhat higher rms noise of 52 and 41 Jy/beam, respectively. All images and the flux densities derived from them were corrected for primary beam attenuation. The resolution achieved at 2.5 GHz was 12.5′′ 4.2′′ in PA = 1.1∘.
The 1.7 and 2.5 GHz images were useful in obtaining spectra for the sources of interest in connection with the relics seen in Fig. 1. Information on individual radio sources is also obtained from the VLA data at 1.4, 4.8 and 8.4 GHz in the BnA configuration. The list of discrete sources, together with their flux densities, spectral indices and sizes, is given in Table 3, where flux densities at 843 and 408 MHz are from Reynolds (1986). Errors of the various parameters are given in parentheses. The three regions A, B and C (also No. 7), as well as the radio galaxy between the regions A and B (No. 6), are discussed below.
4.1 Region A
The higher-resolution ATCA image (Fig. 4) shows no sign of the smooth structure of relic A as seen in Fig. 1, but it shows five fairly compact sources numbered 1, 2, 3, 4 and 5 within the 4.5′ 3.5′ area occupied by the relic. The same sources are present in the 1.7 GHz image (not shown), enabling estimates of their spectral indices (see Table 3). These sources also appear as peaks in the brightness contours of Fig. 1. None of these sources can be identified with galaxy or stellar images on the Digitized Sky Survey (DSS), e.g in SuperCosmos (see http://www-wfau.roe.ac.uk/sss). The spectral indices of sources 1 and 2 are particularly highly negative, indicating that they probably represent the peaks of fine structure present in the relic’s emission. Sources 3 and 4 have more normal spectral indices, although still quite negative. Source 5 has a steep enough spectrum to again associate it with fine structure in the relic’s emission. It is not surprising that these sources are not detected on the 2.5 GHz image as their flux densities would fall below the 4 detection limit of 0.16 mJy/beam. We note that the spectral indices for sources 1, 2 and 5 are in a similar extreme range as those recorded by Slee et al (2001) in the relics associated with A13, A85, A133 and A4038.
4.2 Region B
The 1.4 GHz ATCA image in Fig. 4 shows that the relatively strong source No. 11 (PMN J05452547) is surrounded on the western side by more diffuse patches 8, 9 and 10, which are associated with the more extended diffuse structure seen in the VLA image of Fig. 1. The faint extension of source 11 to the SW, visible in Fig. 4, is confirmed in the 1.7 GHz image. Sources 8 and 9 appear in similar positions on the 1.7 GHz image, but there is no clear evidence for source 10. These diffuse patches do not appear to be associated with optical images on any of the SuperCosmos plates. Source No. 12 also appears to be associated with the SE extension of the B-relic in Fig. 1. However, it is coincident with an elliptical galaxy with mR 18.6, so the source cannot be considered as part of the relic.
Source 11 is identified with the bright cluster galaxy ESO 488-G006 (PGC 17735, MCG-04-14-021, 2MASXi J0545220-254729) at z = 0.0385 and J2000 position = 05h 45m 22.1s, 25∘47′ 30′′. It is classified as Sab (Dressler 1980) or S0 (ESO-Uppsala Catalogue, Lauberts 1982) with mR 14. Its redshift is consistent with it being a high-velocity member of A548b. In the VLA images at 1.4 GHz and 5 GHz it is pointlike at the resolution of about 1′′. Based on the optical identification and its radio structure, any connection to the diffuse emission B is unlikely.
The diffuse patches 8, 9 and 10 in Fig. 4 are not well fitted by elliptical Gaussians, and the details of their structure differ from those in the 1.7 GHz image. Only their peak brightness values are listed in Table 3, but their poor accuracy permits only upper limits to be assigned to their brightness spectral indices. The spectral index of 10 is particularly highly negative, indicating that these three patches are very likely the brightest peaks in the fine structure of the relic. Therefore we conclude that significant fine structure with a steep negative spectrum is present in the B-relic.
4.3 Source 6
The source No. 6 is located approximately midway between the two relics A and B (Figs. 1 and 4). Thus, it might be the nucleus of a double-lobed radio galaxy, whose extended lobes are the diffuse sources A and B. We have analyzed the structure of source 6, by means of high resolution VLA images at different frequencies, to investigate if it could be connected to the relics.

This source is identified with PGC 17721, a cluster galaxy at a redshift = 0.0358, J2000 position = , 25∘47′ 40.3′′, classified as S03p (Dressler 1980). Its high-resolution radio structure obtained in C-band (Fig. 5) is that of a classical double-lobed source, with a prominent nucleus, no clear jets and an overall orientation in position angle 25∘(from N to E). This structure is confirmed by the image at 8.5 GHz (not shown). Thus, this structure is oriented at a quite different position angle with respect to the direction of the sources A and B (about 60∘).
If the diffuse sources A and B were the extended lobes of a single radio galaxy, the latter would have a total projected size of 650 kpc, and a total 1.4 GHz power of 3 1023 W Hz-1. In the size-power diagram, this source would be among the largest sources for that power. For this reason and for its high-resolution structure, we consider the radio galaxy No. 6 as unrelated to the diffuse sources A and B, and confirm the classification of the diffuse features as relics.
4.4 Region C
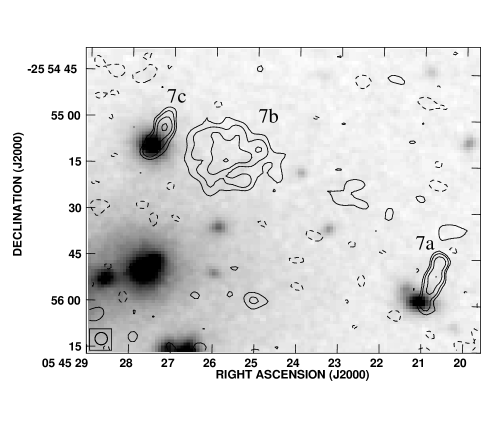
The diffuse source C (No. 7 in Fig. 4) consists of three components 7a, 7b and 7c. This source complex lies within 1′ of the X-ray emission centroid marked X in Fig. 4 (Sect. 3.2), and of the dumbbell galaxy.
In the higher-resolution VLA image (Fig. 6) at 1.4 GHz, a central diffuse emission and two brighter and more compact spots are visible. The latter two are elongated in a radial direction with respect to the map pointing centre (see Table 1), thus at least part of their elongation is likely due to bandwidth smearing. The total flux density of this complex in the high-resolution image (Tab. 3) is only about 1/3 of that in the image at lower resolution (Tab. 2), thus indicating the presence of diffuse structure of lower brightness. We note here that no sign of a radio source coincident with the brightest cluster galaxy is detected.
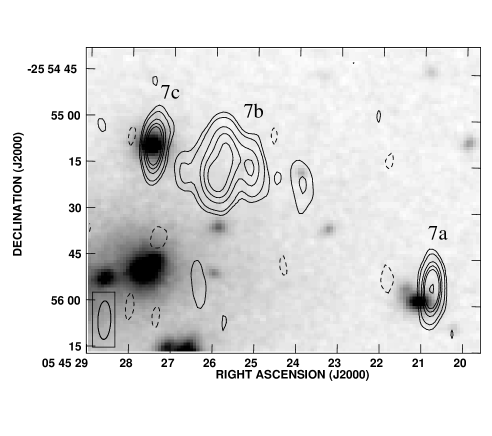
The same structure is visible in the 2.5 GHz image shown in Fig. 7. Due to the lack of sufficiently short baselines, the flux densities of the strongest component 7b at 1.4 and 2.5 GHz are seriously underestimated and no believable spectrum can be fitted. Components 7a and 7c, with much smaller angular sizes, yield more reasonable flux densities and spectral indices, which are listed in Table 3. The total flux in the three components is well defined at all frequencies except 2.5 GHz, where the low flux density is largely due to the low value for 7b. The total flux measurements yield a spectral index of = 0.80 0.06, which is more typical of a radio galaxy than a relic and would not support the idea that 7b, which contributes the major fraction of the total flux, is a relic of the usual type. Perhaps the most unusual source of the trio is 7c, which has a flat spectrum ( 0). The overlay to the optical image (Figs. 6 and 7) and reference to NED reveal the presence of two bright galaxies in this complex. The only galaxy that appears to be definitely associated with the C-complex is 2MASXi J0545274-255509, which is a mR 15 elliptical within 1′′ from the position of 7c. Dressler & Shectman (1988) report a redshift z = 0.0422 for this galaxy, thus 7c is clearly identified with a galaxy in A548b. Also the galaxy close to 7a is a member of the cluster, but is probably not related to the radio source. Both the absence of an identification for 7b and its diffuse radio structure are at least consistent with its status as a radio relic, despite the relatively normal spectral index of the C complex. Source 7b may also be a very distant radio galaxy with an optical counterpart below the DSS plate limits, but we consider this unlikely because of the source’s amorphous morphology, the lack of a compact nucleus and the missing flux at high resolution. Moreover, a rather large size, of about 500 kpc, would be derived for a radio galaxy at a redshift 1. Finally, we cannot exclude the possibility that source 7b is a lobe of either source 7a or 7c, however the lack of a symmetric lobe located on the opposite side of the presumed nucleus would lead to a quite unusual radio structure.
5 Discussion
The radio data presented in this paper provide clear evidence that both diffuse sources A and B are cluster relics. Indeed they are located at the cluster periphery, and they show diffuse morphology, no connection to cluster galaxies, steep spectrum, and a high level of polarization. The presence of two relics associated with the intracluster medium (ICM) makes the cluster A548b very peculiar in the radio domain.
This cluster is the first case where two relics are found to be located on the same side with respect to the cluster center. The two relics A and B show a roundish structure, and are about 300 kpc in size. They are highly polarized, as commonly found in cluster relics (see e.g. Slee et al. 2001, Govoni & Feretti 2004). These relics lie well within one Abell radius (2 Mpc with the adopted cosmology), thus they cannot be classified as edge-located relics unless they lie in the far front or back of the cluster. In this respect their projected distance from the cluster centre is similar to that of the relic in A85, discussed by Giovannini & Feretti (2000) and Slee et al. (2001) and modeled by Enßlin & Brüggen (2002). Spectral data on the A- and B-relics are presently very limited, with the only indication of 2 from the comparison of VLA images in L-band (Sect. 3.1). The radio emission peaks numbered 1, 2 and 5 in the A-relic have extremely high negative spectral indices between 1.4 GHz and 2.5 GHz, indicating that fine structure is present over the greater part of the relic. For the B-relic we can place an upper limit of 2 on the brightest peak (No. 10) in the fine structure.
It is worth mentioning that, since the two relics are located on the same side with respect to the cluster center, they could be connected to each other, through a very low brightness emission. The total size of this single relic would be about 650 kpc, and its shape would be elongated roughly perpendicularly to the cluster radius, as found in giant relics in cluster peripheral regions (Giovannini & Feretti 2004). The orientation of the magnetic field that we observe (Fig. 2) seems not aligned with the elongated structure, as expected and detected in relics, but the lack of information about Faraday rotation does not allow us to draw any conclusion.
The status of the C-complex is very uncertain. It seems probable that the more compact components 7a and 7c are not physically related to the more extended 7b, although all lie in projection within 50 kpc of the X-ray centroid and the galaxy VV 162. The total flux measurements yield a fairly normal spectral index indicative of a radio galaxy. If such is the case, however, one would expect to detect a galaxy much brighter than the DSS plate limits lying well within its contours. Thus the C-complex might contain the brightest radio sources in a distant cluster well beyond A548b. However, the amorphous morphology, the absence of an active nucleus, and the presence of emission of very low surface brightness as derived by the comparison between the total flux density in the low- and high-resolution images (see Sect. 4.4) are in favor of a diffuse nature for this complex, which we thus consider a possible relic candidate. We remark that, because of the flux missing in the high-resolution images, the diffuse emission should extend further out of the structure labeled 7b, detected in Figs. 6 and 7.
Small-size relics, although with quite steep spectra, have been detected in A133 and A4038, located near the brightest cluster galaxy (BCG), but not coincident with it. For these sources, a connection to the activity of the BCG is not clear (but see Fujita et al. 2002 for A133). It has been speculated (see e.g. Giovannini & Feretti 2004) that, if these diffuse sources would be old lobes of a previous activity of the central galaxy, an almost symmetric double structure centered on the galaxy should be detected in most cases.
Radio relics are detected in clusters both with and without a cooling flow, suggesting that even minor or off-axis mergers may play an important role in the external cluster regions. Theoretical models for the origin of relics propose that they are tracers of shock waves in merger events (Enßlin et al. 1998, Enßlin & Brüggen 2002). A fraction of the energy dissipated in shock waves can be transferred to relativistic particle populations. Accelerated relativistic electrons have short radiative lifetimes and should therefore produce the radio relic emission close to the current location of the shock waves.
The clusters of the A548 complex are likely in a state of interaction, thus the presence of relics in A548b confirms the association between relics and mergers. In this framework, the relics A and B would trace a shock wave in an outer cluster region, whereas the source C, if confirmed as a relic, would indicate a much more internal shock wave. In this respect, this cluster offers a unique scenario to investigate the evolution of a cluster merger.
6 Conclusions
From the results and discussion presented in this paper we derive the following conclusions.
Extensive radio observations of the two diffuse radio sources A and B in the the cluster of galaxies Abell 548b confirm their classification as radio relics. The two relics, of similar flux density, extent, shape, polarization and spectral index, are located at projected distances of about 430 and 500 kpc from the cluster center, on the same side of the cluster’s X-ray peak.
We present images at high resolution of the cluster and measure radio spectral indices of discrete radio sources embedded within the diffuse features. We attempt to distinguish emission peaks of the diffuse sources from unrelated sources, and we find that both relics show possible fine structure, when observed at high resolution. We analyze the high resolution images of the strong radio source located approximately midway between the two relics, and conclude that it has very likely no physical connection to the diffuse sources.
Another diffuse source C is detected close in projection to the cluster center. High-resolution images show that it contains two discrete radio sources 7a and 7c and a diffuse component 7b. The nature of this complex is uncertain. It seems probable that the more compact components are not physically related to the more extended one, although all lie in projection within 50 kpc of the X-ray centroid and the galaxy VV 162. Although the spectral index of the complex is fairly normal, the amorphous morphology of the extended component, the absence of an active nucleus, and the missing flux in the high-resolution images, are in favor of a diffuse nature for this complex, which we thus consider a possible relic candidate.
We suggest that the two external relics may trace the same shock wave in the outer cluster region, whereas the possible relic close to the cluster center would indicate a much more internal shock wave. Future studies in the radio and X-ray domains will allow to detect the details of the merger process and shed more light on the connection between cluster mergers and the formation of radio relics.
Acknowledgments
We thank Loretta Gregorini for kindly supplying the 4.8 GHz image of the central cluster region. We are indebted to B. Komberg for valuable comments. We acknowledge the anonymous referee for useful suggestions.
This work has been partially supported by the Italian Ministry for University and Research (MIUR) under grant PRIN 2004029524-002. H.A. acknowledges support from CONACyT grant 40094-F.
This research has made use of the NASA/IPAC Extragalactic Database (NED) which is operated by the Jet Propulsion Laboratory, California Institute of Technology, under contract with the National Aeronautics and Space Administration. We also made use of the database CATS (cats.sao.ru, see Verkhodanov et al., 1997) of the Special Astrophysical Observatory.
The National Radio Astronomy Observatory is operated by Associated Universities, Inc., under contract with the National Science Foundation.
The Compact Array is part of the Australia Telescope, which is funded by the Commonwealth of Australia for operation as a National Facility managed by CSIRO.
References
- (1) Andreuzzi G., Bardelli S., Scaramella R., Zucca E., 1998, A&A 337, 17
- (2) Böhringer H., Schuecker P., Guzzo L., et al., 2004, A&A 425, 367
- (3) Colless M., Saglia R.P, Burstein D., Davies R.L., McMahan R.K. Jr, Wegner G., 2001, MNRAS 321, 277
- (4) Condon J.J., Cotton W.D., Greisen E.W., Yin Q.F., Perley R.A., Taylor G.B., Broderick J.J., 1998, AJ 115, 1693
- (5) Davis D.S., Bird C.M., Mushotzky R.F., Odewahn S. C, 1995, ApJ 440, 48
- (6) Den Hartog, R., Katgert P., 1996, MNRAS 279, 349
- (7) Dressler A., 1980, ApJS 42, 565
- (8) Dressler A., Shectman S. A., 1988, AJ 95, 284
- (9) Enßlin T.A., Biermann P.L., Klein U., Kohle S., 1998, A&A 332, 395
- (10) Enßlin T.A., Brüggen M., 2002, MNRAS 331, 1011
- (11) Escalera E., Biviano A., Girardi M., Giuricin G., Mardirossian F., Mazure A., Mezzetti M., 1994 ApJ 423, 539
- (12) Feretti L., 2003, in Texas in Tuscany, XXI Symp. on Relativistic Astrophysics, eds. R. Bandiera, R. Maiolino, F. Mannucci, World Scientif. Publ. Singapore, p. 209
- (13) Fujita Y., Sarazin C.L., Kempner J.C., Rudnick L., Slee O.B., Roy A.L., Andernach H., Ehle M., 2002 ApJ 575, 764
- (14) Giovannini G., Tordi M., Feretti L., 1999, New Ast. 4, 141
- (15) Giovannini G., Feretti L., 2000, New Ast. 5, 335,
- (16) Giovannini G., Feretti L., 2004, J. Korean Astron. Soc. 37, 323
- (17) Govoni F., Feretti L., 2004, Int. J. Mod. Phys. D, Vol. 13, N. 8, p. 1549
- (18) Gregorini L., de Ruiter H.R., Parma P., Sadler E.M., Vettolani G., Ekers R.D., 1994, A&AS 106, 1
- (19) Giovannini G., Tordi M., Feretti L., 1999, New Astronomy 4, 141
- (20) Lauberts A., 1982, ESO/Uppsala Survey of the ESO(B) Atlas, ESO, Garching
- (21) Marvel K.B., Shukla H., Rhee G., 1999, ApJS 120, 147
- (22) Neumann D.M., Arnaud M., 1999, A&A 348, 711
- (23) Nikogossian E.H., 2001, Ap 44, 23
- (24) Reynolds J.E., 1986, Radio Emission from Galaxies in Abell Clusters, PhD Thesis, University of Sydney
- (25) Slee O.B., Roy A.L., Murgia M., Andernach H., Ehle M., 2001, AJ 122, 1172
- (26) Smith R.J., Hudson M.J., Nelan J.E., et al., 2004, AJ 128, 1558
- (27) Struble M.F., Rood H.J., 1999, ApJS 125, 35
- (28) Verkhodanov O.V., Trushkin S.A., Andernach H., Chernenkov V.N., 1997, in Astronomical Data Analysis Software and Systems – VI, ASP Conf. Ser. 125, p. 322, eds. G. Hunt & H.E. Payne, San Francisco: Astron. Soc. Pacific
- (29) Wegner G., Colless M., Saglia R.P., McMahan R.K., Davies R.L., Burstein D., Baggley G., 1999, MNRAS 305, 259
- (30) White D.A., Jones C., Forman W., 1997, MNRAS 292, 419
- (31) White D.A., 2000, MNRAS 312, 663
![[Uncaptioned image]](/html/astro-ph/0601572/assets/x8.png)