VLT spectroscopy and non-LTE modeling of the C/O-dominated accretion disks in two ultracompact X-ray binaries††thanks: Based on observations made with ESO Telescopes at the Paranal Observatory under programme ID 72.D-0013(A).
Abstract
Aims. We present new medium-resolution high-S/N optical spectra of the ultracompact low-mass X-ray binaries 4U 0614+091 and 4U 1626-67, taken with the ESO Very Large Telescope. They are pure emission line spectra and the lines are identified as due to C ii-iv and O ii-iii.
Methods. Line identification is corroborated by first results from modeling the disk spectra with detailed non-LTE radiation transfer calculations. Hydrogen and helium lines are lacking in the observed spectra.
Results. Our models confirm the deficiency of H and He in the disks. The lack of neon lines suggests an Ne abundance of less than about 10 percent (by mass), however, this result is uncertain due to possible shortcomings in the model atom. These findings suggest that the donor stars are eroded cores of C/O white dwarfs with no excessive neon overabundance. This would contradict earlier claims of Ne enrichment concluded from X-ray observations of circumbinary material, which was explained by crystallization and fractionation of the white dwarf core.
Key Words.:
Accretion, accretion disks – Binaries: close – X-rays: binaries – Stars: individual: 4U 0614+091, 4U 1626-671 Introduction
Low-mass X-ray binaries (LMXBs) consist of a neutron star or black-hole accretor and a low-mass donor star (M 1 M⊙). Of particular interest are those systems with orbital periods Porb 80 min, which is the minimum period for LMXBs with hydrogen-rich main sequence donors. In these ultracompact binaries (UCBs) the mass donor must be a non-degenerate hydrogen-deficient star or a white dwarf (e.g. Verbunt & van den Heuvel 1995). Currently eight such systems with measured orbital periods (Porb=11-50 min) are known (Ritter & Kolb 2003).
In the recent past, the existence of a group of five ultracompact systems with neon-rich white dwarf donors has been claimed based on X-ray spectral properties (Schulz et al. 2001, Juett et al. 2001, Juett & Chakrabarty 2003). The donors are then C/O or even O/Ne/Mg white dwarfs that have transferred a significant fraction of their mass to the neutron star, in contrast to the usual wisdom that the donors are the remains of He white dwarfs. This has caused new explorations of the formation of these systems (e.g. Yungelson et al. 2002). Our motivation for studying these systems is that the stripped donor stars offer the possibility to probe the interior composition of white dwarfs, which depends on the interplay of gravitational settling and crystallization of chemical elements.
Three of these five Ne-rich systems belong to the above-mentioned eight UCBs with measured orbital periods, while two of them are believed to be UCBs because of their similar optical and X-ray properties. The class of Ne-rich UCBs consists of:
| (1) 4U 1626-67 | (Porb=41 min) |
| (2) 4U 0614+091 | |
| (3) 2S 0918-549 | |
| (4) 4U 1543-624 | (Porb=18 min, Wang & Chakrabarty 2004) |
| (5) 4U 1850-087 | (Porb=20 min) |
And 4U 1626-67 may be regarded as the prototype of this class. The donor’s Ne-rich C/O-WD nature is derived from X-ray and ultraviolet spectra that exhibit double-peaked emission lines that obviously stem from the accretion disk (Schulz et al. 2001, Homer et al. 2002).
The close relation of the other four objects (2) – (5) to 4U 1626-67 was based on extraordinary high Ne/O abundance ratios (when compared to the ISM value) measured from ASCA spectra of (3)–(5) and a Chandra spectrum of (2). The spectra exhibit photoelectric absorption edges of neutral O and Ne in the interstellar medium (ISM) along the line-of-sight, which is suspected to originate from expelled material close to the binary systems. New X-ray spectroscopic observations of (3) and (4) obtained with Chandra and XMM-Newton confirmed the ASCA results, although different values for the Ne/O enrichment have been obtained from a Chandra and a XMM-Newton spectrum of (4) (Juett & Chakrabarty 2003). In contrast to the ASCA measurement of (5), recent XMM-Newton and Chandra observations found no evidence of an unusual Ne/O ratio (Sidoli et al. 2005, Juett & Chakrabarty 2005). These apparently contradictory results can be attributed to a variable Ne i/O i ratio due to changes in the ionisation structure in the measured absorption columns that, however, are not understood (Juett & Chakrabarty 2005). Hence, this means that the measured Ne/O ratio does not reflect the donor composition. Although the orbital periods of these systems are below 80 min (or at least believed to be so small), this does not necessarily mean that they contain C/O donors. For example, the X-ray burst properties of the 4U 1820-30 (Porb=11 min) suggest an He-WD donor in that ultracompact system (e.g. Strohmayer & Brown 2002). Another example are the relatively short X-ray bursts observed from (3) that even suggest H-burning of material accreted onto the neutron star (NS) (Jonker et al. 2001), while optical spectra suggest a C/O WD donor (Nelemans et al. 2004 and this work). A possible explanation is that the heavy elements (C, O, Ne) undergo spallation during accretion leaving H and He nuclei for thermonuclear burning on the NS (Bildsten et al. 1992). In a recent paper In’t Zand et al. (2005) conclude that the Ne/O ratio and the X-ray burst properties are all best explained with an He-rich donor.
In conclusion, the only way to confirm that the four systems (2)–(5) – besides the prototype (1) – indeed contain C/O-rich donors, perhaps enriched with Ne, is by UV and/or optical spectroscopy. Nelemans et al. (2004) show that the optical spectra of (2)–(4) are devoid of hydrogen and helium emission lines, which are usually seen in H- or He-rich accreting systems. Their spectra exhibit low-ionisation C and O emission lines, most prominent in the brightest of these objects, 4U 0614+091. In this paper we present new optical spectra of this system that cover a larger wavelength interval. They confirm the earlier conclusion by Nelemans et al. (2004) that the emission lines arise from the C/O-dominated material that is probably located in the accretion disk and not in the X-ray heated face of the white-dwarf donor. We also present a first detailed optical spectrum of the prototype 4U 1626-67, which mainly shows weak oxygen emission lines and proves the H- and He- deficiency in this system, too. Nelemans & Jonker (2005) also performed VLT observations of this system (also in spring 2004) with a similar setup. They show a section of their spectrum and emphasize the similarity with 4U 0614+91.
In addition we present results from first attempts to model the observed spectra with non-LTE accretion-disk models. We derive upper limits for the H and He abundances and investigate the formation of neon lines. Detailed C and O line-formation calculations can already qualitatively explain the observed emission lines. The ultimate goal is to derive detailed abundances and other disk parameters from the observed line profiles.
The paper is organised as follows. We describe our observations in the following section. We then present our line identifications in Sect. 3. Section 4 contains a description of our disk model calculations and we summarise and conclude in Sect. 5.
2 Observations
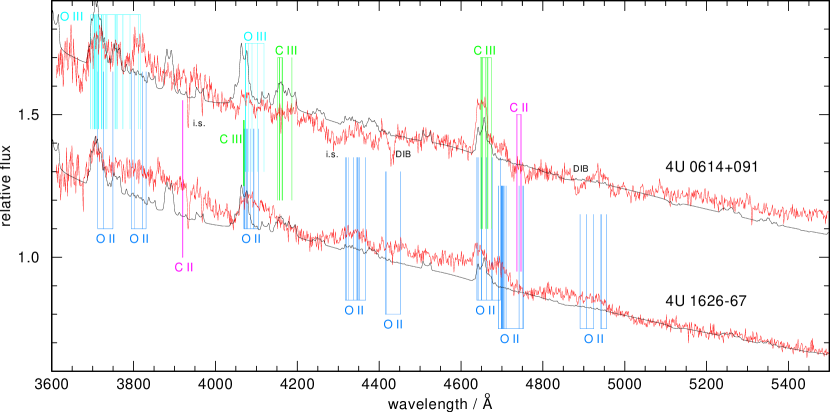
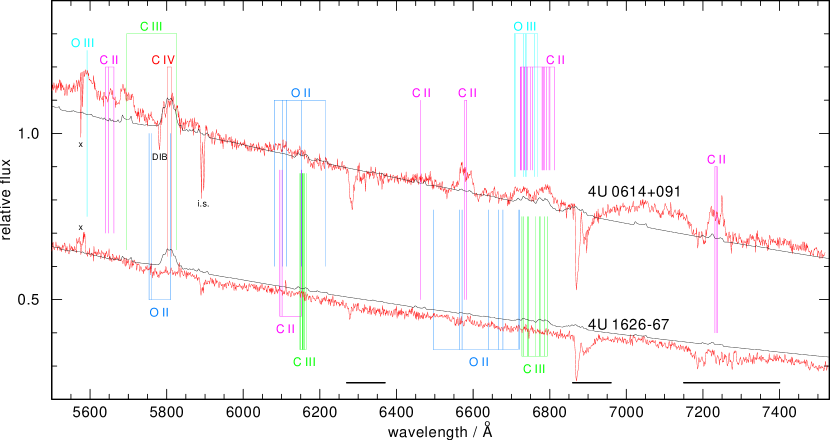
We obtained optical medium-resolution long-slit spectra of 4U 1626-67 and 4U 0614+091. The V magnitude of both systems is 18.5 (Ritter & Kolb 2003). We used the FORS1 spectrograph attached to UT1 of ESO’s Very Large Telescope (VLT) on Paranal in Chile. The slit width was 1″. We used two grisms (600B and 600R, the latter in combination with order separation filter GG435) and obtained spectra covering the regions 3600–6000 Å and 5400–7500 Å with a mean dispersion of 1.20 and 1.07 Å pix-1, respectively. Observations were performed in service mode between Nov. 2003 and Mar. 2004. Each target was observed at least twice, see Table 1 for details. For 4U 1626-67 the exposure time covers almost one orbital period so that any respective spectral variation is smeared out. The data were processed through the standard ESO reduction pipeline. In addition we performed a flux calibration using observations of the DA white dwarf EG 274 with the same instrumental setup. Since this flux standard was observed only once per wavelength range and since the science targets were mostly observed at different dates, this provides only a rough absolute flux calibration. For each object the spectra were co-added to obtain one final spectrum. The blue and red spectra are displayed in Figs. 1 and 2, respectively.
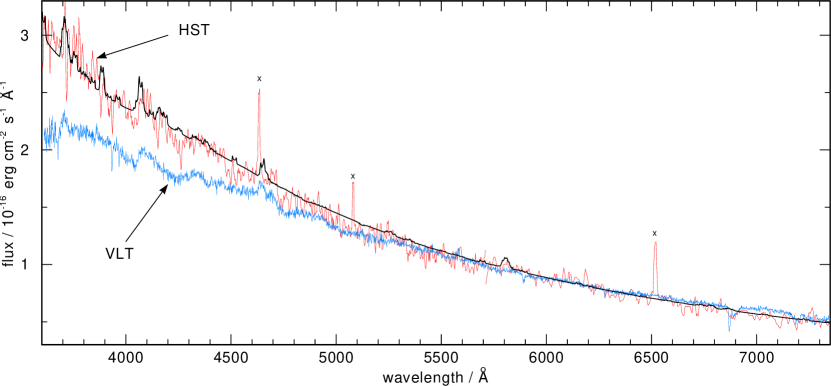
Archival spectra of 4U 1626-67 taken with the Hubble Space Telescope (HST) and the STIS instrument cover the complete UV/optical wavelength range (1150–10 000 Å). The FUV spectrum is described in detail by Homer et al. (2002) and a first comparison with synthetic accretion disk spectra was presented by Werner et al. (2004). In Fig. 3 we compare the optical HST spectrum taken from the MAST archive with our VLT spectrum on an absolute flux scale. The blue and red sections of the VLT spectrum were scaled by a factor of 1.65 and 1.45, respectively, to normalise them to the HST flux at 5600 Å. It is obvious that the VLT spectrum is not only weaker but also flatter than the HST spectrum. This can be attributed either to flux calibration problems or to source variability.
| Date, UT | Grism | Texp | Airmass | Seeing |
| (sec) | (arcsec) | |||
| 4U 0614+091 | ||||
| 2003 Nov. 04, 07:22:08 | 600B | 1735 | 1.22 | 0.73 |
| 2003 Nov. 04, 07:54:57 | 600B | 1735 | 1.20 | 0.78 |
| 2003 Nov. 03, 07:40:17 | 600R | 1735 | 1.21 | 1.00 |
| 2003 Dec. 15, 06:25:42 | 600R | 1735 | 1.28 | 0.52 |
| 2003 Dec. 15, 07:00:31 | 600R | 1735 | 1.37 | 0.57 |
| 4U 1626-67 | ||||
| 2004 Mar. 23, 08:22:00 | 600B | 1735 | 1.37 | 0.76 |
| 2004 Mar. 23, 09:01:42 | 600B | 1735 | 1.36 | 0.77 |
| 2004 Mar. 21, 08:48:53 | 600R | 1735 | 1.36 | 1.58 |
| 2004 Mar. 22, 08:19:40 | 600R | 1735 | 1.37 | 0.87 |
| 2004 Mar. 22, 09:00:00 | 600R | 1735 | 1.36 | 0.71 |
| 2004 Mar. 23, 07:41:51 | 600R | 1735 | 1.40 | 0.57 |
| EG 274 | ||||
| 2004 Mar. 23, 09:48:17 | 600B | 50 | 1.05 | 0.67 |
| 2004 Mar. 23, 09:53:25 | 600R | 40 | 1.05 | 0.67 |
| Feature | Observed in | Ion | Transition | Wavelength | |
|---|---|---|---|---|---|
| (Å) | 4U 0614+091 | 4U 1626-67 | (Å) | ||
| 3720 | + | + | O iii | 3p 3P – 3d 3Do | 3704–3732 |
| O iii | 3s 5P – 3p 5Do | 3695–3735 | |||
| O ii | 3s 4P – 3p 4So | 3713–3749 | |||
| 3815 | + | O ii | 3p 2Po – 4s 2P | 3794–3830 | |
| O iii | 3p 1D – 3d 1Po | 3817 | |||
| O iii | 3s 3Po – 3p 3D | 3755–3811 | |||
| 3920 | (+) | C ii | 3p 2Po – 4s 2S | 3919, 3921 | |
| 4075 | + | + | O ii | 3p 4Do – 3d 4F | 4070–4111 |
| C iii | 4f 3Fo – 5g 3G | 4068–4070 | |||
| O iii | 3s 3P – 3p 3Do | 4073–4119 | |||
| 4180 | + | C iii | 4f 1Fo – 5g 1G | 4187 | |
| C iii | 2p3p 3D – 2s5f 3Fo | 4153–4163 | |||
| 4345 | + | + | O ii | 3s 4P – 3p 4Po | 4317–4367 |
| O ii | 3s’ 2D – 3p’ 2Do | 4347–4351 | |||
| 4410 | + | (+) | O ii | 3s 2P – 3p 2Do | 4415–4452 |
| 4650 | + | + | C iii | 3s 3S – 3p 3Po | 4647–4651 |
| C iii | 3s 3Po – 3p 3P | 4651–4674 | |||
| O ii | 3s 4P – 3p 4Do | 4639–4696 | |||
| 4710 | + | + | O ii | 3p’ 2Po – 3d’ 2P | 4691–4702 |
| O ii | 3p 2Do – 3d 2F | 4699–4742 | |||
| O ii | 3p’ 2Do – 3d’ 2F | 4698–4703 | |||
| O ii | 3p 2Do – 3d 4D | 4710–4753 | |||
| 4745 | (+) | C ii | 2s2p2 2P – 2s23p 2Po | 4735–4747 | |
| 4940 | + | (+) | O ii | 3p 2Po – 3d 2D | 4941–4956 |
| O ii | 3p 4So – 3d 4P | 4891–4925 | |||
| 5590 | + | (+) | O iii | 3s 1Po – 3p 1P | 5592 |
| 5650 | + | C ii | 3s 4Po – 3p 4S | 5641–5662 | |
| 5695 | + | C iii | 3p 1Po – 3d 1D | 5696 | |
| 5810 | + | O ii | 2p4 2P – 3p’ 2Do | 5754–5810 | |
| C iv | 3s 2S – 3p 2Po | 5801, 5812 | |||
| C iii | 2s4d 1D – 2p3d 1Fo | 5826 | |||
| 6100 | + | C ii | 3p 2P – 3d 2Do | 6095–6103 | |
| O ii | 3p 2Po – 3s 2S | 6081, 6103 | |||
| O ii | 4s 4P – 3s 4So | 6113, 6153 | |||
| 6150 | + | C iii | 2s4d 3D – 2p3d 3Do | 6148–6164 | |
| C ii | 4d 2D – 6f 2Fo | 6151 | |||
| O ii | 4s 4P – 3s 4So | 6113, 6153, 6214 | |||
| 6460 | + | C ii | 4f 2Fo – 6g 2G | 6462 | |
| 6580 | + | C ii | 3s 2S – 3p 2Po | 6578, 6583 | |
| O ii | 3d 2F – 4p 2Do | 6496, 6565, 6571 | |||
| 6730 | + | C ii | 4d 2D – 6p 2Po | 6723 | |
| C ii | 3p 4D – 3d 4Do | 6725–6755 | |||
| C iii | 3s 3Po – 2p 3D | 6727–6773 | |||
| O ii | 3s 2P – 3p 2So | 6641, 6721 | |||
| O ii | 3d 2P – 4p 2Po | 6667, 6678, 6718 | |||
| O iii | 4d 3Do – 3s 3D | 6707–6768 | |||
| 6790 | + | C ii | 3s 4Po – 3p 4D | 6780–6812 | |
| C iii | 2p3d 3Po – 2s6s 3S | 6775–6793 | |||
| 7235 | + | C ii | 3p 2Po – 3d 2D | 7231–7237 | |
3 Line identification
Emission lines from hydrogen and helium are completely lacking in the VLT spectra of both systems. We detect neither Balmer lines nor lines from He i (e.g. 4471 or 5876 Å) or He ii (e.g. 4686 Å), which are usually seen in optical spectra of interacting binaries. In the following two sections we discuss the line spectra of both systems in detail. Line identification is performed “by eye” without an equivalent-width estimation.
3.1 4U 0614+091
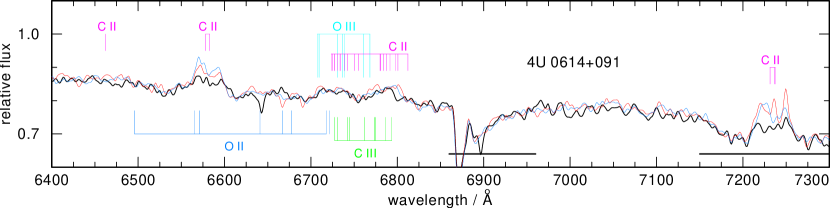
The spectrum of 4U 0614+091 shows numerous emission features that can be assigned to ionized carbon and oxygen, namely C ii-iv and O ii-iii. The detected emission features are listed in Table 2 together with possible line identifications. Most features are blends of lines from at least two ions, making interpretation quite difficult, but some of them are probably unblended. These are the features at 5590 Å (O iii), 5650 Å (C ii), 5695 Å (C iii), and 7235 Å (C ii). The emission features at 4710 and 4940 Å are perhaps exclusively due to O ii, but they are blends of four and two multiplets from this ion, respectively. Nelemans et al. (2004) present optical spectra of this star taken with VLT+FORS2 with slightly different wavelength coverage (4620–8620 Å). We essentially confirm the detection of their emission features and line identifications, however, our spectra extend to shorter wavelengths, down to 3600 Å, which allows us to detect some additional emission lines. On the other hand, we do not see four of the weak emission features identified in the Nelemans et al. (2004) spectra (at 5140, 5190, 5280, and 6070 Å). This could be the consequence of line variability. In Fig. 4 we compare our single spectra of 4U 0614+091 in detail, and it is possible that the emission strength of the strongest C ii lines is variable on a time scale of weeks. In order to assess the significance of this variability, we simulated several times with different noise the strongest emission features observed on Nov. 3 and Dec. 15, applying the S/N ratio of the VLT spectra. We find a 2 probability that the variability is real. The line widths correspond to a projected rotational velocity of the order 1200 km s-1.
3.2 4U 1626-67
The spectrum of 4U 1626-67 clearly shows less features than does that of 4U 0614+091. Only five emission lines can be detected in the blue spectrum (see Table 2) and they are seen in both binaries. The red spectrum of 4U 1626-67 is virtually continuous. The strong C ii emissions seen in 4U 0614+091 at 6580 Å and 7235 Å are lacking in 4U 1626-67. That could point to a higher ionisation of carbon in 4U 1626-67, although the C iv 5810 Å line is lacking, too. The presence of O ii lines in the blue spectrum of 4U 1626-67 (e.g. at 4345 Å) also contradicts a higher ionisation, rather, it appears that the differences in the spectra of both binaries could be assigned to a different C/O ratio, being higher in 4U 0614+091. The entire set of emission lines in 4U 1626-67 could be due to oxygen alone, but in the UV spectrum C is clearly present (Homer et al. 2002). In addition, the line widths appear broader than in 4U 0614+091, however, this is difficult to quantify because of possible line blends and an uncertain identification of the continuum.
4 Exploratory disk models
We began the construction of accretion disk models to calculate synthetic spectra and report here on the current state of our work. We use our accretion disk code AcDc, which is described in detail by Nagel et al. (2004). In essence, it assumes a radial -disk structure (Shakura & Sunyaev 1973). Then the disk is divided into concentric annuli. For each annulus we solve the radiation transfer equation (assuming plane-parallel geometry) together with the non-LTE rate equations for the atomic level populations, plus energy- and hydrostatic equations, in order to calculate a detailed vertical structure. The integrated disk spectrum is then obtained by co-adding the specific intensities from the individual annuli, accounting for inclination and Keplerian rotation.
It is not the aim of this paper to present a detailed fit to the emission line spectra of the two binaries. This requires extensive parameter studies that are extremely time consuming. We rather choose to calculate synthetic spectra from selected disk regions in which we believe the physical properties are representative for the formation of the observed optical spectra. This should at least give a rough idea of the relative strength of lines from different ionisation stages and, thus, is primarily thought to put our line identifications on firm ground. At present we neglect irradiation of the disk by the neutron star, because it would introduce new free parameters. We expect that the radial ionisation structure of the disk will be shifted to larger radii when irradiation is taken into account, but we hope that the relative line strengths are not affected to the extent that our identifications become completely wrong. Although the studied systems are strong X-ray sources, we do not see recombination lines from highly ionised species in the optical spectra as might be expected. It is conceivable that the outer parts of the disks in which the optical spectrum arises is shielded from X-ray irradiation by an inflated inner-disk region.
| Element | Ion | NLTE levels | Lines |
|---|---|---|---|
| H | I | 10 | 45 (8) |
| II | 1 | – | |
| He | I | 29 | 61 (16) |
| II | 14 | 91 (14) | |
| III | 1 | – | |
| C | I | 7 | 4 (0) |
| II | 38 | 160 (42) | |
| III | 58 | 329 (143) | |
| IV | 9 | 17 (2) | |
| V | 1 | – | |
| O | I | 1 | – |
| II | 29 | 82 (56) | |
| III | 36 | 42 (47) | |
| IV | 11 | 5 (0) | |
| V | 6 | 4 (0) | |
| VI | 1 | – | |
| Ne | I | 3 | 0 |
| II | 68 | 232 (49) | |
| III | 4 | 0 (0) | |
| IV | 1 | – |
Since we do not compute the spectrum of the entire disk, we cannot expect to match the overall observed continuum flux, and we have already pointed out that there are problems with the absolute flux calibration. We use interstellar reddening as a free parameter in order to roughly fit the model to the observed flux level. The applied reddening is given in the figure captions.
The synthetic spectra presented here are based on the following choice of disk-model parameters. The central object is a neutron star with 10 km radius and a mass of 1.4 M⊙. The mass accretion rate is M⊙/yr. The disk extends from 1000 to 2000 stellar radii. The corresponding Keplerian velocities at these radii amount to 4300 and 3000 km s-1, and the effective temperatures to 47 000 K and 28 000 K, respectively. The disk is divided into five annuli such that decreases almost linearly with radius steps. The inclination angle is set to 10. The Reynolds number used to parametrise the disk viscosity was set to 10 000, which corresponds to . The chemical composition is C=50% and O=50% (by mass).
For the opacity and emissivity calculations, it is essential to solve the non-LTE rate equations with detailed model atoms. Our main emphasis was put on the C ii-iii and O ii-iii ions. The number of non-LTE levels and radiative line transitions are summarised in Table 3. Level energies, oscillator strengths, and bound-free cross-sections for photoionisation are taken from the Opacity Project (Seaton et al. 1994) TOPbase111http://vizier.u-strasbg.fr/topbase/topbase.html. Electron collisional rates for (de-) excitation, ionisation, and recombination are computed with the usual approximate formulae. The neon model atom was taken from Dreizler (1993). For the final spectrum synthesis, fine structure splitting of atomic levels must be considered; level populations were taken from the models with appropriate statistical weights. Level energies were obtained from the NIST222http://physics.nist.gov/ database. The optical synthetic spectra finally include a total number of 377 lines from H i, He i-ii, C ii-iv, O ii-iii, and Ne ii. They essentially contain most of the possible C and O line identifications given in Table 2, plus many others that turn out to be too weak to be seen in the rotationally broadened spectra.
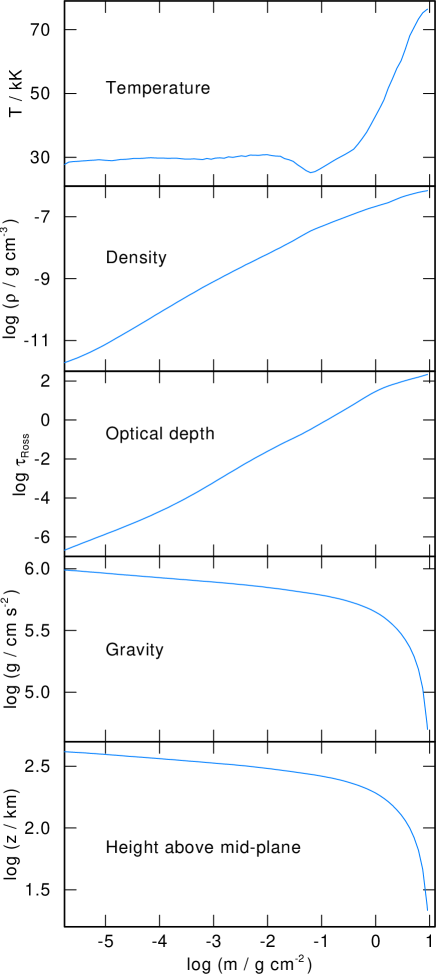
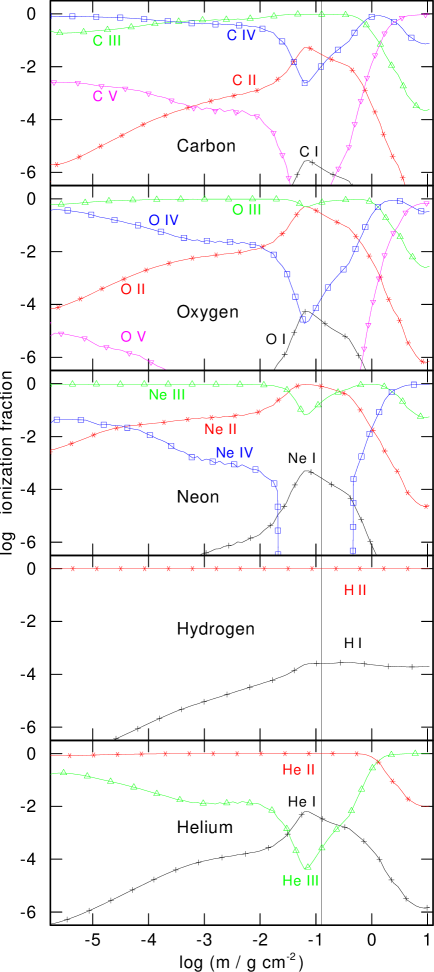
As an example we present the vertical structure of the accretion disk model at a distance of 2000 stellar radii from the neutron star. The emergent flux at this location corresponds to =28 000 K. Figure 5 shows the run of several quantities above the disk midplane on a column mass scale . The Rosseland optical depth reaches unity at . Here the gravity amounts to =5.8. Mass and electron densities are g cm-3 and cm-3, respectively. Hence the physical conditions in the line-forming regions are comparable to those in the atmosphere of a subluminous B star. The vertical distribution of ionic fractions of C and O is shown in Fig. 6. There we also show the H, He, and Ne fractions that were taken from the test models that include these species in an amount of 10%. The dominant ionisation stages of oxygen at are O ii and O iii, giving rise to prominent emission lines of these ions in the spectra. In the case of carbon, C iii dominates, closely followed by C ii and C iv. This explains why we see lines from three C ions. The dominant neon ions in the line-forming regions are Ne ii and Ne iii. For helium we have He ii dominating, followed by He i, so we would expect strong lines from these ions if neon and helium were abundant. Hydrogen is ionised by about 99.9%, but still, prominent emission lines are predicted if H were an abundant species (see below).
4.1 C and O lines compared to observations
The synthetic spectrum is plotted together with the observed spectra in Figs. 1 and 2. Let us first consider 4U 0614+091. Generally, many of the observed features are also seen in the model, although they do not match the strength. This basically corroborates our line identifications. The C ii lines of the model are too weak (e.g. at 6580 Å and 7235 Å), while the C iii emissions are in some cases too weak (e.g. 4650 Å) or in other cases too strong (4180 Å). The C iv 5810 Å line matches well. The oxygen lines show a similar behaviour. The O ii lines of the model are too weak (e.g. at 4940 Å). Some lines of O iii match reasonably well (e.g. at 3720 Å), while others do not (e.g. at 5590 Å, which is much too weak in the model).
The model comparison with 4U 1626-67 confirms our ideas from the first inspection of the spectrum. The lines in the blue region can be explained qualitatively by the mere presence of oxygen lines. This, and the missing C iv 5810 Å line might originate in a relatively low C/O ratio when compared to 4U 0614+091.
It is disappointing that our NLTE disk model obviously gives a poorer fit to the observed line spectrum than the simple isothermal, constant-density, LTE slab model presented by Nelemans et al. (2004). However, that slab model can at best fit a a limited spectral range, as it is emitted from a particular emission region with an assumed value for temperature and density and will never be able to simultaneously fit the observed spectra from the X-ray to the UV and optical ranges. In good agreement with the observation, our model exhibits lines from three ionisation stages of carbon, indicating that temperature and density in the line-forming regions are reproduced reasonably well. The fact that the strength of many emission lines of a particular ion is either over- or underestimated may stem from drawbacks in the model atoms. One reason could be that the model ions are still too small and ignore the interlocking effects of neglected energy levels. A further extension of the model ions is hampered by the lack of atomic data, mostly oscillator strengths. Another reason for the poor line fits could be errors in the electron collisional rates. Only few are known from experiments or quantum mechanical calculations.
These problems also might affect our neon line-formation calculations. However, the employed Ne model atom has been designed for the analysis of sdO stars and gave successful fits to observed Ne ii lines (Dreizler 1993). Therefore we think that the predicted Ne emission lines in the model are more reliable than the majority of the C and O lines. Atomic data for H and He are accurately known and our model atoms have been employed with success to analyse many classes of stellar spectra, hence, we regard the computed line strengths of H and He as much more reliable than those of the metal lines. Another reason for the poor line fits might be that the assumed -disk does not describe the physics of the emitting region well.
4.2 Limits on abundances of hydrogen, helium, and neon
The upper abundance limits we derive for H and He are regarded as realistic because of the above considerations, but the limit for neon is less secure.
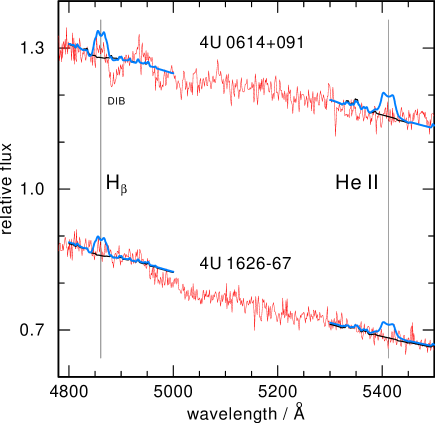
In addition to the pure C/O disk model we also computed a model including 10% hydrogen and a model including 10% helium in order to see if this allows the H and He abundances to be constrained. In Fig. 7 we display the resulting emission lines of Hβ and He ii 5412 Å. From the lack of observed emission lines, it is evident that H and He are at most present at the 10% level. This excludes the possibility that the disks of 4U 1626-67 and 4U 0614+091 are dominated by hydrogen or helium and confirms the suspicion that they are in fact C/O-dominated.
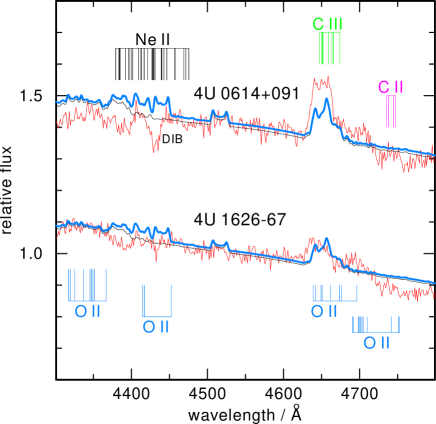
We also computed a C/O model that includes 10% neon. It exhibits weak Ne ii lines, but no such lines are detected in the VLT spectra (Fig. 8). We conclude that the neon abundance cannot be larger than .
5 Summary
We have presented new high-quality optical spectra of the ultracompact low-mass X-ray binaries 4U 0614+091 and 4U 1626-67. They are pure emission line spectra and most probably stem from the accretion disk. The spectral lines are identified as due to C ii-iv and O ii-iii. Line identifications are corroborated by first results from modeling the disk spectra with detailed non-LTE radiation transfer calculations. Hydrogen and helium lines are lacking and our models confirm the deficiency of H and He in the disk. Hence, the donor stars in these systems are in fact the eroded cores of C/O white dwarfs. There are indications that the O/C ratio in 4U 0614+091 is higher than in 4U 1626-67. This could suggest that the stripping process of the WD in 4U 0614+091 is more advanced.
It is hard to estimate the systematic error of the derived upper limit for the neon abundance so that the following conclusions are at the moment rather uncertain. From the lack of Ne ii lines we find that the Ne abundance cannot exceed or, in other words, the Ne/O ratio is at most of the order 0.2. The much higher Ne/O ratios () derived from the ISM X-ray absorption edges of neutral Ne and O (Schulz et al. 2001, Juett et al. 2001) would produce detectable Ne ii lines in the disk spectra. This confirms the conclusion of Juett & Chakrabarty (2005), that the determined ISM abundances of Ne and O are affected by ionisation effects and, hence, do not reflect the abundances of the donor stars.
For an initial solar metallicity the 22Ne abundance in an Ne-enriched crystallized and fractionated WD core can be estimated from theoretical models to , but this value is very uncertain (Yungelson et al. 2002). It could be even higher by a factor of 3 (Isern et al. 1991). Such an Ne-rich core would have a mass of M⊙ (Yungelson et al. 2002). The mass of the WD donor in 4U 1626-67 is much smaller (0.01 M⊙; Yungelson et al. 2002). If we accept an upper limit of Ne=0.1 for the observed neon abundance, then we may draw the following conclusion. Either the WD core has crystallized and fractionated, then our observation favors a relatively small Ne-enrichment as a result of the crystallization process. Or, if one accepts that fractionation would result in a high Ne abundance of 0.2 (unobserved), then the WD core in 4U 1626-67 had no time to crystallize which, depending on various details, lasts several Gyr (e.g. Hernanz et al. 1994).
Future work will concentrate on the disk modeling for the prototype 4U 1626-67, for which the observational database is the best of all such systems. Ultimately, the spectral properties (flux distribution and emission line strengths) over the complete wavelength range comprising spectral observations with Chandra, HST, and VLT, must be explained by a unique disk model.
Acknowledgements.
T.R. is supported by the DLR under grant 50 OR 0201. We thank the referee for constructive criticism that helped to improve the paper.References
- (1) Bildsten, L., Salpeter, E. E., & Wasserman, I. 1992, ApJ, 384, 143
- (2) Cowley, A. P., Hutchings, J. B., & Crampton, D. 1988, ApJ, 333, 906
- (3) Dreizler, S. 1993, A&A, 273, 212
- (4) Hernanz, M., Garcia-Berro, E., Isern, J., Mochkovitch, R., Segretain, L., & Chabrier, G. 1994, ApJ, 434, 652
- (5) Homer, L., Anderson, S. F., Wachter, S., & Margon, B. 2002, AJ, 124, 3348
- (6) In T’Zand, J. J. M., Cumming, A., Van der Sluys, M. V., Verbunt, F. & Pols, O. R. 2005, A&A, 441, 675
- (7) Isern, J., Hernanz, M., Mochkovitch, R., & Garcia-Berro, E. 1991, A&A, 241, L29
- (8) Jonker, P. G., van der Klis, M., & Homan, J. 2001, ApJ, 553, 335
- (9) Juett, A. M., & Chakrabarty, D. 2003, ApJ, 599, 498
- (10) Juett, A. M., & Chakrabarty, D. 2005, ApJ, 627, 926
- (11) Juett, A. M., Psaltis, D., & Chakrabarty, D. 2001, ApJ, 560, L59
- (12) Nagel, T., Dreizler, S., Rauch, T., & Werner, K. 2004, A&A, 428, 109
- (13) Nelemans, G., & Jonker, P. G. 2005, in Interacting Binaries: Accretion, Evolution, and Outcomes, ed. L. Burderi et al., AIP Conf. Proc., 797, 396
- (14) Nelemans, G., Jonker, P. G., Marsh, T. R., & van der Klis, M. 2004, MNRAS, 348, L7
- (15) Ritter, H., & Kolb, U. 2003, A&A, 404, 301 (update RKcat7.4)
- (16) Schulz, N. S., Chakrabarty, D., Marshall, H. L., et al. 2001, ApJ, 563, 941
- (17) Seaton, M. J., Yan, Y., Mihalas, D., & Pradhan, A. K. 1994, MNRAS, 266, 805
- (18) Shakura, N. I., & Sunyaev, R. A. 1973, A&A, 24, 337
- (19) Sidoli, L., Parmar, A. N., & Oosterbroek, T. 2005, The INTEGRAL Universe, Proc. 5th INTEGRAL Workshop, ed. V. Schönfelder, G. Lichti, C. Winkler, ESA SP-552, 389
- (20) Strohmayer, T. E., & Brown, E. F. 2002, ApJ, 566, 1045
- (21) Verbunt, F., & van den Heuvel, E. P. J., 1995, in X-ray Binaries, ed. W. H. G. Lewin, J. van Paradijs, E. P. J. van den Heuvel, (Cambridge: Cambridge University Press), p. 457
- (22) Wang, Z., & Chakrabarty, D. 2004, ApJ, 616, L139
- (23) Werner, K., Nagel, T., Dreizler, S., & Rauch, T. 2004, in IAU Coll. 194: Compact Binaries in the Galaxy and Beyond, ed. G. Tovmassian, E. Sion, RevMexAA Conference Series, 20, 146
- (24) Yungelson, L. R., Nelemans, G., & van den Heuvel, E. P. J. 2002, A&A, 388, 546