The Great Observatories Origins Deep Survey
Abstract
Aims. We present the second campaign of the ESO/GOODS program of spectroscopy of faint galaxies in the GOODS-South field.
Methods. Objects were selected as candidates for VLT/FORS2 observations primarily based on the expectation that the detection and measurement of their spectral features would benefit from the high throughput and spectral resolution of FORS2. The reliability of the redshift estimates is assessed using the redshift-magnitude and color-redshift diagrams and comparing the results with public data.
Results. 807 spectra of 652 individual targets have been obtained in service mode with the FORS2 spectrograph at the ESO/VLT, providing 501 redshift determinations. The typical redshift uncertainty is estimated to be . Galaxies have been selected adopting three different color criteria and using the photometric redshifts. The resulting redshift distribution typically spans two redshift domains: from z=0.5 to 2 and z=3.5 to 6.2. In particular, 94 -,-,-”dropout” Lyman break galaxies have been observed, yielding redshifts for 65 objects in the interval 3.4z6.2. Three sources have been serendipitously discovered in the redshift interval 4.8z5.5. Together with the previous release, 930 sources have now been observed and 724 redshift determinations have been carried out. The reduced spectra and the derived redshifts are released to the community through the ESO web page ††thanks: The catalog (Table LABEL:tab:tblspec) is available in electronic form at the CDS via anonymous ftp to cdsarc.u-strasbg.fr (130.79.128.5) or via http://cdsweb.u-strasbg.fr/cgi-bin/qcat?J/A+A/. Large scale structures are clearly detected at , and . A sample of 34 sources with tilted [O ii]3727 emission has been identified, 32 of them in the redshift range 0.9z1.5.
Key Words.:
Cosmology: observations – Cosmology: deep redshift surveys – Cosmology: large scale structure of the universe – Galaxies: evolution.1 Introduction
The Great Observatories Origins Deep Survey (GOODS) is a public, multi-facility project that aims to answer some of the most profound questions in cosmology: how did galaxies form and assemble their stellar mass? When was the morphological differentiation of galaxies established and how did the Hubble Sequence form? How did Active Galactic Nuclei (AGN) form and evolve, and what role do they play in galaxy evolution? How much do galaxies and AGN contribute to the extragalactic background light? Is the expansion of the universe dominated by a cosmological constant? A project of this scope requires large and coordinated efforts from many facilities, pushed to their limits, to collect a database of sufficient quality and size for the task at hand. It also requires that the data be readily available to the worldwide community for independent analysis, verification, and follow-up.
The program targets two carefully selected fields, the Hubble Deep Field North (HDF-N) and the Chandra Deep Field South (CDF-S), with three NASA Great Observatories (HST, Spitzer and Chandra), ESA’s XMM-Newton, and a wide variety of ground-based facilities. The area common to all the observing programs is 320 arcmin2, equally divided between the North and South fields. For an overview of GOODS, see Dickinson et al. (2003), Renzini et al. (2003) and Giavalisco et al. (2004a). In the last five years the CDF-S has been the target of several spectroscopic campaigns (Cristiani et al. (2000), Croom et al. (2001), Bunker et al. (2003), Stanway et al. (2004), Strolger et al. (2004), van der Wel et al. (2004), Dickinson et al. (2004a), Szokoly et al. (2004), Le Fevre et al. (2005), Vanzella et al. (2005)).
This is the second paper in a series presenting the results of the GOODS spectroscopic program carried out with the VLT/FORS2 spectrograph. For a full description of its aims we refer to the first paper (Vanzella et al. (2005), RUN1 hereafter).
Here we recall that the ESO/GOODS spectroscopic program is designed to observe all galaxies for which VLT optical spectroscopy is likely to allow the redshift determination. The program makes full use of the VLT instrument capabilities (FORS2 and VIMOS), matching targets to instrument and disperser combinations in order to maximize the effectiveness of the observations. The magnitude limits and selection bandpasses to some extent depend on the instrumental setup being used. The aim is to reach mag with adequate S/N, with this limiting magnitude being in the B band for objects observed with the VIMOS LR-Blue grism, in the V band for those observed in the VIMOS LR-Red grism, and in the z band for the objects observed with FORS2.
The second FORS2 spectroscopic campaign (17 masks, RUN2 hereafter) in the Chandra Deep Field South, was carried out in the period fall 2003 - early 2004 in service mode. New FORS2 observations were performed in December 2004 (6 masks, RUN3) mainly focused on color-selected Lyman break “dropout” targets and 5 more masks will be completed before February 2006 (RUN4) mainly dedicated to sources detected at 24m with the Spitzer Space Telescope MIPS instrument. These data will be described in a forthcoming paper. The VIMOS spectroscopic survey in the GOODS-S field is started and will produce hundreds of redshift determinations, mainly in the redshift range 0z3.5.
The paper is organized as follows. Sect. 2 describes the target selection, while Sect. 3 describes the observations and data reductions. The redshift determination is presented in Sect. 4. In Sect. 5 we discuss the data and in Sect. 6 the conclusions are presented. Throughout this paper the magnitudes are given in the AB system (Oke (1977)) (AB ), and the ACS F435W, F606W, F775W, and F850LP filters are designated hereafter as , , and , respectively. We assume a cosmology with and km s-1 Mpc-1.
2 Target Selection

Galaxies were selected as candidates for FORS2 observations primarily based on the expectation that the detection and measurement of their spectral features would benefit from the high throughput, moderately-high spectral resolution, and reduced long-wavelength fringing of FORS2 relative to other instrument options such as VIMOS. In particular, the main spectral emission and absorption features for galaxies at appear at very red optical wavelengths (m). Similarly, very faint Lyman break galaxies at , selected as , and –dropouts from the GOODS ACS photometry, also benefit greatly from the red throughput and higher spectral resolution of FORS2.
In practice, several categories of object selection criteria were used to ensure a sufficiently high density of targets to efficiently populate masks. These criteria were:
-
1.
Primary catalog: and . This should ensure redshifts for ordinary early-type galaxies (whose strongest features are expected to be absorption lines), and higher redshifts for intrinsically bluer galaxies likely to have emission lines.
-
2.
Secondary catalog: and .
-
3.
Photometric-redshift sample: and , from Mobasher et al. (2004).
- 4.
-
5.
A few miscellaneous objects, including host galaxies of supernovae detected in the GOODS ACS observing campaign.
The targets were selected from a preliminary catalog based on the v1.0 public release of the GOODS ACS images. This version includes all five epochs of the GOODS ACS data 111ftp://archive.stsci.edu/pub/hlsp/goods/catalogr1/, and is a significant improvement on the previous, 3-epoch v0.5 release that was used to select targets for the first FORS2 observations (RUN1, Vanzella et al. (2005)). For this paper and data release, the objects observed with FORS2 have been matched to the public release ACS catalog version r1.1z, also based on the 5-epoch v1.0 ACS images. The r1.1z catalog is based on the r1.0z SExtractor run, and merely corrects errors and omissions in the r1.0z catalog files.
When designing the masks, we generally tried to avoid observing targets that had already been observed in other redshift surveys of this field, namely the K20 survey of Cimatti et al. (2002) and the survey of X-ray sources by Szokoly et al. (2004).
807 spectra of 652 individual targets have been extracted from the RUN2 (multiple observations have been performed, especially for the high redshift candidates). Out of these 652 targets, 178 are from the primary catalog, 117 are from the secondary catalog, 141 are from the photometric redshift selection, 94 are from the Lyman break sample, and 3 are from miscellaneous list. The remaining 119 sources have been serendipitously identified, due to: a) sources randomly in the slit other than the target or b) sources put in the slit in the situation where no targets were available or c) relatively bright objects put in the slit for the alignment of the mask.
The total number of individual sources observed in the RUN1 + RUN2 is 930 (1203 spectra reduced) with 724 redshift determinations. The spectroscopic database presented here is incomplete: none of the above listed categories has been exhaustively observed, nor any GOODS subarea has been fully covered.
3 Observations and Data Reduction
| Mask ID | Date | exp.time (s) |
|---|---|---|
| 914250 | Aug. 2003 | 171200 |
| 905513 | Sept. 2003 | 181200 |
| 943018 | Sept. 2003 | 121200 |
| 924345 | Sept. 2003 | 121200 |
| 945143 | Sept. - Oct. 2003 | 121200 + 31000 |
| 992438 | Oct. - Dec. 2003 | 121200 |
| 985931 | Nov. 2003 | 121200 + 2120 |
| 990204 | Dec. 2003 | 121200 |
| 904509 | Dec. 2003 | 121200 |
| 991435 | Dec. 2003 | 121200 |
| 935030 | Dec. 2003 | 121200 |
| 951937 | Dec. 2003 | 121200 + 1100 + 500 |
| 960930 | Dec. 2003 | 121200 |
| 961839 | Jan. 2004 | 121200 |
| 932802 | Jan. 2004 | 121200 |
| 993304 | Jan. 2004 | 121200 |
| 951526 | Feb. 2004 | 31200 |
The VLT/FORS2 spectroscopic observations were carried out in service mode during several nights at the end of 2003 and the beginning of 2004. A summary is presented in Table LABEL:tab:tblobs. In all cases the grism was used as dispersing element without order-separating filter. This grism provides a scale of roughly 3.2Å pix-1. The nominal resolution of the configuration was R==660, which corresponds to 13Å at 8600Å. The spatial scale of FORS2 is /pixel. The slit width was always . Dithering of the targets along the slits was applied typically with steps of 0,8 pixels, in order to effectively improve the sky and fringe subtraction, and remove CCD blemishes.
3.1 Data Reduction
Data were reduced with a semi-automatic pipeline that we have developed on the basis of the MIDAS package (Warmels (1991)), using commands of the LONG and MOS contexts. The main procedures have been described in the previous paper (Vanzella et al. (2005)).
In the cases of multiple observations of the same source in different masks, the one dimensional spectra have been co-added weighing according to the exposure time, the seeing condition and the resulting quality of each extraction process (defects present in the CCD, object too close to the border of the slit, etc.). A visual check of the two dimensional frames has been performed (in some cases the two dimensional spectra have also been co-added, in order to improve and guide the visual inspection).
We emphasize here that we opted to observe the science targets without an order-sorting filter, implying deleterious effects to the flux calibration. The second order overlap becomes important at wavelengths above 8000Å depending on the color of the target. In Figure 1 the comparison between two 1-D calibrated spectra (one blue ()0 and one red ()1) and the correspondent ACS photometry is shown. The photometric values in the and bands are marked with two filled circles and are consistent with the derived spectral behavior. For the red objects that dominate the FORS2 target selection, we felt that the improved wavelength coverage more than compensates for the partial unreliability of the flux calibration. Due to both this second order light and uncertain slit losses, we caution against using the calibrated fluxes for scientific purposes. Fluxes in the released 1-D spectra are given in units of erg s-1 cm-2 Å-1.


4 Redshift Determination
Spectra of 652 individual objects have been extracted from RUN2. From them we have determined 501 redshifts. In the large majority of the cases the redshift has been determined through the identification of prominent features of galaxy spectra: depending on the redshift and the nature of the source the 4000Å break, Ca H and K, g-band, MgII 2798-2802, AlII 3584, Ly, Si ii 1260.4Å, O i 1302.2Å, C ii 1335.1Å, Si iv 1393.8,1402.8Å, Si ii 1526.7Å, C iv 1548.2, 1550.8Å in absorption and Ly, [O ii]3727, [O iii]5007, H, H in emission. The redshift estimation has been performed cross-correlating the observed spectrum with templates of different spectral types (S0, Sa, Sb, Sc, Elliptical, Lyman Break, etc.), using the package in the IRAF environment. The redshift identifications are summarized in Table LABEL:tab:tblspec and are available at the URL .
In Table LABEL:tab:tblspec, the column ID contains the target identifier, that is constructed out of the target position (e.g., 033206.44-274728.8) where GDS stands for GOODS South. The coordinates are based on the GOODS v1.1 astrometry. The v1.1 release is based upon the v1.0 SExtractor run, and merely corrects errors and omissions in the v1.0 catalog files. The cataloged sources are identical, in both number and ordering, to the v1.0 release. The columns and (-) list the magnitude (SExtractor “MAGAUTO”) and the color (SExtractor “MAGISO”) of the sources derived from the catalog v1.1. The color has been measured through isophotal apertures defined in the band image (as done in Dickinson et al. (2004a) and Giavalisco et al. (2004b)).
The quality flag (QF hereafter), indicates the reliability of the redshift determination. As described in the previous work (Vanzella et al. (2005), RUN1), the QF has been divided in three categories: “A”, “B” and “C”. An estimation of the confidence level associated to each class “A”, “B” and “C” can be derived analyzing the FORS2 measurements in common with independent spectroscopic estimations available in literature. This has been done in the previous paper (RUN1) where 39 sources have been analyzed and in Sect. 5.1 of the present work (98 more sources, see below). In this way the sample of FORS2 measurements in common with independent spectroscopic surveys counts 137 galaxies, in which we find 0, 1 and 4 FORS2 wrong redshifts for classes “A”, “B” and “C”, respectively. In this way at 1 (Gehrels (1986)) the confidence level of the “A”, “B” and “C” categories turns out to be 98, 97 and 93.
There are 291 objects classified with quality “A”, 119 with quality “B”, 91 with “C”, and 151 with “X”, an inconclusive spectrum.
The flag ”class” groups the objects for which emission line(s) (“em.”), absorption-line(s) (“abs.”) or both (“comp.”) are detected in the spectrum. In the present catalog, three sources have been classified as stars.
In 30 of the cases the redshift is based only on one emission line, usually identified as [O ii]3727 or Ly. In these cases the continuum shape, the presence of breaks, the absence of other spectral features in the observed spectral range and the broad band photometry are particularly important in the evaluation. The quality for these sources ranges from “A” to “C” depending on the additional information described above (35 of the sample with a single emission line have QF=”A”, with a mean redshift =1.210.2).
The comments column contains additional information relevant to the particular observation. The most common ones summarize the identification of the principal lines, the inclination of an emission line due to internal kinematics, the weakness of the signal (“faint”), the low S/N of the extracted spectrum (“noisy”), the apparent absence of spectroscopic lines (“featureless continuum”), etc.
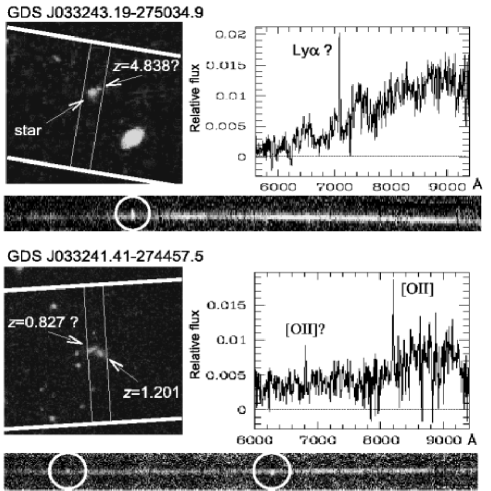
In few cases the spectrum extracted is the combination of more than one source in the slit and where possible the redshifts of the “components” have been estimated. In the RUN1 + RUN2 spectroscopic data, 11 sources in the GOODS-S field are not present in the ACS photometric catalog v1.1. Six of them have a redshift estimation (an example is shown in Figure 2). Three out of six appear to be emission line objects whose continuum is too faint and has not been detected in the ACS catalogs. The other seven sources are outside the ACS area.
| ID(v1.0) | zspec | class. | Quality | comments | ||
| GDS J033245.99-275108.3 | 23.48 | 0.47 | 1.238 | em. | B | [O ii]3727 |
| GDS J033246.04-274929.7 | 26.06 | 1.77 | 5.787 | em. | A | LyA (faint continuum) |
| GDS J033246.05-275444.8 | 21.49 | 0.53 | 0.733 | abs. | A | CaH,g-band,H,Mg,CaFe |
| GDS J033246.16-274752.3 | 24.46 | 0.43 | 1.221 | em. | B | [O ii]3727 |
| This table is available in its entirety via . | ||||||
| A portion is shown here for guidance regarding its form and content. | ||||||
5 Discussion
In the following, if not specified, we consider the entire FORS2 sample, including both RUN1 and RUN2. This sample is summarized in Table LABEL:tab:matrix where the sources are divided into different selection categories (see Sec. 2) and by redshift (or whether a redshift could be determined). The distribution of the quality flags is also tabulated.

5.1 Reliability of the redshift - comparison with public data

A practical way to assess the reliability of the redshifts reported in Table LABEL:tab:tblspec is to compare the present results with independent measurements from other surveys. In the last five years the CDF-S has been the target of several spectroscopic campaigns (the surveys with the number of redshifts in parenthesis used in the comparison are here reported: Cristiani et al. (2000) (5), Croom et al. (2001) (29), Bunker et al. (2003) (1), Stanway et al. (2004) (3), Strolger et al. (2004) (14), van der Wel et al. (2004) (6), Dickinson et al. (2004a) (1), Szokoly et al. (2004) (124), Le Fevre et al. (2005) (748), Vanzella et al. (2005) (234)). Making use of a publicly available master compilation of all spectroscopic redshifts in the GOODS/CDF-S region (Rettura et al. in preparation, available at the URL http://www.eso.org/science/goods/spectroscopy/CDFSMastercat/ we have been able to compare our redshift determinations with the existing data in the literature.
There are 98 objects in common with the present second release of the FORS2 GOODS survey (RUN2). For 87 cases out of 98 (89) the agreement is very good, with a mean difference = 0.0042 0.0095.
15 objects have a redshift determination both in RUN1 and RUN2. The distribution of the redshift differences has a median and a difference between the 82 and 18 percentile of . Assuming equipartition of the redshift uncertainties between RUN1 and RUN2 we derive a typical error on the redshift determinations in the FORS2 GOODS spectroscopy of .
Ten cases show “catastrophic” discrepancies between the RUN2 and the K20, Szokoly et al. (2004) and the VVDS surveys, i.e. greater than 0.08. In order to compare the redshift estimations we recall here which is the quality level adopted by other authors. In the K20 survey the QF adopted is 1, 0 or -1 if the redshift determination is solid, tentative or unconclusive, respectively. In Szokoly et al. (2004) the QF=3 indicates reliable redshift determination with unambiguous X-ray counterpart, QF=2 corresponds to a reliable redshift determination and a value of 0.0 indicates no success. QF=1 indicates the detection of feature in the spectrum (typically a single narrow emission line). QF=0.5 is used when there is a hint of some spectral feature. In the VVDS, the flags 2,3,4 are the most secure with a confidence of 75, 95 and 100 respectively. Flag 1 is an indicative measurement (50), flag 9 indicates that there is only one secure emission line, and flag 0 indicates a measurement failure with no features identified.
In the following we discuss in detail each discrepant spectrum:
-
1.
GDS J033232.08-274155.2. This is a discrepancy with our previous identification (RUN1) and the present one (RUN2). In the first run the redshift determination was tentative (quality “C”, z= 0.960) and in the second run we derived z=1.393 (QF=”B”). However the co-addition of the two produces a featureless continuum, we have changed the quality to “X”.
-
2.
GDS J033217.77-274714.9. K20 and VVDS assign redshift 0.729 and 0.731, respectively (and quality 1 and 3). In the FORS2 spectrum there are three objects in the slit, the GDS J033217.77-274714.9 is a serendipitous source at the border of the slit, its exposure time is reduced of 50 due to the dithering process. The continuum is faint and a possible emission line is detected at 7522.6Å interpreted to be [O ii]3727 at z=1.018 (QF=”C”).
-
3.
GDS J033232.18-274534.9. K20 assigns a redshift 0.332 with quality 1. The FORS2 spectrum shows [O ii]3727, MgI, CaHK, g-band and the Balmer Break at z=0.523 (QF=”A”).
-
4.
GDS J033239.67-274850.6. Szokoly et al. measure redshift 3.064 with quality 3. Our spectrum shows a smoothed break at 6000Å and an absorption line at 6789.0Å, our redshift determination is tentatively z=3.885, QF=”C”. The spectrum starts at 5600Å, if it is at redshift 3.064, the most relevant spectral features are outside the spectral coverage. We note that if the redshift is 3.064 the absorption line we measure at 6789.0Åwould be consistent with the Al ii 1670.8Å.
-
5.
GDS J033240.84-275546.7. Szokoly et al. measure redshift 0.625 with quality 0.5. Our spectrum shows a featureless continuum and starts at 5790Å, a possible emission line is detected at 8277.6Å, we assign tentatively z=1.221 QF=”C”.
-
6.
GDS J033222.44-275606.1. VVDS measure redshift 0.490 with quality 2. The FORS2 spectrum shows a tilted emission line at 7790.3Å and a faint-diffuse continuum. We assign tentatively z=1.090 (QF=”C”). We note that in the FORS2 spectrum the [O ii]3727, [O iii]5007 or H lines at z=0.490 have not been detected.
-
7.
GDS J033225.28-275524.2. VVDS measure redshift 0.923 with quality 1. The FORS2 spectrum shows [O ii]3727 (slightly tilted), CaHK, MgI and the Balmer Break at z=1.017 (QF=”A”).
-
8.
GDS J033230.37-274008.5. VVDS measure redshift 1.083 with quality 2. The source shows a bright continuum and [O ii]3727, MgII and the NeIII lines at z=1.357 (QF=”A”).
-
9.
GDS J033230.50-275312.3. VVDS measure redshift 1.427 with quality 2. The FORS2 spectrum shows [O ii]3727 (tilted), CaHK, MgII, g-band at z=1.017 QF=”A”.
-
10.
GDS J033234.82-274721.9. VVDS measure redshift 0.315 with quality 3. In the FORS2 spectrum an emission line has been detected at 8632.3Å, interpreted as [O ii]3727 at z=1.316 with QF=”B”. The continuum starts at 6260Å, and if we assume the line to be H at z=0.315 the H and/or [O iii]5007 are not present.
-
11.
GDS J033242.97-274649.9. VVDS measure redshift 0.831 with quality 1. The FORS2 spectrum shows [O ii]3727, CaHK, NeIII and (in absorption) at z=1.036 with QF=”A”.
In summary, 7 out of 10 discrepant redshift determinations turn out to be probably correct in the FORS2 spectroscopy, all with QF better or equal to QF=“B”. Of the remaining 3 sources (all with QF=”C”), one is uncertain and two are probably wrong in the FORS2 spectroscopic identification due to the reasons described above.
5.2 Reliability of the redshifts - diagnostic diagrams
Figures 3 and 4 show the redshift-magnitude and the color-redshift distributions, respectively. Figure 4 shows the behavior for galaxies at redshift less than 2 and quality flag “A” and “B”. The two populations of “emission-line” (star-forming) and “absorption-line” (typically elliptical) galaxies are clearly separated. The mean color of the absorption-line objects outline the upper envelop of the distribution,
consistent but increasingly bluer than the colors of a non-evolving elliptical galaxy (estimated integrating the spectral templates of Coleman, Wu & Weedman (1980) through the ACS bandpasses).
The emission-line objects show in general a bluer color and a broader distribution than the absorption-line sources. The broader distribution, with some of the emission-line objects entering the color region of the ellipticals, is possibly explained by dust obscuration, high metallicity or strong line emission in the band (for example emission lines [O iii]5007, H at redshift 0.8, as measured for the source GDS J033219.53-274111.6).
| z-bin | cat. 1)(A,B,C) | cat. 2)(A,B,C) | cat. 3)(A,B,C) | cat. 4)(A,B,C) | cat. 5)(A,B,C) | seren. | Sum |
|---|---|---|---|---|---|---|---|
| no redshift | 57 | 20 | 43 | 37 | 0 | 49 | 206 |
| stars | 4(0,3,1) | 0(0,0,0) | 0(0,0,0) | 7(1,2,4) | 0(0,0,0) | 3(2,0,1) | 14 |
| (0..1) | 19(12,1,6) | 42(35,6,1) | 23(18,3,2) | 2(2,0,1) | 1(1,0,0) | 121(83,19,18) | 208 |
| [1..2) | 193(113,51,29) | 83(49,24,10) | 115(76,25,13) | 4(2,2,0) | 2(2,0,0) | 34(10,15,9) | 431 |
| [2..3) | 0(0,0,0) | 1(1,0,0) | 0(0,0,0) | 0(0,0,0) | 0(0,0,0) | 0(0,0,0) | 1 |
| [3..4) | 0(0,0,0) | 0(0,0,0) | 0(0,0,0) | 26(14,7,4) | 0(0,0,0) | 0(0,0,0) | 26 |
| [4..5) | 0(0,0,0) | 0(0,0,0) | 0(0,0,0) | 23(6,8,9) | 0(0,0,0) | 2(0,1,1) | 25 |
| [5..6) | 0(0,0,0) | 0(0,0,0) | 0(0,0,0) | 14(7,3,5) | 0(0,0,0) | 3(0,1,2) | 17 |
| [6..7) | 0(0,0,0) | 0(0,0,0) | 0(0,0,0) | 2(0,1,1) | 0(0,0,0) | 0(0,0,0) | 2 |
| Sum | 273 | 146 | 181 | 115 | 3 | 212 |
5.3 Redshift distribution and Large Scale Structure
The top and bottom panels of Figure 5 show the redshift distribution of the galaxies at redshift less than 2 and greater than 2, respectively (solid line QF “A” and ”B”, dotted line QF “C”). In the following sections we discuss the redshift distribution separating the low () and high () redshift intervals.
5.3.1 The sample at
The redshift distribution is consistent with the criteria for the target selection (color and photometric redshift selected), with the majority of the sources having redshifts in the interval 1z2 (see also Table LABEL:tab:matrix, last column). In the RUN1+RUN2, out of 181 galaxies selected via photometric redshift, 138 have a spectroscopic redshift identification and 136 with zspec0.8 (115 at zspec1).
Table LABEL:tab:z_properties shows the fraction of determined redshifts as a function of the spectral features identified, i.e. emission lines, absorption lines, emission & absorption lines. The median of the redshift distribution of each class is close to 1, with a more populated tail in the redshift interval 12 (see top panel of Figure 5).

Obviously, in the presence of emission lines, it is easier to determine a redshift. As reported in Table LABEL:tab:z_properties, 537 galaxies (including “em.” and “comp”) show the [O ii]3727 emission line and assuming as an extreme case that all the inconclusive redshift determinations (category “X”) belong to the class “abs.”, the number of “em.” sources is still dominant, comprising 63 of the entire target list. This is a likely reason why the majority of galaxies identified in the present work belong to the “em.” class. Alternatively, [O ii]3727 is a classic star forming indicator and the redshift interval corresponds to the peak of the mean star formation intensity of the universe.
There are 102 galaxies identified with absorption lines only (“abs.” class, mainly Ca H and K, MgII 2798-2802) in the range of redshift between 0.3-2.0. 28 sources out of 102 with only absorption features detected have been serendipitously-observed, the redshift distribution of this sample peaks at z=0.680.2. Six galaxies have been identified at redshift 2. These sources show the Mg ii 2798,2802Å in absorption (in three cases the [Fe ii] 2344,2383Å absorption lines are also present), five of them (GDS J033241.84-274657.1 QF=”B”, GDS J033240.06-274755.4 QF=”A”, GDS J033228.17-274648.4 QF=”C”, GDS J033240.27-274949.7 QF=”C” and GDS J033233.84-274520.5 QF=”C”) have been discovered in the RUN2 and have blue colors (). Two examples of 2D spectra are shown in Figure 6 and the composite one-dimensional spectrum is shown in the right panel of Figure 9. For these sources the [O ii]3727 emission, if present, is out of the spectral range, at 11180Å. The source GDS J033233.85-274600.2 is an elliptical galaxy at =1.91 already discussed by Cimatti et al. (2004), and has been observed in the RUN1.
| Spectral class | cat.1) | cat.2) | cat.3) | cat.4) | cat.5) | cat.-1) (seren.) | Sum | |||
|---|---|---|---|---|---|---|---|---|---|---|
| emission | (1.13) | 0.067 | 1.621 | 117 | 92 | 123 | 3 | 2 | 104 | 441 |
| absorption | (1.00) | 0.337 | 1.998 | 51 | 15 | 5 | 2 | 1 | 28 | 102 |
| em. & abs. | (1.02) | 0.382 | 1.380 | 44 | 18 | 10 | 2 | 0 | 22 | 96 |
| Sum | 212 | 125 | 138 | 7 | 3 | 154 |
441 sources belong to the “em.” class (they are dominated by emission lines, mainly [O ii]3727), many of them entering the so-called “spectroscopic desert” up to z=1.621. It is interesting to note that 133 galaxies out of 138 with redshift and photo-z selected show the [O ii]3727 emission line.
96 sources have been classified as intermediate between “em.” and “abs.” classes, where both emission and absorption lines with an evident 4000Å break are present.
5.3.2 Large Scale Structure
The presence in the CDF-S of large scale structure (LSS) at is indicated by the peaks in the redshift distribution (see Figure 7). To assess the significance of these structures we follow a procedure similar to that adopted by Gilli et al. (2003), who observed features in their X-ray source redshift distribution.
We have distributed the sources (the “signal distribution”) in the velocity domain (, so that ) and smoothed with a Gaussian filter with (the typical error in the redshift determination). We have then smoothed the observed distribution with a Gaussian filter with and considered this as the background distribution.
We have searched for possible redshift peaks in the signal distribution, computing a signal-to-noise ratio defined as = (), where is the number of sources in a velocity interval of fixed width and is the number of background sources in the same interval. Adopting the threshold 5 we have found 6 peaks in the signal distribution (indicated with an arrows in the Figure 7).
In order to estimate the expected fraction of possibly “spurious” peaks arising from the background fluctuations, we have simulated 105 samples of the same size of the observed distribution and randomly extracted from the smoothed background distribution and applied our peak detection method to each simulated sample. The result is that, with the adopted threshold, the average number of spurious peaks due to background fluctuations is 0.06. Of the simulated samples, 5.7 show one spurious peak, 0.1 show two spurious peaks, and only one simulation (out of ) has three spurious peaks. None of the simulated samples have four or more spurious peaks.
| z | N | SNR | Prob. |
|---|---|---|---|
| 0.666 | 22 | 8.6 | 4.510-4 |
| 0.734 | 40 | 16.6 | 110-5 |
| 1.096 | 42 | 8.0 | 1.910-3 |
| 1.221 | 47 | 9.7 | 2.210-4 |
| 1.300 | 35 | 7.4 | 4.210-3 |
| 1.614 | 20 | 11.1 | 7.010-5 |
The six source peaks detected by our procedure are listed in Table LABEL:tab:LSS, where for each peak we give the average redshift, the number of objects (N) in the peak and the probability (derived from the 105 simulations) of observing a spurious peak with the SNR equal or greater than the measured SNR of the peak detected in the signal distribution.


The peaks at and are already known (Cimatti et al. (2002), Gilli et al. (2003), Le Fevre et al. (2004)). The other four indications of large scale structures in the CDF-S have been identified at redshift 1.096, 1.221, 1.300 (also described by Adami et al. (2005)) and 1.614. We note that other two peaks have been detected with a 4.5 at redshift 1.040 and 1.382.
In the current spectroscopic catalog (RUN1 + RUN2) 20 galaxies at have been discovered (Figure 8 shows an example of the z1.61 galaxies discovered in the RUN2). The number of sources increase if we consider other surveys:
-
1.
the observations of Gilli et al. (2003) who found a peak in the redshift distribution of X-ray sources at z=1.618 (5 galaxies);
- 2.
-
3.
at least 5 more galaxies in the third FORS2 run (from our preliminary reduction);

.
Fig. 10 shows the spatial distribution of the galaxies at using both the present work and data from the literature. The current sample contains 28 galaxies apparently distributed in a non-uniform way, the majority of them have been detected in the upper part of the field and 3 pairs have an angular separation below 4 arcseconds ( 30 kpc at ).
At redshift 1.61, the ACS band is sampling the 1667Å rest-frame UV radiation. As reviewed by Kennicutt (1998), one can estimate the SFR from the rest-frame UV luminosity density in the range 1500-2500 Å using the following relation: SFR(M⊙yr-1) = 1.4 10-28 (ergs s-1 Hz-1) for a Salpeter IMF, covering the range 0.1 to 100M⊙. This relation applies only to galaxies with continuous star formation over time scales of 108 years or longer.
We have estimated the rest-frame luminosity density (in ergs s-1 Hz-1) of the 20 galaxies at z=1.61 identified in the current FORS2 spectroscopic campaign, using the apparent AB magnitude (the SExtractor “magauto”, Bertin & Arnouts (1996)) and the luminosity distance. The final luminosity is = 10, where represents the amount of dust extinction. Adopting no extinction (=0), we obtain a lower limit for the mean star formation rate of SFR42 M⊙yr-1. Assuming =1 or =2 the SFR increase from 105 M⊙yr-1 to 2414 M⊙yr-1, respectively.
The rest frame composite spectrum of twenty galaxies at z=1.61 is shown in the left panel of Figure 9. The [O ii]3727 line and the Mg ii 2798,2802Å and [Fe ii] 2344,2383Å are clearly evident.
5.4 The Lyman break galaxies
116 sources in the FORS2 RUN1 and RUN2 belong to the class 4), i.e., objects selected to be at high redshift by Lyman break color criteria. It is important to divide the first and second run in order to characterize the success rate. As already discussed in the previous paper (Vanzella et al. (2005)), in the first FORS2 run 14 candidate dropouts were observed, and only one was confirmed at z=5.83. Another five were found to be stars and the remaining sources had inconclusive spectra. The photometric selection of the dropouts galaxies in the first FORS2 run was based on an incomplete photometric dataset (first three epochs photometry).
In the following, we consider only the results from RUN2, for which dropout candidates were selected from the full (five epochs) ACS photometry.
94 Lyman break galaxy candidates selected by the , and -dropout criteria were observed in RUN2. The redshift distribution measured for 65 of these galaxies is shown in the lower panel of Figure 5. The 75, 70 and 70 of the observed , and -dropout color selected candidates have a redshift estimation. The sources with inconclusive redshift determination are in general too faint or without evident spectral features.
100 of the -dropouts with a measured redshift have been confirmed to be at redshift between 3.4 and 4.6, 90 of the -dropouts with a measured redshift are in the range 4.4 and 5.6, and 93 of the -dropouts with a measured redshift are at redshift greater than 5.2 (one source is a probable star).
| classes (Nobs.) | confirmed high-z (*) | confirmed low-z | no redshift | (*) “em.”(A,B,C) | (*) “abs.”(A,B,C) | (*) “em.”+”abs.”(A,B,C) |
|---|---|---|---|---|---|---|
| -drop (44) | 33 (3.418z4.597) | 0 | 11 | 12(8,3,1) | 20(9,5,6) | 1(1,0,0) |
| -drop (30) | 19 (4.400z5.554) | 2 (z1.4) | 9 | 13(5,5,3) | 6(0,2,4) | 0(0,0,0) |
| -drop (20) | 13 (5.250z6.200) | 1 (star) | 6 | 8(3,4,1) | 5(0,0,5) | 0(0,0,0) |
| Serend. | 3 (4.838z5.541) | - | - | 3(0,0,3) | 0(0,0,0) | 0(0,0,0) |
Table LABEL:tab:high-z (and Table LABEL:tab:matrix) summarize the success rate as a function of redshift, quality flag, class and selection criteria. Columns 5, 6 and 7 of Table LABEL:tab:high-z show the fraction of the confirmed high redshift galaxies and the “class” flag that is related to the features detected in the redshift determination. Beyond redshift 5, if no spectral lines are present, the main features indicating the high redshift nature of the source are: the break in the continuum due to galactic and intergalactic absorption blueward 1215.8Å, and the flatness of the continuum redward the 1215.8Å.

Figure 11 shows the two-Dimensional collection of the 18 galaxies at redshift greater than 5 discovered in the RUN2 and Figure 12 shows the one-dimensional spectrum of the galaxy GDS J033223.84-275511.6 at z=6.097.
In the top of the figure the spectrum of the sky (not flux calibrated) is shown together with the response curves of the ACS filters and the . In some cases the Ly is in emission (marked with a circle) and the break of the continuum is evident. Five sources show only the continuum break (a solid segment marks the possible position of the break). The mean value of the observed for this sample increases with increasing redshift. The presence of the Lyman emission line, however, can affect significantly the resulting color of the galaxy, introducing a scatter in the blue or in the red directions. For example in the case of the source GDS J033218.92-275302.7, the strong Ly line at z=5.554 produces an = 0.625. Similarly, in the case of the source GDS J033223.84-275511.6, the intense Ly line falls in the band, producing an 4.
The source GDS J033217.96-274817.0 is an -dropout candidate. The FORS2 spectrum is the superposition of two sources. In Figure 13 the one and two dimensional spectra and the color ACS image of the sources are shown. One source (GDS J033217.95-274817.5) is clearly blue (=-0.25) with respect the -dropout candidate (=1.18). The one dimensional spectrum shows a break at 7800Å and the flatness shape redward the break. Collapsing 100 columns below and beyond the 7800Å break, the two resulting profiles are shifted of 0.4 arcsecond, consistently with the separation of the two sources measured in the ACS image. Interpreting this break due to the high redshift nature of the -dropout source, the redshift is 5.4 with QF=”C”. We note that the uncertainty of the position of the break is increased by the presence of the sky absorption A-band at 7600Å.


5.5 Galaxies showing a tilted [O ii]3727 line
The current FORS2 spectroscopic catalog contains a sample of sources showing a spatially resolved [O ii]3727 line with a characteristic “tilt” indicative of a high rotation velocity. Table LABEL:tab:OII_TILT lists the 34 sources sorted by increasing redshift, the majority of them belong to the interval 1z1.5. Figure 15 show an example of the two dimensional spectra of the galaxies and the sky lines. The [O ii]3727 line is marked with a circle.
As discussed in the previous paper (Vanzella et al. (2005)) the resolution of the FORS2 spectra favor the detection of high velocity rotational systems. Moreover a not optimized orientation of the slit suggest that in general the “true” maximum velocities may be significantly higher than the measure value.


As an example, we have analyzed the velocity field of object J033227.73-275451.8 and estimate the stellar mass from the multi-wavelength dataset.
We first traced the centroid of the [O ii]3726,3729 emission line doublet along the spatial position. Since the resolution of our spectrum is too low to resolve the doublet, we fixed the ratio between the two components to 1 and we checked that the results were fairly insensitive to this assumption. We then compared this measured rotation curve with a set of synthetic rotation curves for which the velocity rises linearly up to one disk scale length and is flat at larger radii. This step takes into account the inclination of the disk with respect to the line of sight (), the disk scale length () (derived from the morphological analysis, Rettura et al., in preparation), the slit misalignment with respect to the galaxy major axis (), the width of the slit (1”) and the seeing () (this method is similar to that of Böhm at al. (2004)). The best fit rotation curve gives a rotation velocity of km. Using prescription from van den Bosch et al. (2002), this implies a total halo mass of .
Dedicated spectroscopic observations specifically designed for the dynamical mass estimation (higher spectral resolution, optimized slit orientation, etc.), should be performed/preferred in order to decrease the uncertainties.
We have used the full optical (HST/ACS B,V,i,z), near infrared (VLT/ISAAC J,Ks) to mid-infrared (Spitzer/IRAC ) data to study the Spectral Energy Distribution (SED) of the same galaxy. We have adopted radius aperture-corrected to radius photometry to account for different instrumental PSFs. We have compared the observed SED with a set of template computed with PÉGASE.2 models (Fioc & Rocca-Volmerange, (1997)) via minimization technique (the Salpeter IMF has been assumed). A more detailed description of the multi-wavelength cataloging and the fitting SED technique used here will be presented in Rettura et al. (in preparation) on a larger sample. We have calculated the errors for the mass estimate by sampling the full probability distribution in the parameters-space. Results of the SED fit are shown in Figure 14 right panel. We find a best-fit stellar mass of with a 1 confidence interval between 1.7-3.7. The comparison between this estimation and the dynamical halo mass produces a stellar mass over halo mass ratio of . This result is consistent with the estimations performed by Conselice et al. (2005) on a large sample of disk galaxies at 1.1, where they find a wide range of values (0.004 2).
| GDS ID | zspec | class | quality |
| GDS J033254.87-275456.0 | 0.125 | em. | C |
| GDS J033237.54-274838.9 | 0.665 | em. | A |
| GDS J033215.88-274723.1 | 0.896 | em. | A |
| GDS J033227.66-275437.4 | 0.963 | em. | A |
| GDS J033227.73-275451.8 | 0.966 | comp. | A |
| GDS J033249.73-275517.4 | 0.981 | em. | A |
| GDS J033234.56-275543.6 | 0.983 | em. | A |
| GDS J033222.44-275606.1 | 1.090 | em. | C |
| GDS J033226.03-274856.0 | 1.016 | em. | A |
| GDS J033230.50-275312.3 | 1.017 | comp. | A |
| GDS J033225.28-275524.2 | 1.017 | comp. | A |
| GDS J033235.72-275615.4 | 1.033 | em. | A |
| GDS J033233.71-274210.2 | 1.043 | em. | B |
| GDS J033234.42-275405.7 | 1.088 | comp. | A |
| GDS J033225.86-275019.7 | 1.095 | em. | A |
| GDS J033246.71-274556.0 | 1.095 | em. | B |
| GDS J033247.42-274711.1 | 1.098 | em. | A |
| GDS J033215.23-274437.8 | 1.109 | em. | B |
| GDS J033223.18-274921.5 | 1.110 | em. | B |
| GDS J033216.28-274447.6 | 1.183 | em. | C |
| GDS J033216.26-274703.3 | 1.219 | em. | A |
| GDS J033238.01-275408.2 | 1.243 | em. | B |
| GDS J033224.94-275020.2 | 1.294 | em. | B |
| GDS J033205.67-274253.5 | 1.296 | em. | A |
| GDS J033232.42-274150.1 | 1.296 | em. | B |
| GDS J033232.47-274151.5 | 1.296 | em. | B |
| GDS J033213.21-274158.0 | 1.297 | em. | B |
| GDS J033240.94-274427.5 | 1.298 | comp. | A |
| GDS J033244.35-275506.4 | 1.305 | em. | A |
| GDS J033230.71-274617.2 | 1.307 | em. | A |
| GDS J033234.82-274721.9 | 1.316 | em. | B |
| GDS J033239.66-275406.3 | 1.343 | em. | A |
| GDS J033240.08-275532.6 | 1.461 | em. | A |
| GDS J033229.06-275542.8 | 1.469 | em. | A |
| possible tilted line. | |||

6 Conclusions
As a part of the Great Observatories Origins Deep Survey, a large sample of galaxies in the Chandra Deep Field South has been spectroscopically targeted. After the RUN1 (Vanzella et al. (2005)) and RUN2 (present work) a total of 930 objects with have been observed with the FORS2 spectrograph at the ESO VLT providing 724 redshift determinations. From a variety of diagnostics the measurement of the redshifts appears to be precise (with a typical ) and reliable. The reduced spectra and the derived redshifts are released to the community (). They constitute an essential contribution to reach the scientific goals of GOODS, providing the time coordinate needed to delineate the evolution of galaxy masses, morphologies, and star formation, calibrating the photometric redshifts that can be derived from the imaging data at 0.36-8m and enabling detailed studies of the physical diagnostics for galaxies in the GOODS field.
Acknowledgements.
We are grateful to the ESO staff in Paranal and Garching who greatly helped in the development of this programme. The work of DS was carried out at the Jet Propulsion Laboratory, California Institute of Technology, under a contract with NASA. We thank the ASI grant I/R/088/02 (SC, MN, EV).References
- Adami et al. (2005) Adami, C., Mazure, A., Ilbert, O., Cappi, A., and the VIMOS VLT Deep Survey team, 2005, A&A, 443, 805
- Bertin & Arnouts (1996) Bertin, E., & Arnouts, S., 1996, A&AS, 117, 393
- van den Bosch et al. (2002) van den Bosch, F., Yang, X., Mo, H/J., 2003, Mon.Not.Roy.Astron.Soc. 340, 771
- Böhm at al. (2004) Böhm, A., Ziegler, B. L., Saglia, R. P., et al., 2004, A&A, 420, 97
- Bunker et al. (2003) Bunker, A.J., Stanway, E.R., Ellis, R.S., McMahon, R.G., 2003, MNRAS, 324, 47
- Cimatti et al. (2002) Cimatti, A., Mignoli, M., Daddi, E., et al. 2002, A&A, 392, 395
- Cimatti et al. (2004) Cimatti, A., Daddi, E., Renzini, A., Cassata, P., Vanzella, E., Pozzetti, L., Cristiani, S. et al., 2004, Nature, 430, 184
- Coleman, Wu & Weedman (1980) Coleman, G., D., Wu, C.-C., & Weedman, D., W., 1980, ApJS, 43, 393
- Conselice et al. (2005) Conselice, C.J., Bundy, K., Ellis, R.S., 2005, ApJ, 628, 160
- Cristiani et al. (2000) Cristiani, S., Appenzeller, I., Arnouts, S. et al., 2000, A&A, 359, 489
- Croom et al. (2001) Croom, Scott M., Warren, S.J., Glazebrook, K., 2001, MNRAS, 328, 150
- Dickinson et al. (2003) Dickinson et al. 2003, in the proceedings of the ESO/USM Workshop ”The Mass of Galaxies at Low and High Redshift” (Venice, Italy, October 2001), eds. R. Bender and A. Renzini, astro-ph/0204213
- Dickinson et al. (2004a) Dickinson, M., Stern, D., Giavalisco, M., Ferguson, H. C., Tsvetanov, Z., et al., 2004, ApJ, 600, 99
- Fioc & Rocca-Volmerange, (1997) Fioc, M., Rocca-Volmerange, B., 1997, A&A, 326, 950
- Gehrels (1986) Gehrels, N., 1986, ApJ, 303, 336, ”Confidence Limits for Small Numbers of Events in Astrophysical Data”
- Giavalisco et al. (2004a) Giavalisco, M., Ferguson, H. C., Koekemoer, A. M., Dickinson, M., Alexander, D. M., Bauer, F. E., Bergeron, J., et al. 2004, ApJ, 600, L93
- Giavalisco et al. (2004b) Giavalisco, M., Dickinson, M., Ferguson, H. C., Ravindranath, S., Kretchmer, C., Moustakas, L. A., Madau, P., Fall, S. M., Gardner, Jonathan P., Livio, M., Papovich, C., Renzini, A., Spinrad, H., Stern, D., Riess, A., 2004, ApJ, 600, 103
- Gilli et al. (2003) Gilli, R., Cimatti, A., Daddi, E., Hasinger, G., Rosati, P., Szokoly, G., Tozzi, P., Bergeron, J., Borgani, S., Giacconi, R., Kewley, L., Mainieri, V., Mignoli, M., Nonino, M., Norman, C., Wang, J., Zamorani, G., Zheng, W., Zirm, A., 2003, ApJ, 592, 721
- Kennicutt (1998) Kennicutt, R. C. 1998, ARA&A, 36, 189
- Le Fevre et al. (2005) Le Fevre, O., Vettolani, G., Garilli, B., Tresse, L., and the VIMOS VLT Deep Survey team, 2005, A&A, 439, 845
- Le Fevre et al. (2004) Le F vre, O.; Vettolani, G.; Paltani, S.; Tresse, L.; Zamorani, G., and the VIMOS VLT Deep Survey team, 2004 A&A, 428, 1043
- Mobasher et al. (2004) Mobasher, B., Idzi, R., Ben tez, N., Cimatti, A., Cristiani, S., Daddi, E., Dahlen, T., Dickinson, M., et al., 2004, ApJ, 600, 167
- Oke (1977) Oke, J.B., 1977, ApJS, 27, 21
- Renzini et al. (2003) Renzini et al. 2002, in the proceedings of the ESO/USM Workshop ”The Mass of Galaxies at Low and High Redshift” (Venice, Italy, October 2001), eds. R. Bender and A. Renzini
- Stanway et al. (2004) Stanway, E. R., Bunker, A. J., McMahon, R. G., Ellis, R. S., Treu, T., McCarthy, P. J., 2004, ApJ, 607, 704
- Strolger et al. (2004) Strolger, L.,G., Riess, A.,G., Dahlen, T., et al., 2004, ApJ, 613, 200
- Szokoly et al. (2004) Szokoly, G., P., Bergeron, J., Hasinger, G., Lehmann, I., Kewley, L., Mainieri, V., Nonino, M., Rosati, P., Giacconi, R., Gilli, R., Gilmozzi, R., Norman, C., Romaniello, M., Schreier, E., Tozzi, P., Wang, J., X., Zheng, W., Zirm, A., 2004, ApJS, 155, 271
- Vanzella et al. (2005) Vanzella, E., Cristiani, S., Dickinson, M., et al., 2005, A&A, 434, 53
- Warmels (1991) Warmels, R.H.: 1991, “The ESO-MIDAS System”, in Astronomical Data Analysis Software and Systems I , PASP Conf. Series, Vol. 25, p. 115.
- van der Wel et al. (2004) van der Wel, A., Franx, M., van Dokkum, P.G., Rix, H.-W., 2004, ApJ, 601, 5