Pulsar rotation measures and the large-scale structure of
Galactic magnetic field
Abstract
The large-scale magnetic field of our Galaxy can be probed in three dimensions using Faraday rotation of pulsar signals. We report on the determination of 223 rotation measures from polarization observations of relatively distant southern pulsars made using the Parkes radio telescope. Combined with previously published observations these data give clear evidence for large-scale counterclockwise fields (viewed from the north Galactic pole) in the spiral arms interior to the Sun and weaker evidence for a counterclockwise field in the Perseus arm. However, in interarm regions, including the Solar neighbourhood, we present evidence that suggests that large-scale fields are clockwise. We propose that the large-scale Galactic magnetic field has a bisymmetric structure with reversals on the boundaries of the spiral arms. Streaming motions associated with spiral density waves can directly generate such a structure from an initial inwardly directed radial field. Large-scale fields increase toward the Galactic Center, with a mean value of about 2 G in the Solar neighbourhood and 4 G at a Galactocentric radius of 3 kpc.
1 Introduction
A diffuse magnetic field exists on all scales in our Galaxy. This field can be detected through observations of Zeeman splitting of spectral lines, of polarized thermal emission from dust at mm, sub-mm or infrared wavelengths, of optical starlight polarization due to anisotropic scattering by magnetically-aligned dust grains, of radio synchrotron emission, and of Faraday rotation of polarized radio sources (see Han & Wielebinski, 2002, for a review). The first two approaches have been used to detect respectively the line-of-sight strength and the transverse orientation of magnetic fields in molecular clouds (e.g. Crutcher, 1999; Novak et al., 2003; Fish et al., 2003). Starlight polarization can be used to delineate the orientation of the transverse magnetic field in the interstellar medium within 2 or 3 kpc of the Sun. Careful analysis of such data show that the local field is mainly parallel to the Galactic plane and follows local spiral arms (e.g. Heiles, 1996). Since we live near the edge of the Galactic disk, we cannot have a face-on view of the global magnetic field structure in our Galaxy through polarized synchrotron emission, as is possible for nearby spiral galaxies (e.g. Beck et al., 1996). Polarization observations of synchrotron continuum radiation from the Galactic disk (e.g. Reich et al., 2002) give the transverse direction of the field in the emission region and some indication of its strength. Large-angular-scale features are seen emerging from the Galactic disk, for example, the North Polar Spur (e.g. Junkes et al., 1987; Duncan et al., 1997, 1999; Reich et al., 2002), and the vertical filaments near the Galactic center (Haynes et al., 1992; Duncan et al., 1998). There are also many small-angular-scale structures resulting from diffuse polarized emission at different distances which are modified by foreground Faraday screens (Gaensler et al., 2001; Uyanıker & Landecker, 2002; Haverkorn et al., 2003).
Faraday rotation of linearly polarized radiation from pulsars and extragalactic radio sources is a powerful probe of the diffuse magnetic field in the Galaxy (e.g., Simard-Normandin & Kronberg, 1980; Sofue & Fujimoto, 1983; Lyne & Smith, 1989; Rand & Kulkarni, 1989; Han & Qiao, 1994; Han et al., 1997; Indrani & Deshpande, 1998; Frick et al., 2001). Faraday rotation gives a measure of the line-of-sight component of the magnetic field. Extragalactic sources have the advantage of large numbers but pulsars have the advantage of being spread through the Galaxy at approximately known distances, allowing direct three-dimensional mapping of the field. Pulsars also give a direct estimate of the strength of the field through normalisation by the dispersion measure (DM). The rotation measure (RM) is defined by
| (1) |
where is the position angle in radians of linearly polarised radiation relative to its infinite-frequency () value and is its wavelength (in m). For a pulsar at distance (in pc), the RM (in rad m-2) is given by
| (2) |
where is the electron density in cm-3, is the vector magnetic field in G and is an elemental vector along the line of sight toward us (positive RMs correspond to fields directed toward us) in pc. With
| (3) |
we obtain a direct estimate of the field strength weighted by the local free electron density
| (4) |
where RM and DM are in their usual units of rad m-2 and cm-3 pc and is in G.
Manchester (1972, 1974) was first to systematically measure a number of pulsar RMs and to use them to investigate the large-scale Galactic magnetic field. He concluded that the local uniform field is directed toward Galactic longitude . Thomson & Nelson (1980) modeled the magnetic field configuration to fit the 48 pulsar RMs available that time, and they confirmed the local field direction and also found evidence for a field reversal near the Carina–Sagittarius arm. After the large pulsar RM dataset was published by Hamilton & Lyne (1987), Lyne & Smith (1989) used 185 pulsar RMs to study the Galactic magnetic field and confirmed the field reversal found by Thomson & Nelson (1980). Rand & Lyne (1994) observed 27 RMs of distant pulsars in the first Galactic quadrant and provided evidence for a clockwise field (viewed from the north Galactic pole) near the Crux–Scutum arm. These field directions were recently re-examined by Weisberg et al. (2004) using revised pulsar distances from the NE2001 electron density model (Cordes & Lazio, 2002) together with their 17 new RMs, finding evidence for several field reversals both exterior and interior to the Solar circle. Han et al. (1999) observed 54 RMs and tentatively identified a counterclockwise field near the Norma arm, which was later confirmed by Han et al. (2002) using the RM data discussed in this paper. More recently, Vallée (2005) has reanalysed the available pulsar RM data and interpreted it in terms of an overall clockwise field with a counterclockwise ring of width kpc and radius kpc centered on the Galactic Center.
Pulsar RMs have also been used to study the small-scale random magnetic fields in the Galaxy. Some pairs of pulsars, which are close in sky position and have similar DMs, have very different RMs, indicating an irregular field structure on scales about 100 pc (Lyne & Smith, 1989). Some of these irregularities may result from HII regions in the line of sight to the pulsar (Mitra et al., 2003). Rand & Kulkarni (1989) fitted the single-cell-size model for the residuals of pulsar RMs after the RM contribution of the proposed large-scale ring-field structure was subtracted and obtained a strength for the random field G. Ohno & Shibata (1993) analyzed the difference of RMs and DMs of pulsar pairs and concluded that G independent of cell-size in the range of 10 – 100 pc. In fact the random fields exist on all scales. Han et al. (2004) have found the power-law distribution for magnetic field fluctuations as at scales from 0.5 kpc to 15 kpc,with , corresponding to an rms field of G in the scale range. The interstellar magnetic field is stronger at smaller scales and may be strongest at the scales of energy injection by supernova explosions and stellar winds (1 – 10 pc).
The Parkes multibeam survey has discovered a large number of low-latitude and relatively distant pulsars (Manchester et al., 2001; Morris et al., 2002; Kramer et al., 2003; Hobbs et al., 2004), providing a unique opportunity to probe the diffuse magnetic field in a substantial fraction of the Galactic disk with much improved spatial resolution. In addition, improved estimates of pulsar distances are available from the NE2001 electron density model (Cordes & Lazio, 2002). In this paper, we adopt a distance of the Sun from the Galactic center of kpc.
We have used the Parkes 64-m telescope of the Australia Telescope National Facility to observe the polarization properties of 270 pulsars, most of which were discovered in the Parkes Multibeam Pulsar Survey. After processing, we obtained 223 pulsar RMs which we present in §2. All available pulsar RM data have been used to reveal magnetic field directions along the spiral arms and in interarm regions, as presented in §3. The field strength and its Galactocentric radial dependence are analysed in §4. Our model for the large-scale Galactic field is discussed in §5 and concluding remarks are in §6.
2 Pulsar Rotation Measures
2.1 Observations and data analysis
In observation sessions in 1999 December 12–17, 2000 December 14–19 and 2003 February 18–21 we made polarization observations at 20-cm wavelength of 270 pulsars using the central beam of the 13-beam multibeam receiver (Staveley-Smith et al., 1996) on the Parkes 64-m telescope. The receiver is a dual-channel cryogenic system sensitive to orthogonal linear polarizations with system equivalent flux density of about 29 Jy. Depending on their mean flux density, pulsars were observed for 10 – 30 min at each of two feed angles, . For the first two sessions, signals centred on 1318.5 MHz with a bandwidth of 128 MHz were processed in the Caltech correlator (Navarro, 1994), which gives 128 lags in each of four polarization channels and folds the data synchronously with the pulsar period in up to 1024 bins per period. Because of low gain and other instrumental effects, the upper 5 per cent and the lower quarter of the band were given zero weight, so that the effective bandwidth was about 90MHz. For the 2003 session a new wideband correlator with a bandwidth of 256 MHz centred at 1375 MHz and lags was used. In all cases, the data were transformed to the frequency domain, calibrated to give Stokes parameters, dedispersed to form between 8 and 64 frequency sub-bands and corrected for parallactic angle variations and ionospheric Faraday rotation – see Navarro et al. (1997) for details. The ionospheric RM was typically between and rad m-2 with a largely diurnal variation. The 2003 observations were processed using the psrchive software package (Hotan et al., 2004).
In off-line analysis, corresponding sub-bands from feed-angle pairs were added after normalization by the area of the Stokes I profile. Summing of the orthogonal feed-angle pairs eliminates most of the effects of polarisation cross-coupling in the feed. To determine the rotation measure, we searched for a peak in the total linearly polarized intensity obtained by summing in frequency using a set of trial RMs, normally in the range of 2000 rad m2 with a step of about 20 rad m2. Then, using the RM value corresponding to the peak, the data were summed to form upper and lower band profiles. Finally, the best estimate of the RM was then obtained by taking the weighted mean position-angle difference across the profile between the two bands, with the weight inversely proportional to the square of the error in position angle difference for each pulse phase bin. This procedure reduces the significance of the problem related to transitions between orthogonal modes discussed by Ramachandran et al. (2004).
2.2 The RM database
Rotation measures for 223 pulsars from the Parkes observations are listed in Table 1. The first two columns give the pulsar name based on J2000 coordinates and, where assigned, the name based on B1950 coordinates. Columns 3 to 6 give the pulsar period, DM and Galactic longitude and latitude. The pulsar distance given in column 7 is based on the pulsar DM and the NE2001 model for the Galactic distribution of interstellar electrons (Cordes & Lazio, 2002). For pulsars at distances greater than 5 kpc, Cordes & Lazio (2002) estimate that the derived distances have uncertainties of 10% in most of the fourth Galactic quadrant, but up to 20% near . The measured RM and its estimated standard error are given in the next two columns and the final column gives the observing session for that pulsar.
Of the 223 RMs in Table 1, nine are RMs of millisecond pulsars based on the present data set (Manchester & Han, 2004) which are included here for completeness. Excluding these, there are 27 pulsars in Table 1 for which previously published RM data exist. These 27 pulsars are listed in Table 2 showing that most of new values are consistent with, and sometimes better than, previous measurements. Small significant differences may be real in some cases, reflecting a changing RM. In some previous measurements, ionospheric RMs have not been taken into account, also leading to differences of a few rad m-2.
Five sources deserve particular comment. PSR J11164122 (B111441) has a very narrow and weakly polarized pulse. Both van Ommen et al. (1997) and Han et al. (1999) failed to get a good signal-to-noise ratio for the linear polarization to allow a reliable determination of the RM. Our integration time is longer and we believe our new measurement is reliable. The rapid position-angle sweep occurring in the narrow pulse of PSR J19462913 was not well resolved by Han et al. (1999). We observed with the full 1024-bin resolution and obtained a much better quality polarization profile and hence an improved value for the RM. The RM of PSR J23302005 seems to have steadily increased with time, from 9.50.2 rad m-2 (Hamilton et al., 1981) to 163 (Hamilton & Lyne, 1987) to 307 rad m-2 (this paper). This suggests that the line of sight is traversing a very compact magneto-ionic region. Our measured RM value for PSR J17572421 (B175424) is rad m-2, compared with the value of rad m-2 given by Hamilton & Lyne (1987). However, those authors said that the true RM for this pulsar could be smaller by 153 rad m-2 because of an unresolved ambiguity in their observations. Our measurement resolves this ambiguity and indicates that their value should be modified to rad m-2, bringing the two values into good agreement. Our measurements suggest that the RM for PSR J11416545 published in the discovery paper (Kaspi et al., 2000) has an incorrect sign.
We have used the ATNF Pulsar Catalogue111See http://www.atnf.csiro.au/research/pulsar/psrcat (Manchester et al., 2005) to obtain a total of 367 previously published RMs, principally from the major studies by Hamilton & Lyne (1987); Rand & Lyne (1994); Qiao et al. (1995); van Ommen et al. (1997); Han et al. (1999); Crawford et al. (2001); Mitra et al. (2003) and Weisberg et al. (2004). Adopting the most reliable value for pulsars with multiple measurements, we obtain RMs for a total of 554 pulsars. Most of these have been corrected for the ionospheric RM but, in any case, these corrections are small and will not significantly affect the analysis below for the magnetic fields in the Galactic disk.
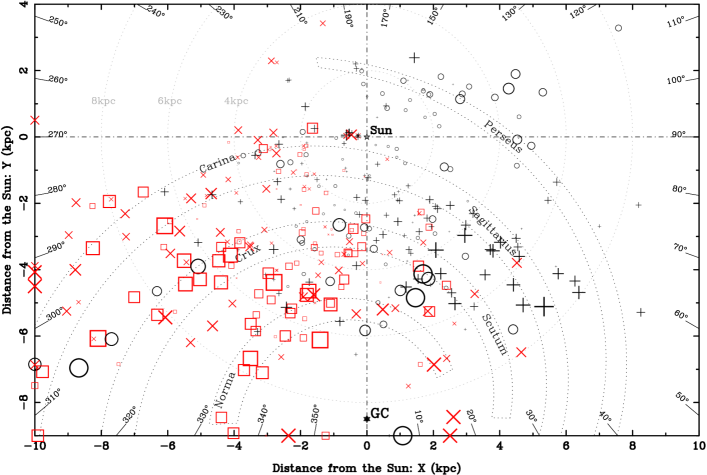
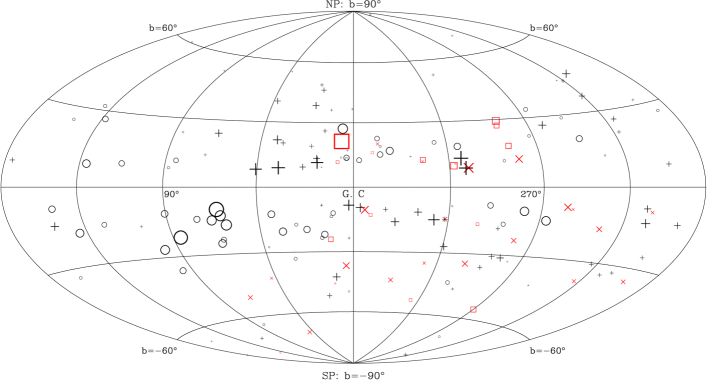
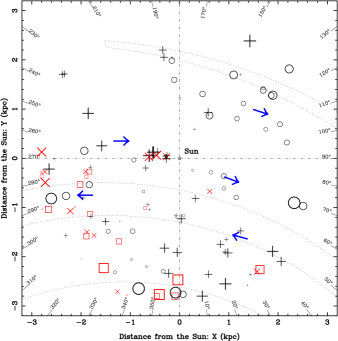
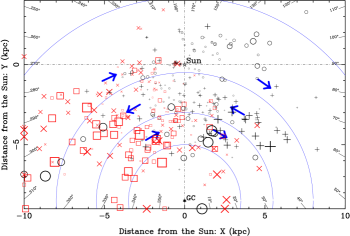
The RM distribution projected onto the Galactic plane for low-latitude pulsars () is shown in Figure 1. Figure 2 shows the distribution projected onto the celestial sphere for high-latitude pulsars (), including 36 new measurements, which may be used to probe the magnetic fields in the Galactic halo (e.g. Han et al., 1997). Pulsars with measured RMs now cover about one third of the Galactic disk; our new data very significantly improve the coverage in the fourth Galactic quadrant. Many pulsars in the inner Galaxy are close to or beyond tangential points, which enables us to begin to distinguish fields in the arm and interarm regions.
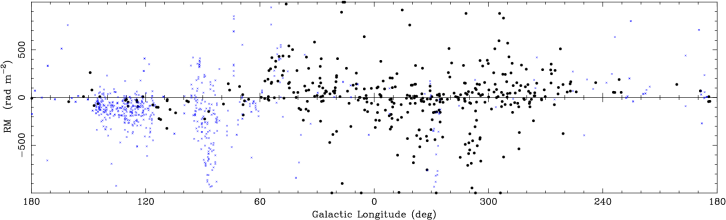
Radio polarisation surveys of the Galactic plane (e.g., Gaensler et al., 2001; Brown et al., 2003a) provide many RMs for low-latitude extragalactic sources. These sample the entire path through the Galaxy and are especially useful for diagnosing the magnetic field in the outer Galaxy where there are few known pulsars. Figure 3 shows the distribution in Galactic longitude of RMs for both pulsars and low-latitude extra-galactic sources.
3 Large-scale structure of magnetic fields in the Galactic disk
Figure 1 clearly shows that there is large-scale order in the distribution of Galactic magnetic fields. Rotation measures are predominantly positive in the first Galactic quadrant (longitudes ) and negative in the fourth quadrant (), implying an overall counterclockwise field in the Galaxy. As we discuss further below, closer examination of the data shows that the field direction is reversed in certain regions, mostly between the spiral arms. For these large-scale fields, we can assume that, because of stretching due to differential Galactic rotation, the azimuthal component of the field, , dominates over both the radial component, , and the vertical component, (Han et al., 1999). Local bubbles which cover a significant solid angle on the sky (Vallée, 1993) can result in an offset in the RM values for pulsars lying behind them; such offsets don’t significantly affect our analysis. Although individual pulsars may be affected by incorrect distances or HII regions along the line of sight, trends common to many pulsars average over these effects and give a reliable measure of the large-scale field.
As discussed by Lyne & Smith (1989), Han et al. (2002) and Weisberg et al. (2004), measuring the gradient of RM with distance or DM is a powerful method of determining both the direction and magnitude of the local large-scale field in particular regions of the Galaxy. Field strengths in different regions of the Galaxy can be estimated from the slope of trends in plots of RM versus DM since, from Equation 4, we have
| (5) |
where is the mean line-of-sight field component in G between distances and , and .
The locations of spiral arms in our Galaxy is a subject of much debate (see Burton, 1976; Russeil, 2003, for good summaries of the uncertainties). Based on observed tangent points (cf. Figure 13) and locations of giant molecular clouds, HII regions and star-formation complexes (Grabelsky et al., 1988; Solomon & Rivolo, 1989; Bronfman et al., 1989; Dame et al., 2001; Georgelin & Georgelin, 1976; Downes et al., 1980; Caswell & Haynes, 1987; Russeil, 2003) we have adopted locations for the major spiral arms as shown in Figure 1. These arms are approximately equiangular spirals with pitch angles of between and . While the locations (or even existence) of these arms is quite uncertain, especially in directions toward the Galactic Center, most of the discussion in this paper is based on regions around the tangential points which are reasonably well determined. Uncertainties in pulsar distances also have least effect in these directions.
We have applied Equation 5 to regions near the tangential points of the spiral arms as marked on Figure 4 where the large-scale field and the lines of sight have maximum projections. For regions around Galactic longitude (and also ), the large-scale field is nearly perpendicular to our line of sight and hence not measurable using Faraday rotation. We have taken all pulsars with RMs having errors of less than 25 rad m-2 with and lying within of the central longitude and within the distance ranges indicated on Fig. 4. The DM range corresponding to the adopted distance range was computed using the NE2001 model. We have determined RM–DM slopes using the robust straight-line fit method (see Sect.15.7 in Press et al., 1992), which minimizes the effects of anomalous outliers in the plots due, for example, to HII regions (Mitra et al., 2003), to give the mean field within the region. The uncertainty of is determined from the absolute mean deviation of RMs from the fitted line together with the average of DMs of pulsars in the region. We reject any fits if the uncertainty222The uncertainty of the fit reflects the mean deviation of the data which is dominated by random magnetic fields in the sample region. To judge the direction (i.e., sign) of the large-scale field, a 2 significance should be adequate; all our results below are in fact greater than 3., , is greater than 1 G or if has a significance of less than 2. Similar fits have been made to interarm regions as indicated in Fig. 4. For completeness, we briefly review previously published results for the large-scale magnetic field in the local region and near and beyond the Perseus arm.
3.1 The Norma spiral arm
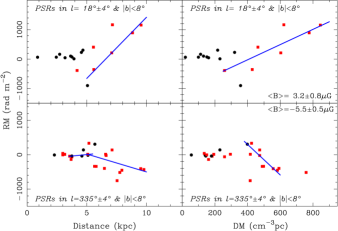
The large-scale field in the Norma arm, the inner-most identified arm in the Galaxy, has been discussed in detail by Han et al. (2002) based on the present dataset but using distances based on the Taylor & Cordes (1993) electron density model. Here we analyse the data with distances based on the NE2001 electron density model. Figure 5 shows RMs as a function of distance and DM for low-latitude pulsars lying near and . The fitted lines for distances between 6 and 10 kpc are within the Norma arm (see Figure 4). The line between 3 and 5 kpc at corresponds to the adjacent interarm region and will be discussed in §3.4. It is clear that the conclusions of Han et al. (2002) are maintained. The RM gradient for pulsars between 6 and 10 kpc from the Sun is positive for and negative for showing that the magnetic field is coherently counterclockwise along the arm across both quadrants. Even more negative RMs for extragalactic sources around (see Figure 3, data from Gaensler et al., 2001) indicate that the counterclockwise field in the Norma arm is maintained beyond 10 kpc from the Sun in this direction.
3.2 The Crux–Scutum arm
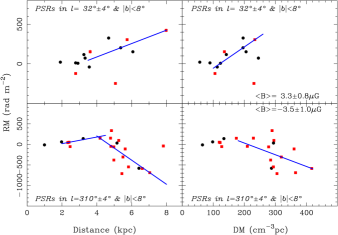
The present observations have provided a large number of new RMs in the regions near the tangential point of the Crux arm (Figure 1). In this arm, near , the RMs are mostly negative, whereas those around , passing along the Scutum arm, are mostly positive, clearly indicating a counterclockwise field in the whole of the Crux–Scutum arm. The variation of RM with distance and DM is shown for pulsars in these directions in Figure 6. For there is a clear decrease in RM with increasing distance through the Crux arm, indicating a large-scale field directed away from the Sun. There is a corresponding increase in RM for pulsars more distant than 3 kpc lying along the Scutum arm. This tendency is also seen in the data of Weisberg et al. (2004) (their Figure 8). These results are then consistent with a counterclockwise large-scale field through the whole of the Crux–Scutum arm.
3.3 The Carina–Sagittarius arm
It is clear from Figure 1 that the Sagittarius arm is dominated by positive RMs which increase with distance, indicating a counterclockwise field in this arm. This is also shown by Figure 7 where there is a clear trend for RMs of pulsars at longitudes near in the distance range 2 – 7 kpc to increase with distance (cf. Fig.6 of Weisberg et al. (2004).) In this case, the adopted tangential longitude is somewhat inside that for an equiangular spiral (cf. Figure 4) but it is consistent with the arm location adopted by Cordes & Lazio (2002). The evidence for a counterclockwise field in this arm has been discussed by many previous authors (e.g. Lyne & Smith, 1989; Han & Qiao, 1994; Indrani & Deshpande, 1998; Weisberg et al., 2004).
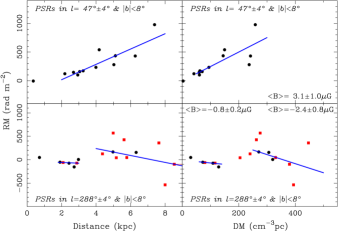
The Carina arm is evidently more complicated. Figure 7 shows a plot of RM versus distance and DM for pulsars within of . Between 1 and 3 kpc from the Sun, RMs in this direction are increasingly negative, consistent with a continuation of the counterclockwise field from the Sagittarius arm (see also Frick et al., 2001). However, as Figure 1 shows, the newly determined RMs for distant pulsars through the Carina arm are unexpectedly positive. At distances greater than 4 kpc, there is a large scatter in the RM versus distance and DM plots (Figure 7) but a fit to the data again shows a negative slope indicating a counterclockwise field in the outer parts of this arm. The offset of about +500 rad m-2 between the two lines indicates a region of reversed field between 3 and 5 kpc from the Sun. The origin of this “Carina anomaly” is not clear, but there are many large HII regions in this region which could have a significant influence on the RMs of pulsars lying behind them. This anomalous region may also account for the group of large positive RMs for very distant pulsars with longitude between and (Figure 1).
3.4 Interarm regions in the inner Galaxy
In the first Galactic quadrant, it is difficult to separate arm and interarm contributions because of the small separation of the arms. A group of very negative RMs for pulsars between longitudes and and lying just beyond the Scutum arm (Figure 1) was taken by Rand & Lyne (1994) as evidence for a clockwise field near or beyond the Scutum arm, a result adopted by Han et al. (1999) and Weisberg et al. (2004).
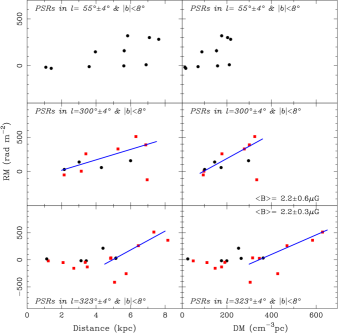
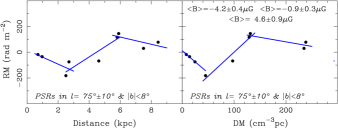
Figure 8 shows RM plots for several interarm regions. Three postive RMs for pulsars around at about 7.5 kpc (Figure 1) hint at a counter-clockwise field between the Sagittarius arm and the pulsars, though one of them (PSR J1927+1852) has a large RM uncertainty () and been omitted in Figure 8. Obviously, this result is of very low statistical significance.
The situation is better in the fourth quadrant where we have a large number of new RMs and there is a larger separation of the arms making distance uncertainties less important. Figure 5 shows that the RM is increasing between 3.5 and 5.5 kpc for , suggesting a clockwise magnetic field between the Crux and Norma arms. Similarly, an increasing RM between 2 and 4 kpc in Figure 6 indicates the clockwise field between the Carina and Crux arms. Figure 8 shows the distance and DM dependence of RMs of more distant pulsars in the interarm regions between the Carina, Crux and Norma arms. For there is a clear tendency for increasing RM with distance between 3 and 7 kpc, suggesting a clockwise field in the region between the Carina and Crux arms. Similarly, RMs for pulsars lying between 5 and 8 kpc in the direction show a positive trend, increasing from very negative values at 5 kpc to positive values at 8 kpc. This again suggests a clockwise field in this interarm region.
3.5 The local region
Figure 9 gives an expanded view of the the RM distribution in the local region, i.e. within kpc of the Sun. The large-scale field in the local interarm region, i.e. between the Carina–Sagittarius arm and the Perseus arm, has long been known to have a clockwise direction (e.g. Manchester, 1974), with mostly negative RMs for longitudes within of and mostly positive for longitudes within of . A few new RM measurements around reinforce this conclusion.
As discussed above, pulsars in the Carina and Sagittarius arms have different RM signs to those in the interarm region, clearly indicating a reversal of the large-scale field between the arm and interarm regions. Han & Qiao (1994) and Indrani & Deshpande (1998) have modelled the field in this region as a bisymmetric spiral after taking into account local anomalies resulting from bubbles and HII regions (Vallée, 1993). The pitch angle of the spiral field is , close to the value of spiral arms, and its strength is about 1.8G (Han, 2001). Similar conclusions were reached by Frick et al. (2001) but they derived a steeper pitch angle, .
3.6 The outer Galaxy
The direction of the magnetic field in the Perseus arm cannot be established with any certainty. Rotation measures for distant pulsars and extragalactic sources are strongly negative between longitudes of and (Figures 1 and 3). This has been used by many authors (e.g. Brown & Taylor, 2001; Brown et al., 2003b; Mitra et al., 2003) to argue for an absence of any reversals in the outer part of the Galaxy, through and beyond the Perseus arm. In any case, it seems clear that the interarm fields both between the Sagitarius and Perseus arms and beyond the Perseus arm are predominantly clockwise.
Few pulsars are known in the outer parts of the Galaxy, making determination of the field structure difficult and uncertain. Also, for longitudes between roughly and our line of sight is nearly perpendicular to the spiral structure, so RMs are not sensitive to the dominant longitudinal or spiral field component. A group of four positive RMs around to were used by Han et al. (1999) and Weisberg et al. (2004) to argue for a counterclockwise magnetic field in the Perseus arm, reversed from the local clockwise field. Based on extra-galactic RMs, Frick et al. (2001) also concluded that the field in the Perseus arm is counterclockwise. However, as Figure 10 shows, there is a weak but apparently significant decrease of RM with increasing DM beyond kpc, indicating a clockwise field exterior to the Perseus arm. Also, the predominantly negative RMs of extragalactic radio sources around (see Figure 3), in contrast to postive RMs of pulsars in or near the Perseus arm, suggest that magnetic fields exterior to the Perseus arm are clockwise. The pulsar distance scale is quite uncertain in this region and it is possible that the four pulsars actually lie (just) beyond the Perseus arm.

4 Magnetic field strength
Various authors have suggested that the large-scale magnetic fields in the Galactic disk are stronger towards the Galactic Center (e.g. Sofue & Fujimoto, 1983; Rand & Lyne, 1994; Heiles, 1996). Such a radial variation has been assumed in modelling of the Galactic synchrotron emission (Berkhuijsen, unpublished but cited in Beck et al., 1996) and the Galactic ray background by Strong et al. (2000). In the local region, measurements of the mean field strength give values of G (Han & Qiao, 1994; Indrani & Deshpande, 1998), whereas Han et al. (2002) find a value of G in the Norma arm. With the much extended pulsar RM data now covering about one third of the Galactic disk, we are better able to investigate the dependence of field strength on Galactocentric radius.
Taking the field strengths for directions in the inner Galaxy and the local field strength from Han & Qiao (1994), and correcting for the angle between the assumed dominant azimuthal field direction and the line of sight, we obtain the field strengths shown in Figure 11 as a function of Galactocentric radius. Although uncertainties are large, there are clear tendencies for fields to be stronger at smaller Galactocentric radii and weaker in interarm regions.
To parameterize the radial variation, we tried fitting different functions to the data: a constant (Rand & Kulkarni, 1989; Han & Qiao, 1994), a -function (Sofue & Fujimoto, 1983), a linear gradient and an exponential function (Strong et al., 2000). The exponential function not only gives the smallest value but also avoids the singularity at (for ) and unphysical values at large R (for the linear gradient). The fitted function shown in Figure 11 is
| (6) |
with the strength of the large-scale or regular field at the Sun, G and the scale radius kpc.
5 Global structure of magnetic fields in the Galactic disk
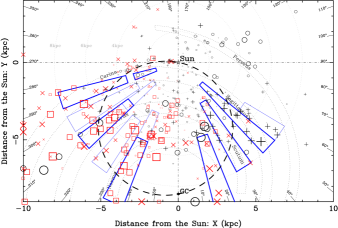
Although there remain considerable uncertainties in several regions, a striking pattern emerges from the above discussion: large-scale magnetic fields in spiral arms are counterclockwise (viewed from the north) but in the interarm regions the fields are clockwise. Figure 12 summarizes the evidence for this bisymmetric global pattern, which is mainly based on the field directions near the tangential points derived in §3, for this bisymmetric global pattern. These data are relatively insensitive to uncertainties in the pulsar distance scale or errors in distances to individual pulsars.
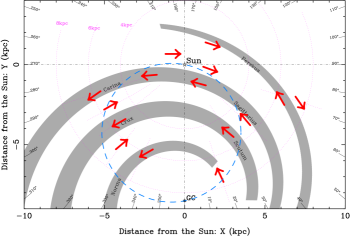
To further quantify this evidence, we have used Equation 5 to compute the mean line-of-sight field strength in regions tangential to an equiangular spiral pattern of pitch angle . The locus of these tangential points is shown in Figure 12. At 4-degree intervals of longitude, the RM versus DM dependence was determined by a least-squares fit of a line to data for pulsars with lying within a box of longitude width centered on the tangential point. The ends of the box were defined by the points at which the spiral through the tangental point reached a longitude that is from the longitude of the tangental point, typically 1 – 2 kpc from the tangential point. RMs with uncertainties greater than 30 rad m-2 were omitted from the fits. Figure 13 shows mean tangential fields determined in this way, plotted as as a function of Galactic longitude. We emphasize that the pulsar samples used to compute these mean fields are uniformly selected according to above criteria and that they are independent of any model for the large-scale structure.
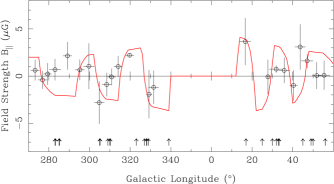
Also plotted in Figure 13 is the mean line-of-sight field strength from a simplified model of a bisymmetric spiral field of pitch angle which is counterclockwise within spiral arms and clockwise in the interarm regions. A rectangular field variation with Galactocentric radius was assumed, with discontinuous changes in field direction at the arm-interarm boundaries. The arm width was assumed to be equal to interarm width. Both arm and inter arm fields were assumed to vary according to Equation 6 with a scale radius of 8.5 kpc and a strength at kpc of 2.1 G. For each longitude, the mean field was computed over a path centered on the tangential point with endpoints defined as described above, thereby modelling the procedure used to compute the observed mean fields.
While there remains considerable uncertainty in many of the derived field strengths, overall there is very good agreement between the field directions predicted by the bisymmetric model and those from the data, giving strong support to this model for the large-scale field in the Galaxy. The only places where there is substantial disagreement between the observed and modelled fields are the Carina region around longitude and the Scutum – Sagittarius interarm region around . As discussed in §3.3, mean field strengths over most of the Carina arm are in accordance with the model, but there is a region of reversed field around the tangential point – the Carina anomaly – which dominates the fits shown in Figure 13 for this region. The apparently discrepant point near can be accounted for by an inward shift of the Sagittarius arm compared to the equiangular spiral model as discussed in §3.3.
The model of large-scale fields following the spiral arms is inconsistent with ring models proposed by Rand & Kulkarni (1989), Rand & Lyne (1994) and Vallée (2005) for RMs of pulsars, which interpret the field structure as azimuthal within concentric rings centered on the Galactic Center as one option tried by Simard-Normandin & Kronberg (1980) for RMs of extragalactic radio sources. Figure 14 illustrates the models of Rand & Kulkarni (1989) and Rand & Lyne (1994) with clockwise fields between Galactocentric radii of 3.5 and 5.5 kpc and between 8.0 and 12.5 kpc. In the middle ring between 5.5 and 8.0 kpc the fields are counterclockwise. Based on a statistical analysis of previously published pulsar RM data, Vallée (2005) has recently proposed a very similar model with counterclockwise fields between 5 and 7 kpc and clockwise fields elsewhere.
These ring models are obviously dominated by the postive RMs of pulsars in the Sagittarius arm and the negative RMs of pulsars in the Crux arm. While they were reasonably consistent with earlier observations in the inner and outer rings, they are inconsistent with the new observations, especially for the inner ring around longitudes of (Norma arm). The regular reversals of field direction from the arm to interarm regions suggested by Figure 13 are also inconsistent with the axisymmetric field model of Vallée (1996).
Previous bisymmetric models for the large-scale structure (e.g., Han & Qiao, 1994; Indrani & Deshpande, 1998) have considered configurations where the field has opposite sign in alternate spiral arms, and consequently half as many reversals as a function of Galactocentric radius as the model presented here. These models were primarily based on RMs for pulsars in the local region, fine within kpc of the Sun. With the new RM data set now available, it is clear that this type of model does not fit the data in a larger region.
While there are many caveats regarding pulsar distances and the locations of spiral arms in the Galaxy, we believe that the evidence presented here is strongly suggestive that the large-scale magnetic field in our Galaxy has a bisymmetric form with counterclockwise fields in the spiral arms and clockwise fields in the interarm regions. Even with our increased sample, field strengths are poorly determined in many regions and a larger number of pulsar RMs would obviously help. The NE2001 pulsar distance model is based on a large suite of measurements and is believed to be statistically accurate to 5 or 10% in most directions (Cordes & Lazio, 2002). Individual distances may be in error by much more than this but, as discussed above, the effect of such errors is minimised by the averaging procedure used to determine mean field strengths and directions. The effect of uncertainties in the locations of spiral arms is also minimised by our emphasis on field measurements around the tangential points. However, it does affect the interpretation in interarm regions to a greater extent. One could reverse the problem and argue that the observed continuity of field directions over large sections of the assumed spiral arms is evidence for their reality.
Streaming motion in the Galactic disk associated with the spiral structure (e.g. Shane & Bieger-Smith, 1966) provides a simple mechanism for producing fields of opposite sign in the arm and interarm regions. In classical density-wave streaming (e.g. Neininger, 1992), peak tangential velocities are against the direction of rotation on the inner edge of the arm (causing a pile-up of gas in the arm) and with the direction of rotation on the outer edge of the arm (resulting in low interarm densities) (e.g., Rohlfs, 1977; Adler & Westpfahl, 1996). A frozen-in, initially radial, field will therefore be aligned with the spiral pattern with oppositely directed fields in the arm and interarm regions. For our Galaxy, an initially inwardly directed radial field will become clockwise in the interarm regions and counterclockwise in the arms. This idea appears related to the simulations of Gómez & Cox (2004) who find that an initially azimuthal field has reversed pitch angles in the arm and interarm regions. Spiral arms are narrower than the interarm regions (e.g., Adler & Westpfahl, 1996; Cox & Gómez, 2002). We have shown in Figure 11 that interarm field strengths are less than those in spiral arms. Therefore in this model it is quite possible for the Galaxy as a whole to have zero net magnetic flux.
Even if the Galaxy has zero net magnetic flux, RMs for extragalactic sources will tend to be dominated by the spiral arm fields because of the combination of stronger fields and higher electron densities in the arms. Especially where the path crosses several arms, the effect of the reversed fields in the interarm regions will not be obvious. Only pulsars with their distance discrimination can clearly show these reversed fields. Similarly, if external galaxies have the same field structure as we propose for our Galaxy, RM measurements are likely to be dominated by the spiral-arm fields when the resolution is not high enough, leading to the erronous conclusion that the field is axisymmetric (e.g., Krause & Beck, 1998).
6 Conclusions
Pulsars have unique advantages as probes of the large-scale Galactic magnetic field. Their distribution throughout the Galaxy at approximately known distances allows a true three-dimensional mapping of the large-scale field structure. Furthermore, combined with the measured DMs, pulsar RMs give us a direct measure of the mean line-of-sight field strength along the path, weighted by the local electron density.
We have measured RMs for 223 pulsars, most of which lie in the fourth and first Galactic quadrants and are relatively distant. These new measurements enable us to investigate the structure of the Galactic magnetic field over a much larger region than was previously possible. Clear evidence is found for coherent large-scale fields aligned with the spiral-arm structure of the Galaxy. In all of the inner arms (Norma, Crux-Scutum, Carina-Sagittarius) there is strong evidence that the large-scale fields are counterclockwise when viewed from the north Galactic pole. Weaker evidence also suggests that a counterclockwise field is present in the Perseus arm. On the other hand, at least in the local region and in the inner Galaxy in the fourth quadrant, there is good evidence that the fields in interarm regions are similarly coherent, but clockwise in orientation. Evidence is also presented that large-scale magnetic fields are stronger in the inner part of the Galaxy and that fields in interarm regions are weaker than those in spiral arms.
We therefore propose a bisymmetric model for the large-scale Galactic magnetic field with reversals on arm-interarm boundaries so that all arm fields are counterclockwise and all interarm fields are clockwise. This model for the Galactic magnetic field is appealing in its simplicity. It receives strong support from an objective analysis of mean line-of-sight fields near tangential points of an equiangular spiral. However, it clearly needs to be backed up by further observational work and by modelling of the effects of streaming motions on various initial field configurations. It is possible that the mode of initial field formation is not critical in determining the dominant present-day structure. Further rotation measure observations, especially for interarm regions and especially in the first Galactic quadrant, would be especially valuable.
Acknowledgments
We thank the anonymous referee for constructive comments. JLH is supported by the National Natural Science Foundation (NNSF) of China (1025313, 10473015, 10521001) and the National Key Basic Research Science Foundation of China (G19990756). GJQ also thanks the NNSF of China for support of his visits at ATNF. JLH and GJQ also thank the ATNF and RNM for their hospitality. The Parkes telescope is part of the Australia Telescope which is funded by the Commonwealth Government for operation as a National Facility managed by CSIRO.
References
- Adler & Westpfahl (1996) Adler, D. S. & Westpfahl, D. J. 1996, AJ, 111, 735
- Beck et al. (1996) Beck, R., Brandenburg, A., Moss, D., Shukurov, A., & Sokoloff, D. 1996, ARA&A, 34, 155
- Bronfman et al. (1989) Bronfman, L., Alvarez, H., Cohen, R. S., & Thaddeus, P. 1989, ApJS, 71, 481
- Brown & Taylor (2001) Brown, J. C. & Taylor, A. R. 2001, ApJ, 563, L31
- Brown et al. (2003a) Brown, J. C., Taylor, A. R., & Jackel, B. J. 2003a, ApJS, 145, 213
- Brown et al. (2003b) Brown, J. C., Taylor, A. R., Wielebinski, R., & Mueller, P. 2003b, ApJ, 592, L29
- Burton (1976) Burton, W. B. 1976, ARA&A, 14, 275
- Caswell & Haynes (1987) Caswell, J. L. & Haynes, R. F. 1987, A&A, 171, 261
- Clegg et al. (1992) Clegg, A. W., Cordes, J. M., Simonetti, J. M., & Kulkarni, S. R. 1992, ApJ, 386, 143
- Cordes & Lazio (2002) Cordes, J. M. & Lazio, T. J. W. 2002, http://xxx.lanl.gov/abs/astro-ph/0207156
- Costa et al. (1991) Costa, M. E., McCulloch, P. M., & Hamilton, P. A. 1991, MNRAS, 252, 13
- Cox & Gómez (2002) Cox, D. P. & Gómez, G. C. 2002, ApJS, 142, 261
- Crawford & Keim (2003) Crawford, F. & Keim, N. C. 2003, ApJ, 590, 1020
- Crawford et al. (2001) Crawford, F., Manchester, R. N., & Kaspi, V. M. 2001, AJ, 122, 2001
- Crutcher (1999) Crutcher, R. M. 1999, ApJ, 520, 706
- Dame et al. (2001) Dame, T. M., Hartmann, D., & Thaddeus, P. 2001, ApJ, 547, 792
- Downes et al. (1980) Downes, D., Wilson, T. L., Bieging, J., & Wink, J. 1980, A&AS, 40, 379
- Drimmel (2000) Drimmel, R. 2000, A&A, 358, L13
- Duncan et al. (1997) Duncan, A. R., Haynes, R. F., Jones, K. L., & Stewart, R. T. 1997, MNRAS, 291, 279
- Duncan et al. (1998) Duncan, A. R., Haynes, R. F., Reich, W., Reich, P., & Gray, A. D. 1998, MNRAS, 299, 942
- Duncan et al. (1999) Duncan, A. R., Reich, P., Reich, W., & Fürst, E. 1999, A&A, 350, 447
- Englmaier & Gerhard (1999) Englmaier, P. & Gerhard, O. 1999, MNRAS, 304, 512
- Fish et al. (2003) Fish, V. L., Reid, M. J., Argon, A. L., & Menten, K. M. 2003, ApJ, 596, 328
- Frick et al. (2001) Frick, P., Stepanov, R., Shukurov, A., & Sokoloff, D. 2001, MNRAS, 325, 649
- Gómez & Cox (2004) Gómez, G. C. & Cox, D. P. 2004, ApJ, 615, 744
- Gaensler et al. (2001) Gaensler, B. M., Dickey, J. M., McClure-Griffiths, N. M., Green, A. J., Wieringa, M. H., & Haynes, R. F. 2001, ApJ, 549, 959
- Georgelin & Georgelin (1976) Georgelin, Y. M. & Georgelin, Y. P. 1976, A&A, 49, 57
- Grabelsky et al. (1988) Grabelsky, D. A., Cohen, R. S., Bronfman, L., & Thaddeus, P. 1988, ApJ, 331, 181
- Hamilton & Lyne (1987) Hamilton, P. A. & Lyne, A. G. 1987, MNRAS, 224, 1073
- Hamilton et al. (1981) Hamilton, P. A., McCulloch, P. M., & Manchester, R. N. 1981, unpublished work
- Han (2001) Han, J. L. 2001, A&AS, 278, 181
- Han et al. (2004) Han, J. L., Ferriere, K., & Manchester, R. N. 2004, ApJ, 610, 820
- Han et al. (1997) Han, J. L., Manchester, R. N., Berkhuijsen, E. M., & Beck, R. 1997, A&A, 322, 98
- Han et al. (2002) Han, J. L., Manchester, R. N., Lyne, A. G., & Qiao, G. J. 2002, ApJ, 570, L17
- Han et al. (1999) Han, J. L., Manchester, R. N., & Qiao, G. J. 1999, MNRAS, 306, 371
- Han & Qiao (1994) Han, J. L. & Qiao, G. J. 1994, A&A, 288, 759
- Han & Wielebinski (2002) Han, J. L. & Wielebinski, R. 2002, ChJAA, 2, 293
- Haverkorn et al. (2003) Haverkorn, M., Katgert, P., & de Bruyn, A. G. 2003, A&A, 403, 1031
- Haynes et al. (1992) Haynes, R. F., Stewart, R. T., Gray, A. D., Reich, W., Reich, P., & Mebold, U. 1992, A&A, 264, 500
- Heiles (1996) Heiles, C. 1996, in ASP Conf. Ser. 97: Polarimetry of the Interstellar Medium, ed. W. Roberge & D. Whittet, 457
- Heiles (1996) Heiles, C. 1996, ApJ, 462, 316
- Hobbs et al. (2004) Hobbs, G., Faulkner, A., Stairs, I. H., Camilo, F., Manchester, R. N., Lyne, A. G., Kramer, M., D’Amico, N., Kaspi, V. M., Possenti, A., McLaughlin, M. A., Lorimer, D. R., Burgay, M., Joshi, B. C., & Crawford, F. 2004, MNRAS, 352, 1439
- Hotan et al. (2004) Hotan, A. W., van Straten, W., & Manchester, R. N. 2004, PASA, 21, 302
- Indrani & Deshpande (1998) Indrani, C. & Deshpande, A. A. 1998, New Astronomy, 4, 33
- Junkes et al. (1987) Junkes, N., Fürst, E., & Reich, W. 1987, A&AS, 69, 451
- Kaspi et al. (2000) Kaspi, V. M., Lackey, J. R., Mattox, J., Manchester, R. N., Bailes, M., & Pace, R. 2000, ApJ, 528, 445
- Kramer et al. (2003) Kramer, M., Bell, J. F., Manchester, R. N., Lyne, A. G., Camilo, F., Stairs, I. H., D’Amico, N., Kaspi, V. M., Hobbs, G., Morris, D. J., Crawford, F., Possenti, A., Joshi, B. C., McLaughlin, M. A., Lorimer, D. R., & Faulkner, A. J. 2003, MNRAS, 342, 1299
- Krause & Beck (1998) Krause, F. & Beck, R. 1998, A&A, 335, 789
- Lyne & Smith (1989) Lyne, A. G. & Smith, F. G. 1989, MNRAS, 237, 533
- Manchester (1972) Manchester, R. N. 1972, ApJ, 172, 43
- Manchester (1974) Manchester, R. N. 1974, ApJ, 188, 637
- Manchester & Han (2004) Manchester, R. N. & Han, J. L. 2004, ApJ, 609, 354
- Manchester et al. (2005) Manchester, R. N., Hobbs, G. B., Teoh, A., & Hobbs, M. 2005, AJ, 129, 1993
- Manchester et al. (2001) Manchester, R. N., Lyne, A. G., Camilo, F., Bell, J. F., Kaspi, V. M., D’Amico, N., McKay, N. P. F., Crawford, F., Stairs, I. H., Possenti, A., Morris, D. J., & Sheppard, D. C. 2001, MNRAS, 328, 17
- Mitra et al. (2003) Mitra, D., Wielebinski, R., Kramer, M., & Jessner, A. 2003, A&A, 398, 993
- Morris et al. (2002) Morris, D. J., Hobbs, G., Lyne, A. G., Stairs, I. H., Camilo, F., Manchester, R. N., Possenti, A., Bell, J. F., Kaspi, V. M., Amico, N. D., McKay, N. P. F., Crawford, F., & Kramer, M. 2002, MNRAS, 335, 275
- Navarro (1994) Navarro, J. 1994, PhD thesis, California Institute of Technology
- Navarro et al. (1997) Navarro, J., Manchester, R. N., Sandhu, J. S., Kulkarni, S. R., & Bailes, M. 1997, ApJ, 486, 1019
- Neininger (1992) Neininger, N. 1992, A&A, 263, 30
- Novak et al. (2003) Novak, G., Chuss, D. T., Renbarger, T., Griffin, G. S., Newcomb, M. G., Peterson, J. B., Loewenstein, R. F., Pernic, D., & Dotson, J. L. 2003, ApJ, 583, L83
- Ohno & Shibata (1993) Ohno, H. & Shibata, S. 1993, MNRAS, 262, 953
- Press et al. (1992) Press, W. H., Teukolsky, S. A., Vetterling, W. T., & Flannery, B. P. 1992, Numerical Recipes: The Art of Scientific Computing, 2nd edition (Cambridge: Cambridge University Press)
- Qiao et al. (1995) Qiao, G. J., Manchester, R. N., Lyne, A. G., & Gould, D. M. 1995, MNRAS, 274, 572
- Ramachandran et al. (2004) Ramachandran, R., Backer, D. C., Rankin, J. M., Weisberg, J. M., & Devine, K. E. 2004, ApJ, 606, 1167
- Rand & Kulkarni (1989) Rand, R. J. & Kulkarni, S. R. 1989, ApJ, 343, 760
- Rand & Lyne (1994) Rand, R. J. & Lyne, A. G. 1994, MNRAS, 268, 497
- Reich et al. (2002) Reich, W., Fürst, E., Reich, P., Wielebinski, R., & Wolleben, M. 2002, in AIP Conf. Proc. 609: Astrophysical Polarized Backgrounds, 3–8
- Roberts et al. (2001) Roberts, M. S. E., Romani, R. W., & Johnston, S. 2001, ApJ, 561, L187
- Rohlfs (1977) Rohlfs, K. 1977, Lectures on density wave theory (Lecture Notes in Physics, Berlin: Springer Verlag, 1977)
- Russeil (2003) Russeil, D. 2003, A&A, 397, 133
- Shane & Bieger-Smith (1966) Shane, W. W. & Bieger-Smith, G. P. 1966, Bull. Astron. Inst. Netherlands, 18, 263
- Simard-Normandin & Kronberg (1980) Simard-Normandin, M. & Kronberg, P. P. 1980, ApJ, 242, 74
- Sofue & Fujimoto (1983) Sofue, Y. & Fujimoto, M. 1983, apj, 265, 722
- Solomon & Rivolo (1989) Solomon, P. M. & Rivolo, A. R. 1989, ApJ, 339, 919
- Staveley-Smith et al. (1996) Staveley-Smith, L., Wilson, W. E., Bird, T. S., Disney, M. J., Ekers, R. D., Freeman, K. C., Haynes, R. F., Sinclair, M. W., Vaile, R. A., Webster, R. L., & Wright, A. E. 1996, Proc. Astr. Soc. Aust., 13, 243
- Strong et al. (2000) Strong, A. W., Moskalenko, I. V., & Reimer, O. 2000, ApJ, 537, 763
- Taylor & Cordes (1993) Taylor, J. H. & Cordes, J. M. 1993, ApJ, 411, 674
- Thomson & Nelson (1980) Thomson, R. C. & Nelson, A. H. 1980, MNRAS, 191, 863
- Uyanıker & Landecker (2002) Uyanıker, B. & Landecker, T. L. 2002, ApJ, 575, 225
- Vallée (2005) Vallée, J. P. 2005, ApJ, 619, 297
- Vallée (1993) Vallée, J. P. 1993, ApJ, 419, 670
- Vallée (1996) Vallée, J. P. 1996, A&A, 308, 433
- van Ommen et al. (1997) van Ommen, T. D., D’Alesssandro, F. D., Hamilton, P. A., & McCulloch, P. M. 1997, MNRAS, 287, 307
- Weisberg et al. (2004) Weisberg, J. M., Cordes, J. M., Kuan, B., Devine, K. E., Green, J. T., & Backer, D. C. 2004, ApJS, 150, 317
| PSR J | PSR B | Period | DM | Distance | RM | Obs. | |||
|---|---|---|---|---|---|---|---|---|---|
| (ms) | (cm-3 pc) | () | () | (kpc) | (rad m-2) | (rad m-2) | Date | ||
| J01081431 | 807.57 | 2.38 | 140.93 | 76.82 | 0.20 | 0.3 | 1 | Feb03 | |
| J02118159 | 1077.33 | 24.36 | 299.59 | 34.60 | 1.00 | 54 | 9 | Dec00 | |
| J02555304 | B025453 | 447.71 | 15.90 | 269.86 | 55.31 | 0.73 | 35 | 3 | Dec00 |
| J04210345 | 2161.31 | 44.61 | 197.50 | 34.75 | 2.96 | 30 | 14 | Dec00 | |
| J04482749 | 450.45 | 26.22 | 228.34 | 37.91 | 1.29 | 24 | 17 | Dec99 | |
| J06130200 | 3.06 | 38.78 | 210.41 | 9.30 | 1.71 | 19 | 14 | Dec00 | |
| J06302834 | B062828 | 1244.42 | 34.47 | 236.95 | 16.75 | 1.45 | 47 | 1 | Dec99 |
| J06311036 | 287.77 | 125.50 | 201.21 | 0.45 | 3.67 | 137 | 8 | Dec00 | |
| J07116830 | 5.49 | 18.41 | 279.53 | 23.28 | 0.86 | 41 | 9 | Dec00 | |
| J07251635 | 424.31 | 98.98 | 231.47 | 0.33 | 3.68 | 188 | 12 | Dec99 | |
| J07291448 | 251.66 | 92.30 | 230.39 | 1.42 | 3.52 | 55 | 6 | Dec00 | |
| J07384042 | B073640 | 374.92 | 160.80 | 254.19 | 9.19 | 2.64 | 11 | 2 | Dec00 |
| J07494247 | 1095.45 | 104.59 | 257.06 | 8.34 | 0.25 | 80 | 30 | Dec00 | |
| J08094753 | B080847 | 547.20 | 228.30 | 263.30 | 7.95 | 0.27 | 105 | 5 | Dec00 |
| J08314406 | 311.67 | 254.00 | 262.28 | 2.69 | 0.47 | 509 | 20 | Dec99 | |
| J08344159 | 121.12 | 240.50 | 260.88 | 1.04 | 1.66 | 377 | 31 | Dec00 | |
| J08353707 | 541.40 | 112.30 | 257.07 | 1.99 | 0.60 | 68 | 47 | Dec00 | |
| J08554644 | 64.69 | 238.20 | 266.96 | 1.00 | 3.88 | 249 | 22 | Dec00 | |
| J08554658 | 575.07 | 472.70 | 267.11 | 1.19 | 12.81 | 350 | 50 | Dec00 | |
| J09014624 | 441.99 | 198.80 | 267.40 | 0.00 | 2.82 | 289 | 22 | Dec00 | |
| J09054536 | 988.28 | 116.80 | 267.23 | 1.01 | 0.62 | 153 | 22 | Dec99 | |
| J09055127 | 346.29 | 196.43 | 271.63 | 2.85 | 3.29 | 292 | 3 | Dec99 | |
| J09224949 | 950.29 | 237.10 | 272.23 | 0.16 | 4.17 | 15 | 5 | Dec99 | |
| J09245814 | B092358 | 739.50 | 57.40 | 278.40 | 5.96 | 1.86 | 45 | 1 | Feb03 |
| J09405428 | 87.54 | 134.50 | 277.51 | 1.29 | 2.95 | 18 | 14 | Dec00 | |
| J09415244 | 658.56 | 157.94 | 276.44 | 0.09 | 3.14 | 243 | 4 | Dec99 | |
| J09545430 | 472.83 | 200.30 | 278.99 | 0.10 | 3.94 | 65 | 10 | Dec99 | |
| J09594809 | B095747 | 670.09 | 92.70 | 275.74 | 5.41 | 2.76 | 50 | 6 | Dec00 |
| J10005149 | 255.68 | 72.80 | 278.10 | 2.60 | 1.93 | 46 | 9 | Dec00 | |
| J10015507 | B095954 | 1436.58 | 130.00 | 280.22 | 0.08 | 2.77 | 297 | 18 | Dec00 |
| J10015559 | 1661.18 | 159.30 | 280.69 | 0.64 | 3.32 | 112 | 11 | Dec00 | |
| J10034747 | B100147 | 307.07 | 98.10 | 276.04 | 6.12 | 2.93 | 18 | 4 | Feb03 |
| J10125857 | B101158 | 819.91 | 383.90 | 283.70 | 2.14 | 7.93 | 74 | 6 | Dec00 |
| J10135934 | 442.90 | 379.78 | 284.13 | 2.59 | 8.53 | 97 | 7 | Dec99 | |
| J10155719 | 139.88 | 278.70 | 283.08 | 0.57 | 5.06 | 125 | 7 | Dec00 | |
| J10165345 | B101453 | 769.58 | 66.80 | 281.20 | 2.45 | 1.93 | 21 | 4 | Feb03 |
| J10165857 | 107.38 | 394.20 | 284.07 | 1.88 | 8.00 | 537 | 17 | Dec00 | |
| J10195749 | 162.50 | 1039.40 | 283.83 | 0.67 | 6.94 | 366 | 10 | Dec00 | |
| J10205921 | 1238.30 | 80.00 | 284.71 | 1.94 | 2.09 | 60 | 14 | Dec99 | |
| J10436116 | 288.60 | 449.20 | 288.22 | 2.10 | 9.46 | 257 | 23 | Dec99 | |
| J10454509 | 7.47 | 58.15 | 280.85 | 12.25 | 1.96 | 83 | 18 | Dec99 | |
| J10465813 | B104457 | 369.43 | 125.20 | 287.07 | 0.73 | 4.37 | 125 | 10 | Feb03 |
| J10476709 | 198.45 | 116.16 | 291.31 | 7.13 | 2.88 | 73 | 3 | Dec99 | |
| J10495833 | 2202.33 | 446.80 | 287.62 | 0.64 | 7.64 | 359 | 11 | Dec99 | |
| J10545943 | 346.91 | 330.70 | 288.72 | 0.10 | 5.78 | 46 | 34 | Dec99 | |
| J11036025 | 396.59 | 275.90 | 289.99 | 0.29 | 4.99 | 569 | 7 | Dec00 | |
| J11105637 | B110756 | 558.25 | 262.56 | 289.27 | 3.53 | 5.62 | 426 | 11 | Dec99 |
| J11126103 | 64.96 | 599.10 | 291.22 | 0.46 | 12.24 | 242 | 15 | Dec00 | |
| J11126613 | B111065 | 334.21 | 249.30 | 293.19 | 5.23 | 6.48 | 94 | 18 | Dec99 |
| J11164122 | B111441 | 943.16 | 40.53 | 284.45 | 18.06 | 1.47 | 37 | 13 | Dec00 |
| J11176154 | 505.10 | 493.60 | 292.10 | 1.02 | 8.91 | 622 | 10 | Dec99 | |
| J11196127 | 407.75 | 707.40 | 292.15 | 0.53 | 17.14 | 832 | 6 | Dec00 | |
| J11215444 | B111954 | 535.78 | 204.70 | 290.08 | 5.87 | 5.17 | 42 | 9 | Feb03 |
| J11236102 | 640.23 | 439.40 | 292.50 | 0.04 | 7.85 | 244 | 8 | Dec99 | |
| J11236259 | 271.43 | 223.26 | 293.18 | 1.78 | 4.28 | 54 | 10 | Dec99 | |
| J11246421 | 479.10 | 298.00 | 293.74 | 3.03 | 6.66 | 1102 | 98 | Dec00 | |
| J11266054 | B112460 | 202.74 | 280.27 | 292.83 | 0.29 | 5.31 | 41 | 16 | Dec00 |
| J11336250 | B113162 | 1022.87 | 567.80 | 294.21 | 1.29 | 12.10 | 880 | 24 | Dec00 |
| J11376700 | 556.22 | 228.04 | 295.79 | 5.16 | 5.70 | 1 | 13 | Dec99 | |
| J11386207 | 117.56 | 519.80 | 294.50 | 0.46 | 9.65 | 594 | 18 | Dec00 | |
| J11413107 | 538.43 | 30.77 | 285.74 | 29.39 | 1.21 | 60 | 30 | Dec00 | |
| J11413322 | 291.47 | 46.45 | 286.58 | 27.27 | 1.91 | 33 | 14 | Dec00 | |
| J11416545 | 393.90 | 116.05 | 295.79 | 3.86 | 2.47 | 84 | 2 | Feb03 | |
| J11466030 | B114360 | 273.37 | 112.80 | 294.97 | 1.34 | 2.35 | 10 | 17 | Dec00 |
| J11576224 | B115462 | 400.52 | 325.20 | 296.70 | 0.19 | 6.31 | 510 | 2 | Dec00 |
| J11596409 | 667.49 | 178.00 | 297.29 | 1.86 | 3.41 | 259 | 13 | Dec00 | |
| J11597910 | 525.07 | 59.24 | 300.41 | 16.55 | 1.91 | 11 | 9 | Dec99 | |
| J12116324 | 433.08 | 333.80 | 298.47 | 0.88 | 6.96 | 120 | 9 | Dec00 | |
| J12246208 | 585.76 | 454.20 | 299.81 | 0.56 | 10.01 | 80 | 7 | Dec00 | |
| J12246407 | B122163 | 216.48 | 96.90 | 299.98 | 1.41 | 3.14 | 6 | 3 | Dec99 |
| J12256408 | B122263 | 419.62 | 416.00 | 300.13 | 1.41 | 10.46 | 356 | 23 | Dec00 |
| J12316303 | 1351.24 | 301.00 | 300.64 | 0.27 | 6.88 | 390 | 18 | Dec00 | |
| J12396832 | B123668 | 1301.92 | 94.30 | 301.88 | 5.69 | 2.15 | 49 | 10 | Feb03 |
| J12526314 | 823.34 | 278.40 | 303.07 | 0.37 | 5.27 | 330 | 19 | Dec99 | |
| J13016305 | 184.53 | 374.00 | 304.10 | 0.24 | 6.65 | 665 | 31 | Dec00 | |
| J13056203 | 427.76 | 470.00 | 304.56 | 0.77 | 8.51 | 436 | 15 | Dec00 | |
| J13066617 | B130366 | 473.03 | 436.90 | 304.46 | 3.46 | 12.38 | 387 | 10 | Dec00 |
| J13076318 | 4962.43 | 374.00 | 304.78 | 0.49 | 6.62 | 136 | 23 | Dec00 | |
| J13126400 | 2437.43 | 93.00 | 305.19 | 1.23 | 1.94 | 40 | 30 | Dec00 | |
| J13125402 | B130953 | 728.15 | 133.00 | 305.99 | 8.70 | 3.42 | 143 | 20 | Feb03 |
| J13176302 | 261.27 | 678.10 | 305.90 | 0.32 | 12.06 | 504 | 8 | Dec00 | |
| J13226241 | 506.06 | 618.80 | 306.48 | 0.04 | 10.23 | 83 | 14 | Dec99 | |
| J13246146 | 844.11 | 828.00 | 306.85 | 0.85 | 10.12 | 1546 | 29 | Dec99 | |
| J13266700 | B132266 | 543.01 | 209.60 | 306.31 | 4.37 | 4.81 | 47 | 1 | Feb03 |
| J13276222 | B132362 | 529.91 | 318.40 | 307.07 | 0.20 | 5.50 | 306 | 8 | Dec99 |
| J13276301 | B132362 | 196.48 | 294.91 | 306.96 | 0.42 | 5.26 | 96 | 12 | Dec00 |
| J13276400 | 280.68 | 680.90 | 306.83 | 1.40 | 15.49 | 141 | 58 | Dec00 | |
| J13345839 | 107.72 | 119.30 | 308.52 | 3.74 | 2.41 | 54 | 7 | Dec99 | |
| J13416023 | 627.29 | 364.60 | 309.03 | 1.88 | 7.04 | 688 | 23 | Dec00 | |
| J13456115 | 1253.08 | 278.10 | 309.41 | 0.92 | 4.98 | 61 | 2 | Dec99 | |
| J13475947 | 609.96 | 293.40 | 309.91 | 2.31 | 5.82 | 548 | 6 | Dec00 | |
| J13496130 | 259.36 | 284.60 | 309.81 | 0.58 | 4.98 | 380 | 13 | Dec99 | |
| J13505115 | 295.70 | 90.39 | 312.23 | 10.54 | 2.28 | 2 | 22 | Dec99 | |
| J13555153 | B135251 | 644.30 | 112.10 | 312.95 | 9.71 | 2.83 | 55 | 6 | Feb03 |
| J13556206 | 276.60 | 547.00 | 310.33 | 0.15 | 8.28 | 474 | 6 | Dec00 | |
| J13565521 | 507.38 | 174.17 | 312.19 | 6.33 | 4.19 | 150 | 22 | Dec00 | |
| J13566230 | B135362 | 455.77 | 417.30 | 310.41 | 0.58 | 6.61 | 586 | 5 | Dec99 |
| J13576429 | 166.07 | 129.30 | 309.92 | 2.51 | 2.51 | 54 | 13 | Dec00 | |
| J14036310 | 399.17 | 305.00 | 310.92 | 1.42 | 5.44 | 709 | 21 | Dec00 | |
| J14065806 | 288.35 | 229.00 | 312.67 | 3.35 | 4.79 | 153 | 4 | Feb03 | |
| J14066121 | 213.07 | 542.30 | 311.84 | 0.20 | 8.15 | 880 | 60 | Dec00 | |
| J14126145 | 315.23 | 514.70 | 312.32 | 0.36 | 7.82 | 39 | 20 | Dec00 | |
| J14136141 | 285.62 | 677.00 | 312.46 | 0.33 | 10.14 | 35 | 10 | Dec00 | |
| J14136222 | 292.41 | 808.10 | 312.24 | 0.98 | 15.51 | 490 | 8 | Dec99 | |
| J14136307 | 394.95 | 121.98 | 312.05 | 1.71 | 2.34 | 45 | 9 | Dec99 | |
| J14166037 | 295.58 | 289.20 | 313.17 | 0.53 | 4.84 | 336 | 7 | Dec99 | |
| J14205416 | B141754 | 935.77 | 129.60 | 315.79 | 6.36 | 2.88 | 1 | 9 | Feb03 |
| J14206048 | 68.18 | 360.00 | 313.54 | 0.22 | 5.63 | 110 | 16 | Dec00 | |
| J14245822 | 366.73 | 323.90 | 314.89 | 2.31 | 6.21 | 625 | 19 | Dec99 | |
| J14525851 | 386.62 | 262.40 | 318.08 | 0.39 | 4.30 | 47 | 7 | Dec00 | |
| J14526036 | 154.99 | 349.70 | 317.29 | 1.16 | 5.79 | 10 | 5 | Dec99 | |
| J15025828 | 668.11 | 584.00 | 319.40 | 0.13 | 8.16 | 362 | 7 | Feb03 | |
| J15074352 | B150443 | 286.76 | 48.70 | 327.33 | 12.45 | 1.34 | 33 | 4 | Dec99 |
| J15104422 | B150744 | 943.87 | 84.00 | 327.59 | 11.73 | 2.14 | 8 | 8 | Feb03 |
| J15125759 | B150857 | 128.69 | 628.70 | 320.77 | 0.10 | 7.35 | 513 | 16 | Dec99 |
| J15135739 | 973.46 | 469.70 | 321.09 | 0.10 | 6.45 | 261 | 13 | Dec99 | |
| J15305327 | 278.96 | 49.60 | 325.32 | 2.34 | 1.23 | 19 | 21 | Dec99 | |
| J15315610 | 84.20 | 110.90 | 323.89 | 0.03 | 2.09 | 50 | 20 | Dec00 | |
| J15345405 | B153053 | 289.69 | 190.82 | 325.46 | 1.48 | 3.37 | 46 | 17 | Dec00 |
| J15365433 | 881.44 | 147.50 | 325.37 | 0.98 | 2.71 | 155 | 13 | Dec99 | |
| J15405736 | 612.92 | 304.50 | 324.10 | 1.89 | 5.07 | 414 | 15 | Dec00 | |
| J15415535 | 295.84 | 428.00 | 325.42 | 0.33 | 5.74 | 256 | 13 | Dec00 | |
| J15435459 | 377.12 | 345.70 | 326.02 | 0.04 | 4.84 | 28 | 23 | Dec00 | |
| J15465302 | 580.84 | 287.00 | 327.47 | 1.30 | 5.20 | 1135 | 90 | Dec00 | |
| J15485607 | 170.93 | 315.50 | 325.85 | 1.35 | 4.86 | 37 | 10 | Dec00 | |
| J15505242 | 749.66 | 337.70 | 328.14 | 1.19 | 6.63 | 440 | 25 | Dec00 | |
| J15565358 | 994.68 | 436.00 | 328.11 | 0.43 | 6.31 | 153 | 16 | Dec99 | |
| J16005751 | B155657 | 194.45 | 176.55 | 325.97 | 3.70 | 3.49 | 131 | 8 | Feb03 |
| J16015335 | 288.46 | 194.60 | 328.93 | 0.62 | 4.55 | 157 | 35 | Dec00 | |
| J16032531 | 283.07 | 53.76 | 348.37 | 19.98 | 1.87 | 15 | 4 | Dec00 | |
| J16037202 | 14.84 | 38.05 | 316.63 | 14.49 | 1.17 | 30 | 6 | Dec00 | |
| J16105006 | 481.12 | 416.00 | 332.27 | 1.05 | 7.54 | 756 | 23 | Dec99 | |
| J16105303 | 786.47 | 380.10 | 330.21 | 1.06 | 6.74 | 335 | 30 | Dec00 | |
| J16114949 | 666.44 | 556.80 | 332.59 | 1.14 | 9.52 | 405 | 22 | Dec99 | |
| J16115209 | B160752 | 182.49 | 128.20 | 330.92 | 0.48 | 4.35 | 72 | 6 | Dec99 |
| J16134714 | B160947 | 382.38 | 161.20 | 334.57 | 2.84 | 3.69 | 138 | 7 | Feb03 |
| J16145048 | B161050 | 231.69 | 582.80 | 332.21 | 0.17 | 7.94 | 451 | 2 | Feb03 |
| J16155444 | 360.96 | 312.60 | 329.57 | 2.76 | 5.70 | 232 | 28 | Dec00 | |
| J16184723 | 203.55 | 134.70 | 335.04 | 2.18 | 2.99 | 39 | 4 | Feb03 | |
| J16232631 | B162026 | 11.08 | 62.86 | 350.97 | 15.96 | 1.80 | 8 | 20 | Dec00 |
| J16234256 | B162042 | 364.59 | 295.00 | 338.89 | 4.62 | 6.58 | 15 | 8 | Feb03 |
| J16234949 | 725.73 | 183.30 | 334.00 | 0.21 | 3.57 | 42 | 7 | Dec00 | |
| J16254048 | 2355.28 | 145.00 | 340.60 | 5.93 | 3.14 | 7 | 15 | Dec00 | |
| J16284804 | 865.97 | 952.00 | 335.76 | 0.46 | 9.79 | 431 | 43 | Dec00 | |
| J16304719 | 559.07 | 489.60 | 336.49 | 0.78 | 5.79 | 339 | 10 | Dec00 | |
| J16304733 | B162647 | 575.97 | 498.00 | 336.40 | 0.56 | 5.65 | 338 | 8 | Dec00 |
| J16324818 | 813.45 | 758.00 | 336.08 | 0.20 | 7.77 | 515 | 39 | Dec00 | |
| J16334453 | B163044 | 436.51 | 475.40 | 338.72 | 1.98 | 7.12 | 139 | 17 | Dec00 |
| J16354944 | 671.96 | 474.00 | 335.39 | 1.57 | 6.62 | 23 | 15 | Dec00 | |
| J16374553 | B163445 | 118.77 | 193.23 | 338.47 | 0.76 | 3.16 | 12 | 4 | Dec99 |
| J16374642 | 154.03 | 417.00 | 337.78 | 0.31 | 5.08 | 13 | 18 | Dec00 | |
| J16384608 | 278.14 | 424.30 | 338.34 | 0.54 | 5.18 | 335 | 12 | Dec00 | |
| J16394359 | 587.56 | 258.90 | 340.02 | 1.87 | 4.02 | 129 | 18 | Dec00 | |
| J16394604 | B163545 | 264.56 | 259.00 | 338.50 | 0.45 | 3.76 | 60 | 30 | Dec00 |
| J16404715 | B163647 | 517.40 | 592.00 | 337.71 | 0.43 | 6.48 | 398 | 22 | Dec99 |
| J16431224 | 4.62 | 62.41 | 5.66 | 21.21 | 2.41 | 263 | 15 | Dec00 | |
| J16444559 | B164145 | 455.06 | 478.80 | 339.19 | 0.20 | 5.09 | 617 | 1 | Feb03 |
| J16464346 | B164343 | 231.60 | 490.00 | 341.10 | 0.96 | 5.79 | 62 | 7 | Dec00 |
| J16484611 | 164.95 | 392.90 | 339.43 | 0.79 | 4.96 | 682 | 26 | Dec00 | |
| J16494349 | 870.71 | 398.60 | 341.36 | 0.59 | 5.02 | 759 | 17 | Dec00 | |
| J16504502 | 380.87 | 319.70 | 340.55 | 0.35 | 4.42 | 130 | 10 | Dec00 | |
| J16514246 | B164842 | 844.08 | 525.00 | 342.45 | 0.92 | 6.35 | 154 | 5 | Dec00 |
| J16533838 | B165038 | 305.04 | 207.20 | 345.87 | 3.26 | 3.66 | 74 | 6 | Dec99 |
| J16534249 | 612.56 | 416.10 | 342.63 | 0.62 | 5.24 | 25 | 17 | Dec99 | |
| J17013726 | B165837 | 2454.61 | 303.40 | 347.75 | 2.83 | 5.17 | 602 | 8 | Dec99 |
| J17014533 | B165745 | 322.91 | 526.00 | 341.36 | 2.17 | 9.71 | 17 | 13 | Dec00 |
| J17034851 | 1396.40 | 150.29 | 338.98 | 4.51 | 2.99 | 4 | 24 | Dec00 | |
| J17053423 | 255.43 | 146.36 | 350.72 | 3.97 | 2.85 | 44 | 8 | Dec00 | |
| J17054108 | 861.07 | 1077.00 | 345.29 | 0.04 | 11.43 | 916 | 15 | Dec99 | |
| J17083426 | 692.11 | 190.70 | 351.08 | 3.40 | 3.56 | 176 | 15 | Dec00 | |
| J17153903 | 278.48 | 313.10 | 348.10 | 0.32 | 4.11 | 250 | 15 | Dec00 | |
| J17173425 | B171434 | 656.30 | 587.70 | 352.12 | 2.02 | 9.98 | 191 | 14 | Dec00 |
| J17174043 | 397.86 | 452.60 | 347.01 | 1.69 | 6.28 | 993 | 17 | Dec99 | |
| J17183825 | 74.67 | 247.40 | 348.95 | 0.43 | 3.60 | 113 | 10 | Dec00 | |
| J17194006 | B171540 | 189.09 | 386.60 | 347.65 | 1.53 | 5.13 | 234 | 31 | Dec00 |
| J17201633 | B171716 | 1565.60 | 44.83 | 7.37 | 11.54 | 1.34 | 12 | 13 | Feb03 |
| J17203659 | 351.12 | 381.60 | 350.33 | 0.10 | 4.59 | 99 | 7 | Dec00 | |
| J17223632 | B171836 | 399.18 | 416.20 | 350.93 | 0.00 | 4.35 | 307 | 8 | Dec99 |
| J17233659 | 202.72 | 254.20 | 350.68 | 0.40 | 3.54 | 219 | 11 | Dec00 | |
| J17303350 | B172733 | 139.46 | 258.00 | 354.13 | 0.09 | 3.54 | 132 | 10 | Dec00 |
| J17333716 | B173037 | 337.59 | 155.10 | 351.57 | 2.28 | 2.80 | 330 | 6 | Dec00 |
| J17383211 | B173532 | 768.50 | 49.59 | 356.46 | 0.49 | 1.20 | 7 | 9 | Dec00 |
| J17392903 | B173629 | 322.88 | 138.56 | 359.20 | 1.06 | 2.47 | 236 | 18 | Dec00 |
| J17393023 | 114.37 | 170.00 | 358.08 | 0.33 | 2.91 | 74 | 18 | Dec00 | |
| J17413927 | B173739 | 512.21 | 158.50 | 350.55 | 4.74 | 3.21 | 204 | 6 | Dec00 |
| J17433150 | B174031 | 2414.58 | 193.05 | 357.29 | 1.14 | 3.31 | 240 | 12 | Dec00 |
| J17503157 | B174731 | 910.36 | 206.34 | 357.98 | 2.51 | 3.82 | 111 | 8 | Dec00 |
| J17572421 | B175424 | 234.10 | 179.44 | 5.28 | 0.05 | 4.40 | 9 | 9 | Dec99 |
| J17592205 | B175622 | 460.97 | 177.16 | 7.47 | 0.81 | 3.57 | 1 | 10 | Dec99 |
| J18012451 | B175724 | 124.92 | 289.00 | 5.25 | 0.88 | 5.22 | 637 | 12 | Dec00 |
| J18082057 | B180520 | 918.41 | 606.80 | 9.44 | 0.40 | 7.61 | 93 | 11 | Dec00 |
| J18091917 | 82.75 | 197.10 | 11.09 | 0.08 | 3.55 | 130 | 12 | Dec00 | |
| J18092109 | B180621 | 702.41 | 381.91 | 9.41 | 0.72 | 5.23 | 256 | 24 | Dec00 |
| J18093547 | 860.39 | 193.84 | 356.54 | 7.76 | 5.39 | 379 | 18 | Dec99 | |
| J18173837 | 384.49 | 102.85 | 354.67 | 10.40 | 2.51 | 89 | 6 | Dec99 | |
| J18181422 | B181514 | 291.49 | 622.00 | 16.40 | 0.61 | 7.15 | 1168 | 13 | Dec00 |
| J18181519 | 939.69 | 845.00 | 15.55 | 0.19 | 9.55 | 1157 | 23 | Dec00 | |
| J18201346 | B181713 | 921.46 | 776.70 | 17.16 | 0.48 | 8.83 | 893 | 12 | Dec00 |
| J18201818 | B181718 | 309.90 | 436.00 | 13.20 | 1.72 | 7.04 | 60 | 24 | Dec00 |
| J18224209 | 456.51 | 72.51 | 351.88 | 12.82 | 1.86 | 13 | 9 | Dec99 | |
| J18230154 | 759.78 | 135.87 | 28.08 | 5.25 | 3.62 | 153 | 24 | Dec00 | |
| J18231115 | B182011 | 279.83 | 428.59 | 19.76 | 0.94 | 5.59 | 354 | 10 | Dec00 |
| J18241118 | B182111 | 435.76 | 603.00 | 19.80 | 0.74 | 7.09 | 213 | 17 | Dec00 |
| J18241159 | 362.49 | 463.40 | 19.25 | 0.32 | 5.56 | 407 | 15 | Dec00 | |
| J18270934 | 512.55 | 259.20 | 21.72 | 0.84 | 4.19 | 386 | 24 | Dec00 | |
| J18350643 | B183206 | 305.83 | 472.90 | 25.09 | 0.55 | 6.21 | 62 | 38 | Dec99 |
| J18450434 | B184204 | 486.75 | 230.80 | 28.19 | 0.79 | 5.07 | 248 | 10 | Feb03 |
| J18560113 | B185301 | 267.44 | 96.79 | 34.56 | 0.49 | 3.30 | 140 | 30 | Dec00 |
| J18570057 | B185400 | 356.93 | 82.39 | 34.41 | 0.80 | 2.79 | 79 | 26 | Dec00 |
| J18570212 | B185502 | 415.82 | 506.77 | 35.61 | 0.39 | 7.98 | 423 | 21 | Dec00 |
| J18570943 | B185509 | 5.36 | 13.31 | 42.29 | 3.06 | 0.91 | 53 | 9 | Dec00 |
| J19010156 | B185901 | 288.22 | 105.39 | 35.81 | 1.36 | 2.79 | 122 | 9 | Dec00 |
| J19040004 | 139.52 | 233.61 | 34.45 | 2.81 | 5.74 | 306 | 9 | Dec00 | |
| J19151606 | B191316 | 59.03 | 168.77 | 49.96 | 2.12 | 5.90 | 430 | 73 | Dec00 |
| J19462913 | B194329 | 959.45 | 44.31 | 11.10 | 24.12 | 1.54 | 28 | 10 | Dec99 |
| J20383816 | 1577.29 | 33.96 | 3.85 | 36.74 | 1.36 | 68 | 18 | Dec00 | |
| J20537200 | B204872 | 341.34 | 17.30 | 321.87 | 34.99 | 0.48 | 15 | 9 | Dec99 |
| J21243358 | 4.93 | 4.62 | 10.92 | 45.43 | 0.27 | 5 | 2 | Dec00 | |
| J21295721 | 3.73 | 31.86 | 338.00 | 43.57 | 1.36 | 30 | 5 | Dec00 | |
| J21450750 | 16.05 | 9.00 | 47.77 | 42.08 | 0.57 | 12 | 6 | Dec00 | |
| J22480101 | 477.23 | 29.05 | 69.25 | 50.62 | 1.65 | 33 | 12 | Dec00 | |
| J23246054 | B232161 | 2347.49 | 16.00 | 320.42 | 53.17 | 0.69 | 11 | 8 | Dec00 |
| J23302005 | B232720 | 1643.62 | 8.46 | 49.39 | 70.19 | 0.39 | 30 | 7 | Dec00 |
| PSR J | PSR B | RM | Prev. RM | Ref. | Prev. RM | Ref. |
| (rad m-2) | (rad m-2) | (rad m-2) | ||||
| J01081431 | 11 | 13 | 1 | |||
| J02555304 | B025453 | 353 | 1012 | 1 | ||
| J06302834 | B062828 | 46.61.3 | 46.20.1 | 2 | 45.70.5 | 3 |
| J07384042 | B073640 | 112 | 13.50.4 | 2 | 14.50.7 | 3 |
| J08094753 | B080847 | 1055 | 10020 | 4 | 974 | 5 |
| J11126613 | B111065 | 9418 | 37050 | 4 | ||
| J11164122 | B111441 | 3713 | 5540 | 3 | 3116 | 1 |
| J11196127 | 8326 | 84223 | 6 | |||
| J11416545 | 842 | 863 | 7 | |||
| J11466030 | B114360 | 1017 | 3020 | 4 | ||
| J11576224 | B115462 | 5102 | 508.20.5 | 2 | ||
| J12246407 | B122163 | 63 | 0.5 | 2 | ||
| J14206048 | 11016 | 10618 | 8 | |||
| J16145048 | B161050 | 4512 | 56060 | 5 | ||
| J16444559 | B164145 | 6171 | 6112 | 3 | ||
| J16464346 | B164343 | 627 | 17 | 9 | ||
| J17014533 | B165745 | 1713 | 6030 | 5 | ||
| J17303350 | B172733 | 13210 | 05 | 9 | ||
| J17413927 | B173739 | 2046 | 22129 | 3 | 18014 | 1 |
| J17572421 | B175424 | 99 | 012∗ | 10 | ||
| J17592205 | B175622 | 110 | 67 | 10 | ||
| J18570057 | B185400 | 7926 | 10419 | 11 | ||
| J19462913 | B194329 | 2810 | 87 | 1 | ||
| J20383816 | 6818 | 3015 | 1 | |||
| J20537200 | B204872 | 159 | 17.01.0 | 5 | 94 | 1 |
| J23246054 | B232161 | 118 | 39.06.0 | 5 | ||
| J23302005 | B232720 | 307 | 9.50.2 | 2 | 163 | 10 |
| References: 1: Han et al. (1999); 2: Hamilton et al. (1981); 3: van Ommen et al. (1997); 4: Costa et al. (1991); 5: Qiao et al. (1995); 6: Crawford & Keim (2003); 7: Kaspi et al. (2000); 8: Roberts et al. (2001); 9: Crawford et al. (2001); 10: Hamilton & Lyne (1987); 11: Weisberg et al. (2004). ∗ Note: see text. | ||||||