The Anomalous Early Afterglow of GRB 050801
Abstract
The ROTSE-IIIc telescope at the H.E.S.S. site, Namibia, obtained the earliest detection of optical emission from a Gamma-Ray Burst (GRB), beginning only 21.8 s from the onset of Swift GRB 050801. The optical lightcurve does not fade or brighten significantly over the first s, after which there is an achromatic break and the lightcurve declines in typical power-law fashion. The Swift/XRT also obtained early observations starting at 69 s after the burst onset. The X-ray lightcurve shows the same features as the optical lightcurve. These correlated variations in the early optical and X-ray emission imply a common origin in space and time. This behavior is difficult to reconcile with the standard models of early afterglow emission.
Subject headings:
gamma rays:bursts1. Introduction
Gamma-ray bursts (GRBs) are the most luminous explosions in the universe, but the origin of their emission remains elusive. With the launch of the Swift -ray Burst Explorer (Gehrels et al., 2004) in late 2004, great progress has been made in the study of the early afterglow phase of GRBs. However, only a small number of bursts have been imaged simultaneously in both the optical and X-ray bands in the first minutes after the burst (Nousek et al., 2005; Quimby et al., 2005; Rykoff et al., 2005a; Blustin et al., 2005a).
In this letter, we report on the earliest detection of optical emission, starting at 21.8 seconds after the onset of GRB 050801 with the ROTSE-IIIc (Robotic Optical Transient Search Experiment) telescope located at the H.E.S.S. site in Namibia. This is the most densely sampled early lightcurve yet obtained. It does not fade or brighten significantly over the first seconds, after which there is a break and the lightcurve declines in a typical power-law fashion. The Swift/XRT also obtained early observations starting at 69 seconds after the burst onset. The X-ray lightcurve shows the same features as the optical lightcurve. These correlated variations in the early optical and X-ray emission imply a common origin in space and time. This behavior differs from that seen in GRB 050319 (Quimby et al., 2005), GRB 050401 (Rykoff et al., 2005a), and GRB 050525a (Blustin et al., 2005a). It is difficult to explain this behavior with standard models of early afterglow emission without assuming there is continuous late time injection of energy into the afterglow.
2. Observations and Analysis
The ROTSE-III array is a worldwide network of 0.45 m robotic, automated telescopes, built for fast ( s) responses to GRB triggers from satellites such as HETE-2 and Swift. They have wide () fields of view imaged onto Marconi back-illuminated thinned CCDs, and operate without filters. The ROTSE-III systems are described in detail in Akerlof et al. (2003).
On 2005 August 01, Swift/BAT detected GRB 050801 (Swift trigger 148522) at 18:28:02.1 UT. The position was distributed as a Gamma-ray Burst Coordinates Network (GCN) notice at 18:28:16 UT, with a radius error circle. The burst had a duration of in the 15-350 keV band, and consisted of two peaks separated by around 3 seconds. The position was released during the tail end of the -ray emission (Sakamoto et al., 2005). The Swift satellite immediately slewed to the target, with the XRT beginning observations in windowed timing mode at 69 s after the start of the burst and switching to photon counting mode at 89.3 s after the trigger.
ROTSE-IIIc, at the H.E.S.S. site in Namibia, responded automatically to the GCN notice, beginning its first exposure in less than 8 s, at 18:28:23.9 UT. The automated burst response included a set of ten 5-s exposures, ten 20-s exposures, and 134 60-s exposures before the burst position dropped below our elevation limit. The first set of ten exposures were taken with subframe readout mode to allow rapid sampling (3-s readout between each 5-s exposure). Near real-time analysis of the ROTSE-III images detected a magnitude source at , (J2000.0) that was not visible on the Digitized Sky Survey red plates, which we reported via the GCN Circular e-mail exploder within 7 minutes of the burst (Rykoff et al., 2005b). No spectroscopic redshift has been reported for this GRB, although the Swift/UVOT detected the afterglow in all filters including the filter at (Blustin et al., 2005b), which implies that the redshift is . In addition, the afterglow was dimmer than 23 mag with no evidence for a bright host galaxy (Fynbo et al., 2005b).
The X-ray photometry is shown in Table 1. Time bin midpoints and durations are listed in seconds, relative to the Swift trigger time, 18:28:02 UT. The count rate is in counts/s and the flux is in , for the energy range 0.2-10 keV. The X-ray data has been corrected for a hot CCD column crossing the source as well as a nearby source away. Photon counting data from the first orbit have been corrected for pile-up. We chose a time binning that ensures a detection of at least for each time bin before corrections were applied. The gaps in the data are caused by earth occultation. There is no spectral variation across the lightcurve, and the value is consistent with the Galactic value (). The best-fit spectrum (with fixed to ) is a power law with photon index (90% confidence level). The relative errors for the fluxes are slightly larger than those for the count rate due to the additional systematic error from the conversion.
| T-mid (s) | Duration (s) | Count Rate () | Flux () |
|---|---|---|---|
| 74.1 | 10.0 | ||
| 84.1 | 10.0 | ||
| 111.8 | 45.0 | ||
| 164.3 | 60.0 | ||
| 214.3 | 40.0 | ||
| 254.3 | 40.0 | ||
| 291.8 | 35.0 | ||
| 334.3 | 50.0 | ||
| 396.8 | 75.0 | ||
| 471.8 | 75.0 | ||
| 561.8 | 105.0 | ||
| 686.8 | 145.0 | ||
| 859.3 | 200.0 | ||
| 4346.7 | 320.0 | ||
| 4856.7 | 700.0 | ||
| 5715.3 | 510.0 | ||
| 6357.8 | 775.0 | ||
| 11249.6 | 2560.0 | ||
| 17040.6 | 2550.0 | ||
| 22814.0 | 2575.0 | ||
| 31556.0 | 8237.1 | ||
| 47812.8 | 17585.3 | ||
| 366425.9 | 515983.6 |
Note. — Time bin midpoints and durations are relative to the Swift trigger time, 18:28:02 UT.
The optical photometry is shown in Table 2. The ROTSE-IIIa images were bias-subtracted and flat-fielded by our automated pipeline. The flat-field image was generated from 30 twilight images. We used SExtractor (Bertin & Arnouts, 1996) to perform the initial object detection and to determine the centroid positions of the stars. The images were processed with our custom RPHOT photometry program based on the DAOPHOT PSF-fitting photometry package (Quimby et al., 2005). The unfiltered thinned ROTSE-III CCDs have a peak response similar to an -band filter. The magnitude zero-point for was calculated from the median offset of the fiducial reference stars to the USNO B1.0 -band measurements to produce magnitudes. After the first 30 images, frames were co-added in logarithmic time bins to maintain roughly constant signal-to-noise.
| 21.8 | 26.8 | |
| 29.9 | 34.9 | |
| 38.0 | 43.0 | |
| 46.1 | 51.1 | |
| 54.2 | 59.2 | |
| 62.4 | 67.4 | |
| 70.5 | 75.5 | |
| 78.6 | 83.6 | |
| 86.7 | 91.7 | |
| 94.8 | 99.8 | |
| 113.5 | 133.5 | |
| 143.3 | 163.3 | |
| 172.7 | 192.7 | |
| 203.0 | 223.0 | |
| 232.5 | 252.5 | |
| 262.3 | 282.3 | |
| 291.8 | 311.8 | |
| 321.0 | 341.0 | |
| 350.8 | 370.8 | |
| 380.3 | 400.3 | |
| 409.9 | 469.9 | |
| 479.8 | 539.8 | |
| 549.0 | 609.0 | |
| 618.2 | 678.2 | |
| 688.1 | 748.1 | |
| 757.2 | 817.2 | |
| 826.6 | 886.6 | |
| 896.3 | 956.3 | |
| 965.5 | 1025.5 | |
| 1034.9 | 1094.9 | |
| 1104.7 | 1233.9 | |
| 1243.6 | 1442.0 | |
| 1451.4 | 1650.3 | |
| 1659.7 | 1858.6 | |
| 1867.9 | 2136.8 | |
| 2146.5 | 2485.3 | |
| 2495.2 | 2832.6 | |
| 2841.9 | 3249.7 | |
| 3259.7 | 3736.8 | |
| 3745.9 | 4332.1 | |
| 4341.4 | 4956.6 | |
| 4966.5 | 5721.7 | |
| 5731.0 | 6554.7 | |
| 6564.4 | 7527.4 | |
| 7536.7 | 8619.8 | |
| 8629.6 | 10357.0 |
Note. — Start and end times are relative to the Swift trigger time, 18:28:02 UT.
3. Results
With a detection only 21.8 s after the start of the burst, this is the earliest detection of an optical counterpart of a GRB, as well as the most densely sampled early afterglow. Only four GRBs have had optical counterparts detected within the first minute, and none of these had more than two detections in the first minute. The first 250 s of the optical afterglow shows short timescale variability relative to an overall flat lightcurve. This is in stark contrast to the prompt counterpart of GRB 990123 (Akerlof et al., 1999), which had a very bright mag peak at 60 s after the burst onset, generally interpreted as the signature of reverse shock emission (Sari & Piran, 1999). This afterglow shows no evidence for reverse shock emission.
Figure 1 shows a comparison of the early optical and X-ray lightcurves of GRB 050801, combined with the prompt -ray emission. The prompt BAT -ray flux densities have been extrapolated to the X-ray band [0.2-10 keV]. This extrapolation was performed with the best-fit photon index of for the time-averaged -ray spectrum from 20-150 keV, as in Tagliaferri et al. (2005). The statistical errors scaled from the BAT count rate are shown; the gray region denotes the uncertainties from the extrapolation to the X-ray regime. The X-ray flux values have been converted to flux density (Jy) using an effective frequency of , the flux weighted average in the 0.2-10 keV range with the best-fit photon index . The ROTSE-III optical magnitudes have been converted to flux density assuming the unfiltered ROTSE-III images are equivalent to , and have been approximately adjusted for Galactic extinction by 0.24 mag (Schlegel et al., 1998). The de-extinction does not have a significant effect on the derived spectral indices. After the break at seconds, the optical lightcurve decays as , followed by a brief but significant plateau at seconds. The top panel shows the ratio of optical flux to X-ray count rate for the first 7000 s, scaled to the average ratio value. The X-ray count rate rather than the X-ray flux was used to avoid the systematic error introduced when converting from count rate to flux, and is made possible by the lack of X-ray spectral evolution. The ROTSE-III observations have been co-added to match the times of the XRT integrations as closely as possible. The flux ratio is consistent with a constant value (dashed-line) with a of 15.9 (16 degrees of freedom). The break at has no systematic change in the optical to X-ray flux ratio, and is therefore achromatic.
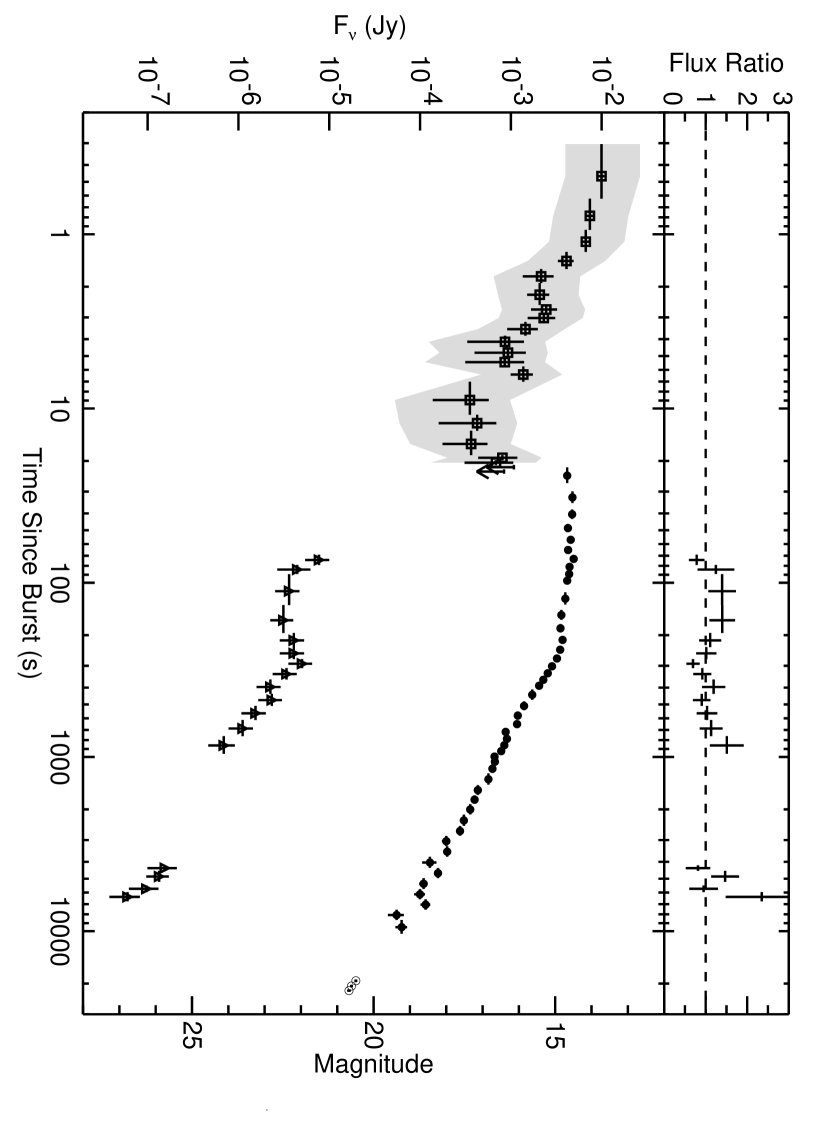
Only three -ray bursts have had prompt optical detections contemporaneous with the -ray emission. The prompt optical counterpart of GRB 041219a (Vestrand et al., 2005) was correlated with the -ray emission, implying a common origin. However, both GRB 990123 (Akerlof et al., 1999) and GRB 050401 (Rykoff et al., 2005a) demonstrated a different origin for the -rays and the optical radiation. Although we do not have a prompt optical detection in the case of GRB 050801, we can interpolate between the high energy prompt lightcurve scaled to the X-ray band (gray band in Figure 1) and the first X-ray detection. During this interval the high energy emission falls by a factor of while the optical emission is unchanged. This suggests a different origin for the prompt -ray emission and the early optical emission. However, the X-ray and optical afterglow of GRB 050801 do appear to arise from a similar origin after s. The two lightcurves are plotted in the main panel of Figure 1. Each lightcurve shows similar flat behavior at the early time, with a break around 250 s.
4. Discussion
In the standard fireball model of GRB afterglow emission, the spectral energy distribution of GRB afterglows can be fit by a broken power-law with spectral segments (for a review, see Piran (2005)). The spectral index obtained by comparing the de-extincted optical (see Figure 1) to X-ray flux density during the second XRT integration is , consistent with the X-ray only spectral index of [0.2-10 keV]. To test for evolution in the broadband spectral index, we have compared the optical and X-ray lightcurves during the first 7000 s (top panel of Figure 1). The optical to X-ray flux ratio is consistent with a constant value ( with 16 degrees of freedom). Across the break at 250 s, both and are unchanged, and therefore the break is achromatic. Furthermore, there is no evidence of a spectral change in the UVOT images (Blustin et al., 2005b), although the time resolution is insufficient to constrain the time of the break. Many X-ray lightcurves have been seen to steepen around 1000 s - 5000 s post-burst with no change in the X-ray spectral index (Nousek et al., 2005), For the few bursts with sufficient early optical and X-ray coverage (Quimby et al., 2005; Blustin et al., 2005a), this behavior has not been mirrored in the optical band.
The tight correlation between the optical and X-ray emission suggests that they share the same origin in space and time. The standard fireball model of GRB afterglows can explain the behavior of the optical and X-ray lightcurve after 250 s. The observed spectral parameters and decay indices are most consistent with a fireball expanding adiabatically into a constant density medium, with the typical synchrotron frequency below the optical band, and the cooling frequency above the X-ray band. For example, this can be produced by the following parameters: the electron energy index ; the isotropic equivalent energy at a redshift of ; the circumburst density ; the energy fraction in the electrons ; and the energy fraction in the magnetic field . These values of the electrons and magnetic energy are consistent with those deduced for other bursts albeit on the lower side. If the ejecta were expanding into a density profile (a so-called “wind” medium), the fireball model predicts a relationship between the spectral and temporal behavior that is inconsistent at the level with the observations after 250 s.
We now investigate the possible explanations of the flat early lightcurve and the origin of the break at 250 s. First, any spectral transition (e.g. crossing the optical band) would fail to explain the achromatic nature of the break. Achromatic breaks observed in other afterglows have been interpreted as geometric, when the edge of a conical jet becomes visible to the observer and the jet starts to spread (Harrison et al., 1999; Stanek et al., 1999). At 250 s, this would be the earliest such “jet break” detected. In the fireball model, the post jet break afterglow is expected to decay as , where is the electron energy index with , provided that (Sari et al., 1999). A hard electron index of predicts a post-jet decay even steeper than (Dai & Cheng, 2001). Therefore, the observed post-break temporal decay implies which predicts a significant pre-break decay (Dai & Cheng, 2001) that is inconsistent with the observed pre-break flatness as well as the observed spectral index . Therefore, the achromatic evolution of GRB 050801 cannot be explained with a jet break.
We have investigated whether the early afterglow is consistent with the predictions of a structured jet viewed off axis (Granot & Kumar, 2003). In this case, it is difficult to create a sharp early break; under such conditions, the post-break evolution should track closely with the electron energy index , which is inconsistent with observations as described above.
Such an early break at 250 s, can perhaps be explained as the onset time of the afterglow. If the reverse shock is non relativistic (as indicated by the relatively short duration of the burst, see Sari (1997)) then self similar expansion starts once the mass collected from the environment is a factor smaller than that in the ejecta:
| (1) |
A value of the initial Lorentz factor just below a hundred would therefore be consistent with an onset time of 250 s. However, it is difficult to reconcile the flat part before 250 s as the rise of the afterglow. During the onset, since the fireball is coasting with a constant Lorentz factor, the bolometric luminosity is given by , the surface area times the density. For a constant density a sharp rise is therefore expected. For a wind-like decreasing density, the lightcurve should be flat as observed. However, as stated before, a wind density profile seems inconsistent with the behavior after 250 s.
Continuous energy injection has been suggested as a source of early X-ray lightcurve flattening (Nousek et al., 2005). This injection could be observed if the initial fireball ejecta had a range of Lorentz factors, with the slower shells catching up with the decelerating afterglow (Rees & Meszaros, 1998; Sari & Mészáros, 2000). However, we require a very steady injection of energy to produce the observed lightcurve, flat for more than a decade in time. If we adopt this explanation, the afterglow must start before our first optical observation, implying an initial Lorentz factor of more than 200, and energy injection rate which is roughly constant over a decade in time, and which shuts off suddenly at 250 s.
Flat or very slowly decaying optical lightcurves have been seen in a number of other early afterglows (eg, GRB 030418 (Rykoff et al., 2004), GRB 050319 (Quimby et al., 2005), and GRB 041006 (Maeno et al., 2004; Yost et al., 2004)). Early X-ray lightcurves detected by Swift are typically more complex, with rapidly fading sections and short timescale flares (Nousek et al., 2005). The early afterglow of GRB 050801, flat in both optical and X-rays, is, so far, unique. It is inconsistent with the standard fireball model for early afterglow emission, unless continuous energy injection is involved. Further Swift prompt GRB detections, combined with rapid follow-up by Swift and ground-based telescopes, will provide further opportunities to explore the origin of this type of early afterglow behavior.
References
- Akerlof et al. (1999) Akerlof, C., et al. 1999, Nature, 398, 400
- Akerlof et al. (2003) Akerlof, C. W., et al. Jan. 2003, PASP, 115, 132
- Bertin & Arnouts (1996) Bertin, E. & Arnouts, S. June 1996, A&AS, 117, 393
- Blustin et al. (2005a) Blustin, A. J., et al. July 2005, arXiv:astro-ph/0507515
- Blustin et al. (2005b) Blustin, A. J., Band, D., Hunsberger, S., Gronwall, C., Carter, M., & Smith, P. 2005, GCN Circ. No. 3733
- Dai & Cheng (2001) Dai, Z. G. & Cheng, K. S. Sept. 2001, ApJ, 558, L109
- Fynbo et al. (2005a) Fynbo, J. P. U., Jensen, B. L., Hjorth, J., Woller, K. G., Watson, D., Fouque, P., & Andersen, M. I. 2005, GCN Circ. No. 3736
- Fynbo et al. (2005b) Fynbo, J. P. U., Jensen, B. L., Hjorth, J., Woller, K. G., Watson, D., Sollerman, J., Fouque, P., & Andersen, M. I. 2005, GCN Circ. No. 3743
- Gehrels et al. (2004) Gehrels, N., et al. Aug. 2004, ApJ, 611, 1005
- Granot & Kumar (2003) Granot, J. & Kumar, P. July 2003, ApJ, 591, 1086
- Harrison et al. (1999) Harrison, F. A., et al. Oct. 1999, ApJ, 523, L121
- Maeno et al. (2004) Maeno, S., Sonoda, E., Matsuo, Y., & Yamauchi, M. 2004, GCN Circ. No. 2772
- Nousek et al. (2005) Nousek, J. A., et al. Aug. 2005, arXiv:astro-ph/0508332
- Piran (2005) Piran, T. 2005, Reviews of Modern Physics, 76, 1143
- Quimby et al. (2005) Quimby, R. M., et al. Oct. 2005, submitted to ApJ
- Rees & Meszaros (1998) Rees, M. J. & Meszaros, P. Mar. 1998, ApJ, 496, L1+
- Rykoff et al. (2004) Rykoff, E. S., et al. Feb. 2004, ApJ, 601, 1013
- Rykoff et al. (2005a) Rykoff, E. S., et al. Oct. 2005, ApJ, 631, L121
- Rykoff et al. (2005b) Rykoff, E. S., Yost, S. A., & Rujopakarn, W. 2005, GCN Circ. No. 3723
- Sakamoto et al. (2005) Sakamoto, T., et al. 2005, GCN Circ. No. 3730
- Sari (1997) Sari, R. Nov. 1997, ApJ, 489, L37+
- Sari & Mészáros (2000) Sari, R. & Mészáros, P. May 2000, ApJ, 535, L33
- Sari & Piran (1999) Sari, R. & Piran, T. June 1999, ApJ, 517, L109
- Sari et al. (1999) Sari, R., Piran, T., & Halpern, J. P. July 1999, ApJ, 519, L17
- Schlegel et al. (1998) Schlegel, D. J., Finkbeiner, D. P., & Davis, M. June 1998, ApJ, 500, 525
- Stanek et al. (1999) Stanek, K. Z., Garnavich, P. M., Kaluzny, J., Pych, W., & Thompson, I. Sept. 1999, ApJ, 522, L39
- Tagliaferri et al. (2005) Tagliaferri, G., et al. Aug. 2005, Nature, 436, 985
- Vestrand et al. (2005) Vestrand, W. T., et al. May 2005, Nature, 435, 178
- Yost et al. (2004) Yost, S. A., Smith, D. A., Rykoff, E. S., & Swan, H. 2004, GCN Circ. No. 2776