Active Carbon and Oxygen Shell Burning Hydrodynamics
Abstract
We have simulated 2.5103 seconds of the late evolution of a star with full hydrodynamic behavior. We present the first simulations of a multiple-shell burning epoch, including the concurrent evolution and interaction of an oxygen and carbon burning shell. In addition, we have evolved a 3D model of the oxygen burning shell to sufficiently long times (300 seconds) to begin to assess the adequacy of the 2D approximation. We summarize striking new results: (1) strong interactions occur between active carbon and oxygen burning shells, (2) hydrodynamic wave motions in nonconvective regions, generated at the convective-radiative boundaries, are energetically important in both 2D and 3D with important consequences for compositional mixing, and (3) a spectrum of mixed p- and g-modes are unambiguously identified with corresponding adiabatic waves in these computational domains. We find that 2D convective motions are exaggerated relative to 3D because of vortex instability in 3D. We discuss the implications for supernova progenitor evolution and symmetry breaking in core collapse.
Subject headings:
hydrodynamics, turbulence, stars: interiors, core collapse1. Introduction
Numerical simulations of stellar evolution are generally based upon restrictive assumptions regarding dynamics (e.g., hydrostatic balance and mixing-length convection), because the dynamic timescales are so much shorter than the nuclear burning timescale. Neutrino cooling accelerates the last burning stages so that direct dynamic simulation is feasible (Bazan & Arnett, 1998; Asida & Arnett, 2000), at least for the oxygen burning shell. We are extending this work to longer evolutionary times, larger computational domains, and three dimensional flow (3D). In this letter, we summarize new results with a discussion of the hydrodynamics underlying important symmetry breaking and compositional mixing processes which may significantly affect progenitor and core-collapse supernova models. A detailed discussion of these results will appear separately; we indicate the wider implications here.
2. A Double Shell Model: Active Oxygen and Carbon Burning
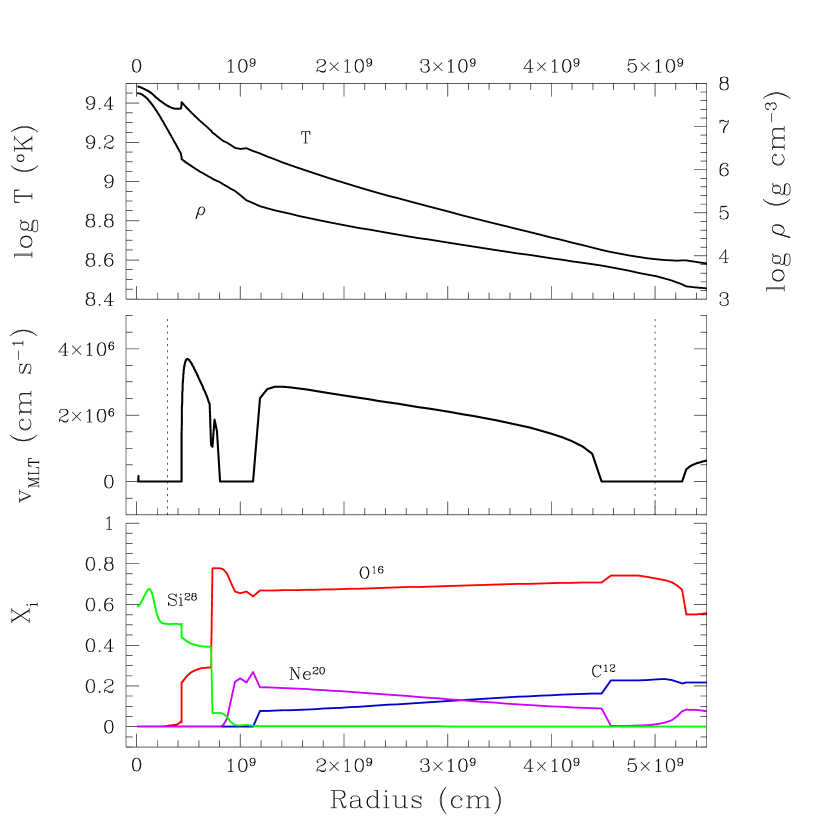
Previously we have evolved a 23 model with the one-dimensional TYCHO code to a point where oxygen and carbon are burning in concentric convective shells which overlay a silicon-rich core; details may be found in (Young & Arnett, 2005). The resultant stellar structure is presented in Figure 1. For subsequent hydrodynamic evolution we use PROMPI, a version of the PROMETHEUS direct Eulerian PPM code (Fryxell, Müller, & Arnett, 1989) that has been ported to multi-processor computing systems via domain decomposition. Our multi-dimensional calculations use the same physics as the one-dimensional TYCHO code, including nuclear reaction rates, equation of state, and radiative opacities. We use a 25 nucleus reaction network in these models, tuned to capture the oxygen and carbon burning energy generation rates to within 1% of the 177 species version used to evolve the 1D model. The 25 nucleus network contains electrons, neutrons, protons, , , , , , , , , , , , , , , , , , , , , , , , and all significant strong and weak interaction links. The reaction rates, including , are from Rauscher & Thielemann (2000).
A two dimensional model has been calculated on a wedge which is embedded in the equatorial plane of a spherical coordinate system and has radial limits which encompass both the oxygen and carbon burning convective shells. Table 1 lists some additional details of the simulated model. A three dimensional model including just the oxygen shell and bounding stable layers is partially evolved at present (300 seconds).
3. Results
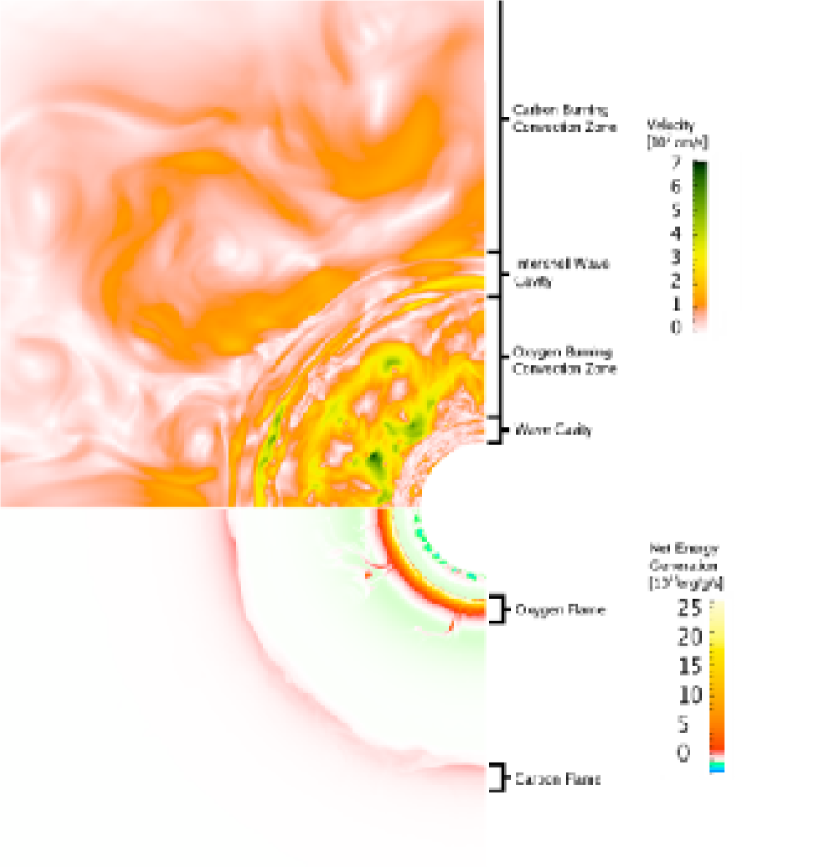
Flow Topology with Two Burning Shells. Following the readjustment of the outer boundary due to small inconsistencies in the initial 1D model, a quasi-steady state flow develops, shown in Fig.2. The top half of the figure shows the velocity magnitude; the lower shows energy generation. Velocities are significant even in the nonconvective regions, but have different morphology. The convective regions have round patterns (vortices) with occasional plumes, while the nonconvective regions have flattened patterns (mostly g-modes). The flow fluctuates strongly. New fuel is ingested from above; the oxygen flame shows “feathery” features corresponding to such fuel-rich matter flashing as it descends. This was previously seen (Bazan & Arnett, 1998; Asida & Arnett, 2000). A new feature appears in the movie version of Fig. 2, which shows a pronounced, low order distortion of the comoving coordinate, squashing and expanding the apparent circles on which carbon burning proceeds. This is due to the coupling of the two shells by waves in the nonconvective region between them. This behavior seems robust; we expect it to persist, so that at core collapse this part of the star (at least) will have significant nonspherical distortion.
| Quantity | Value |
|---|---|
| Stellar mass () … | 23 |
| Stellar age (yr) … | 2.3106 |
| Oxygen shell convective timescaleaaThese convective timescales are based on the mixing length theory velocities. (s) … | 102 |
| Carbon shell convective timescaleaaThese convective timescales are based on the mixing length theory velocities. (s) … | 103 |
| Hydro simulation time (s) … | 2.5103 |
| Inner, outer grid radius (109 cm) … | 0.3, 5.0 |
| Pressure scale heights across domain … | 9 |
| Angular extent of grid (rad) … | /2 |
| Grid zoning, nrnϕnθ… | 8003201 |
| Numer of timesteps … | 1.5106 |
Stiffness and the Source of Density Perturbations. Another asymmetry, nonspherical density perturbations, was found by Bazan & Arnett (1998); Asida & Arnett (2000). The fluctuations in density and temperature, presented in the top panel of Figure 3 as root mean square deviations from an angular mean, reach values as large as 10% and are localized at the nonconvective region just beyond the convective boundary (top panel). The fluctuations are coincident with regions where the buoyancy frequency, , is large, which can be seen in the bottom panel of Figure 3. Here, is a measure of the “stiffness” of the stratification (Turner, 1973), and is proportional to the restoring buoyancy force on perturbed stellar matter,
| (1) |
where is the gravity, and the term in parentheses is the difference between the fractional density gradient of the stellar structure and the fractional density change due to a radial (adiabatic) Lagrangian displacement. Regions where is zero are unstable to convective motions. The spikes in in our model are due to steep, stabilizing composition gradients which separate fuel from ash and lead to sharp gradients in density. Convection excites wave motions in the adjacent stable layers which give rise to the density perturbations. Similar internal wave phenomena can be observed in laboratory ice-water convection experiments where the largest temperature fluctuations are measured immediately above the convecting layer where the buoyancy frequency is large (Townsend, 1966), highlighting the generality of this phenomenon.


Resonant Modes. The underlying stellar structure determines the set of discrete resonant modes that can be excited. The narrow stable layers which bound the convective shells in our simulation, including the (truncated) core layer, are isolated enough from other wave propagation regions to act as resonating cavities. These modes are the deeper, interior counterparts to the modes observed in helio and asteroseismology studies of milder evolutionary stages.
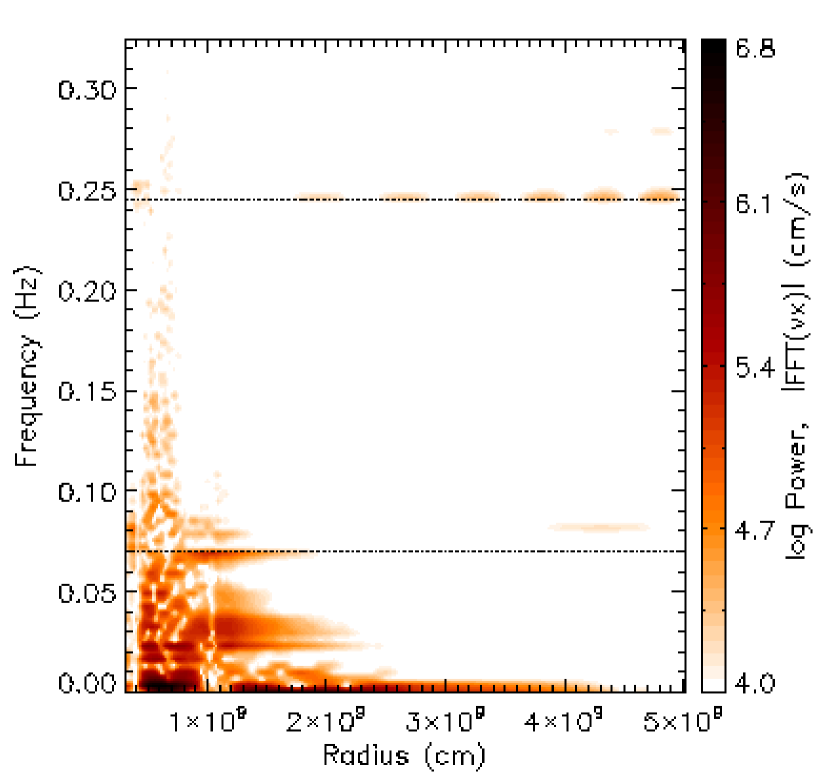
Each mode can be uniquely identified by its horizontal wavenumber index, , and its oscillation frequency, . We identify excited modes in our simulation by isolating spatial and time components of the motion through Fourier transforms. In Figure 4 we present a power spectrum at each radius in the simulation for motions with , the largest horizontal scale that can fit into the 90∘ wedge simulated. A direct comparison between modes identified in the simulation and those calculated from the linearized (non-radial) wave equation of stellar oscillations (Unno et al., 1989) is presented in the right hand panel for two modes with significant power. Although the simulation data has additional features, including “noise” in the convection zones, the mode shapes in both velocity components are strikingly similar between simulation and the wave equation; the identification is unambiguous. Gravity waves evanesce (exponentially attenuate) beyond the boundaries of the stable layers but still contain significant power in the convection zones. Acoustic waves are free to propagate in the acoustic cavity which overlaps the carbon burning convection zone.
During the late evolutionary epoch simulated here, the g-mode and p-mode propagation zones are not widely separated in radius, allowing wave modes of mixed character to couple (Unno et al., 1989). The modes in the acoustic cavity are trapped by the boundary conditions of the calculation but would otherwise propagate into the stellar envelope where they would deposit their energy through radiative damping, providing an additional channel for energy transport out of the burning region.
The good agreement of the numerical modes with the analytic modes indicates that our numerical procedures give an excellent representation of the hydrodynamics of waves, even of very low mach number. We note that anelastic codes will not reproduce the p-mode and mixed mode waves properly, as we have ascertained by direct integration of the anelastic wave equation.
Kinetic Energies and Wave Induced Mixing. During the simulations, convective motions excite waves and build up significant kinetic energy in nonconvective regions. The integrated kinetic energies are in the inner nonconvective region, in the oxygen burning convective shell, in the intermediate nonconvective region, and in the carbon burning shell. The kinetic energy is small in the outer stable region, but is still increasing by the end of the simulation.
In our simulations, the importance of the excited g-modes in the stable layers lies primarily in the role they play in mediating mixing at the convective boundaries and in the stably stratified layers. We identify a cycle in which kinetic energy builds up in the stable layer until the underlying wave modes reach non-linear amplitudes, breakdown and drive mixing. This process is analogous to the physical picture which underlies semiconvective mixing (Stevenson, 1979; Langer et al., 1983; Spruit, 1992) but is driven on a hydrodynamic rather than a thermal timescale. The growth time for the fastest growing modes in our simulation is 200 seconds and leads to an average migration speed of outer oxygen shell boundary of 4104 cm s-1, entraining mass into the convection zone at a rate of 10-4 M⊙ s-1, significantly affecting the evolution. Identifying the spectrum of excited modes in numerical simulations, including amplitudes and waveforms, provides guidance for developing and testing a quantitative model of this mixing mechanism. An important parameter controlling the boundary entrainment rate is the gradient Richardson number such that steeper density (and composition gradients) will lead to lower mixing rates so that sharp gradients are expected to form and persist (Peltier, 2003; Alexakis et al., 2004). In addition to the mixing associated with wave-breaking, enhanced compositional diffusion can be driven by the presence of the oscillatory flow setup by g-modes (Press & Rybicki, 1981; Knobloch & Merryfield, 1992). It has been demonstrated that the structure of presupernova iron cores is very sensitive to how mixing is handled at convective boundaries with significant implications for both the explosion mechanism and nucleosynthetic yields (e.g. Woosley & Weaver, 1988). If the amplitudes of the wave motions identified in our simulations remain robust to the numerical limitations (e.g., resolution, domain size) then neglecting the mixing processes associated with these waves constitutes a large source of error in progenitor models.
4. Discussion
Differences in 2D and 3D. While these 2D simulations allow us to see the interaction of carbon and oxygen shells, and show wave generation at convective boundaries, they impose an unphysical symmetry on the problem. Our 3D simulations have only been carried to seconds of stellar time, but show that the wave generation is a robust result. The flow in the convection zones, however, are qualitatively different between the 2D and 3D models: the 2D flow is dominated by vortices which span the convection zone, while the 3D flow is characterized by smaller scale plumes. Quantitatively, the amplitude of the 2D convective motions are larger than the 3D by a factor of 8, while the 3D motions are larger than mixing length values by a factor of 1.5. Two-dimensional simulations of gravitational collapse will be misleading at least to the extent that convective motions are important.
Presupernova Models. Perhaps the most important impact that internal waves have on stellar structure in the late stages of massive star evolution is the degree to which they drive compositional mixing. In our simulations internal wave modes grow to non-linear amplitudes and mix material at convective boundaries on a hydrodynamical timescale. Given the strong dependence of presupernova structure on the rate at which mixing occurs at convective boundaries we see the incorporation of internal wave physics into stellar evolution codes as a neccesary refinement.
Symmetry Breaking. Spherical symmetry in presupernova models is broken by (1) the density perturbations induced by turbulence within the convection zone, (2) the wave interactions between burning shells, and (3) rotationally induced distortions. The perturbations by waves which are trapped between the oxygen and carbon burning shells are correlated on large angular scales, as is rotation, while the turbulent perturbations have both a smaller scale and amplitude. Our restricted simulation domain filters out wave modes with , so it is likely that even larger scale perturbations exist in real stars. Symmetry breaking will seed instabilities in an outward propagating supernova shock (Kuranz et al., 2005), and in the collapsing core. The converging case has been intensely studied for inertial confinement fusion (Lindl, J., 1998). The diverging case has implications for the problem of and decay in SN1987A (Herant & Benz, 1991; Kifonidis et al., 2003).
The conclusion that internal wave modes do not grow to large amplitudes during core collapse through nuclear driven overstability (Murphy et al., 2004), is based upon an analysis that ignores (1) the dynamics of convective motion and (2) the shell-shell interactions, both of which are expected to become more violent as collapse is approached. Asymmetries in core collapse have implications for pulsar birth kicks, explosion mechanisms, and for gravitational wave generation. Talon & Charbonnel (2005) have shown that internal gravity waves can transport angular momentum at a rate sufficient to be important in the evolution of solar mass stars; we suggest that they are important for evolution of more massive stars to core collapse, and for plausible prediction of the angular momentum distribution in that collapse.
References
- Alexakis et al. (2004) Alexakis, A., et al. 2004, ApJ, 602, 931
- Arnett (1996) Arnett, D. 1996, Supernovae and Nucleosynthesis: An Investigation of the History of Matter, from the Big Bang to the Present, by D. Arnett. Princeton: Princeton University Press, 1996.,
- Asida & Arnett (2000) Asida, S. M., & Arnett, D. 2000, ApJ, 545, 435
- Bazan & Arnett (1998) Bazan, G., & Arnett, D. 1998, ApJ, 496, 316
- Fryxell, Müller, & Arnett (1989) Fryxell, B., Müller, E., & Arnett, D. 1989 MPA Preprint 449 (Garching: Max-Planck-Institut für Astrophysik)
- Herant & Benz (1991) Herant, M., & Benz, W. 1991, ApJ, 370, L81
- Kifonidis et al. (2003) Kifonidis, K., Plewa, T., Janka, H.-T., Müller, E. 2003, A&A, 408, 621
- Knobloch & Merryfield (1992) Knobloch, E., & Merryfield, W. J. 1992, ApJ, 401, 196
- Kuranz et al. (2005) Kuranz, C. C., et al. 2005, Ap&SS, 298, 9
- Langer et al. (1983) Langer, N., Fricke, K. J., & Sugimoto, D. 1983, A&A, 126, 207
- Lindl, J. (1998) Lindl, J. D., 1998, Inertial Confinement Fusion, Springer-Verlag, Berlin Heidelberg New York.
- Murphy et al. (2004) Murphy, J. W., Burrows, A., & Heger, A. 2004, ApJ, 615, 460
- Peltier (2003) Peltier, W. R. 2003, Annual Review of Fluid Mechanics, 35, 135
- Press (1981) Press, W. H. 1981, ApJ, 245, 286
- Press & Rybicki (1981) Press, W. H., & Rybicki, G. B. 1981, ApJ, 248, 751
- Rauscher & Thielemann (2000) Rauscher, T., & Thielemann, K.-F., 2000, Atomic Data Nuclear Data Tables, 75, 1
- Spruit (1992) Spruit, H. C. 1992, A&A, 253, 131
- Stevenson (1979) Stevenson, D. J. 1979, MNRAS, 187, 129
- Talon & Charbonnel (2005) Talon, S., & Charbonnel, C., 2005, A&A, 440, 981.
- Townsend (1966) Townsend, A.A., 1966, Quart. J. Roy. Met. Soc. 90, 248
- Turner (1973) Turner, J. S., 1973, Buoyancy Effects in Fluids (Cambridge University, Cambridge, England).
- Unno et al. (1989) Unno, W., Osaki, Y., Ando, H., Saio, H., & Shibahashi, H. 1989, Nonradial oscillations of stars, Tokyo: University of Tokyo Press, 1989, 2nd ed.,
- Woosley & Weaver (1988) Woosley, S. E., & Weaver, T. A. 1988, Phys. Rep., 163, 79
- Young & Arnett (2005) Young, P. A., & Arnett, D. 2005, ApJ, 618, 908