THE ORIGIN OF COSMIC RAYS AT ALL ENERGIES
Abstract
There is mounting evidence from observations of long duration gamma ray bursts (GRBs), supernova remnants (SNR) and the supernova (SN) explosion 1987A, that SN explosions eject highly relativistic bipolar jets of plasmoids (cannonballs) of ordinary matter. The highly relativistic plasmoids sweep up the ambient matter in front of them, accelerate it to cosmic ray (CR) energies and disperse it along their long trajectories in the interstellar medium, galactic halo and intergalactic space. Here we use the remarkably successful cannonball (CB) model of GRBs to show that bipolar jets from Galactic SN explosions can produce the bulk of the Galactic cosmic rays at energies below the ankle, while the CRs which escape into the intergalactic space or are deposited there directly by jets from SNe in external galaxies can produce the observed cosmic ray flux with energies above the ankle. The model predict well all the observed properties of cosmic rays: their intensity, their spectrum including their elemental knees and ankles, their composition and the distribution of their arrival directions. At energies above the CR ankle, the Galactic magnetic fields can no longer delay the free escape of such ultra high energy CRs (UHECRs) from the Galaxy. These UHECRs, that are injected into the intergalactic medium (IGM) by the SN jets from our Galaxy and all the other galaxies and are isotropized there by the IGM magnetic fields, dominate the flux of UHECRs. Almost all the extragalactic UHECRs heavier than helium photo-disintegrate in collisions with the far infrared (FIR), microwave and radio background radiations. The surviving CR protons and He nuclei suffer a Greisen-Zatsepin-Kuzmin (GZK) cutoff due to pion photo-production in collisions with the FIR, microwave and radio background photons.
Department of Physics and Space Research
Institute,
Technion, Haifa 32000, Israel
E-mail: arnon@physics.technion.ac.il
1 Introduction
Cosmic rays (CRs) were discovered by Victor Hess in 1912. Today, 93 years later, their origin is still debated. CRs have been studied in experiments above the atmosphere, in the atmosphere, on the ground, underground and in space. Their energies cover an enormous range, from sub GeV to more than a few over which their differential flux decreases by roughly 33 orders of magnitude. Any successful theory of the origin of CRs must explain their main observed properties near Earth (for recent reviews see Biermann & Sigel 2002; Olinto 2004; Cronin 2004 Watson 2004; Hoerandel 2005; Engel 2005):
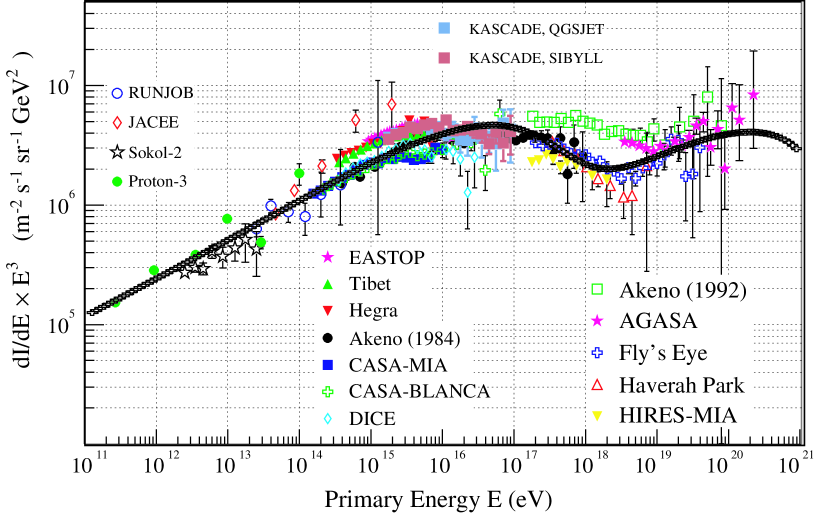
The CR energy spectrum shown in Fig. 1, has been measured up to hundreds . It can be approximated by a broken power-law, with a series of breaks near known as ‘the knee’, a second ‘knee’ near 200 PeV and an ‘ankle’ near . The power-law index changes from below the knee to above it and steepens to at the second knee. At the ankle the spectral index seems to decrease to The spectral behaviour above is still debated (see e.g., Olinto 2004; Cronin 2004; Watson 2004).
The CR elemental composition is known well only from direct measurements on board satellites which run out of statistics well below the knee energy. The measured composition of high energy CRs is highly enriched in elements heavier than hydrogen relative to that of the solar system. The enrichment increases with atomic number and with CR energy almost up to the second knee beyond which it appears to decline (e.g., Kampert et al. 2004; Hoerandel, 2004 ). as shown in Figs 4,5. It is still debated at energies above the ankle (e.g. Cronin 2004; Watson 2004). The detailed elemental composition at the knee and above it is known only very roughly (e.g. Hoerandel 2004, 2005; Cronin 2004; Watson 2004; Engel 2005).
The CR arrival directions at energy below are isotropized by the Galactic magnetic fields. Only at energies well above their arrival directions may point towards their Galactic sources and only at extremely high energies they may point towards nearby extragalactic sources. Initial reports of deviations from isotropy in the arrival directions of such cosmic rays with energy above and of some clustering in their arrival directions are still debated (e.g. Cronin 2004).
The Galactic cosmic ray luminosity has been estimated to be between (e.g., ) and more than (see, e.g. Dar & De Rújula 2001) depending on the size of the Galactic CR halo.
It is widely believed that Galactic CRs with energy below the knee are accelerated mainly in Galactic supernova remnants (SNRs). The opinions on the origin of CRs with energy between the knee and the ankle are still divided between Galactic and extragalactic origin. CRs with energy above the ankle are generally believed to be extragalactic in origin because they can no longer be isotropized by the Galactic magnetic fields while their observed arrival directions are isotropic to a fair approximation. Yet Galactic origin is not ruled out – they may be produced by the decay of unknown massive particles or other sources which are distributed isotropically in an extended Galactic halo (e.g. Plaga 2002). An observational proof that the CRs above the ankle are extragalactic in origin, such as arrival directions which are correlated with identified extragalactic sources or a Greisen-Zatsepin-Kuzmin (GZK) cutoff due to production in their collisions with the cosmic microwave background radiation (MBR), are still lacking (Cronin 2004). Moreover, there is no single solid observational evidence which supports the SNR origin of the bulk of CRs below the knee (see, e.g. Plaga 2002 and references therein). In fact, the evidence from -ray astronomy, x-ray astronomy and radio astronomy strongly suggest that SNRs are not the major accelerators of CRs with energy below the knee:
-
•
SNR origin cannot explain the Galactic CR luminosity: Radio emission and X-ray emission from SNRs provide strong evidence for acceleration of high energy electrons in SNRs. Some SNRs were also detected in TeV -rays which could be produced by the prompt decay of ’s from collisions of high energy hadronic cosmic rays with the ambient protons and nuclei in and around the SNR. However, recent observations of SNRs inside molecular clouds (and careful analysis of Tev emission in others, such as SN1006) show that the time-integrated CR luminosity of these SNRs does not exceed a few unless an extremely small mean baryon density is assumed for the production region. The rate of Galactic SN explosions, which is estimated to be yields a total CR luminosity which falls short by two orders of magnitude than the estimated luminosity of the Milky Way (MW) in CRs,
-
•
SNR origin cannot explain the diffuse Galactic GBR: The interactions of CR electrons with ambient photons and of CR nuclei with ambient nuclei in the interstellar medium produce a diffuse background of -rays. Such a diffuse gamma background radiation (GBR) has been detected by EGRET and Comptel on board the Compton Gamma Ray Observatory (CGRO). However, the scale length of the distribution of SNR in the Galactic disk is and cannot explain the scale length of the observed GBR, which is larger by more than an order of magnitude. In particular, energetic electrons cool rapidly by inverse Compton scattering of stellar light and of microwave background photons. Over their cooling time they cannot reach by diffusion far enough from the SNRs to explain the intensity of GBR at large Galactic distances.
-
•
SNR origin cannot explain the diffuse radio emission from galaxies and clusters: Because of their fast cooling in the MBR the electrons from SNRs, which are mainly located in the galactic disk, cannot reach large distances from the galactic disk by diffusion or galactic winds. The radio emission from our Galaxy, from edge-on galaxies and from the intergalactic space in clusters of galaxies provide evidence for high energy electrons at very large distances from the galactic disks where most of the SNRs are located.
Although supernova remnants (SNRs) do not seem to be the main source of CRs in our Galaxy, in external galaxies and in the intergalactic medium (IGM), still SN explosions may be the main source of CRs at all energies if SNe emit highly relativistic bi-polar jets which produce the visible GRBs when they point in our directions (Dar and Plaga 1999)aaaThe association between GRBs and high energy CRs was first suggested by Dar et al. (1992). Waxman (1995), Vietri (1995) and Milgrom (1995) suggested that extragalactic GRBs are the main accelerators only of ultra-high energy cosmic rays (UHECRs). However, following the first observational evidence for a GRB-SN association (Galama et al 1998), Dar & Plaga (1999), suggested that the bulk of the cosmic rays at all energies are accelerated in bipolar jets that are ejected in Galactic SN explosions which produce Galactic GRBs, most of which are beamed away from Earth.. Here, I will outline briefly a simple theory of the origin of CRs at all energies which is based on the extremely successful cannonball (CB) model of GRBs (Dar & De Rújula 2000,2004). I will show that it explains remarkably well the main observed properties of Galactic and extragalactic CRs. The complete theory and a rigorous derivation of the main properties of CRs from the CB model will be published elsewhere (Dar & De Rújula 2005b). According to this theory:
-
•
The bulk of the CR nuclei are accelerated by the highly relativistic bipolar jets of plasmoids (cannonballs) of ordinary matter ejected in SN explosions (which produce GRBs, most of which do not point towards Earth). These jets can accelerate swept in ISM particles to the highest observed cosmic ray energiesbbbJets from microquasars and active galactic nuclei may also contribute to CR acceleration in galaxies and in clusters of galaxies, but they will not be discussed here..
-
•
The elemental knees are the maximal lab energy that ISM nuclei acquire by elastic magnetic scattering in the CBs’ rest frame. The knee in the al-particle spectrum is the maximal lab energy of CR protons and the ‘second’ knee is that of the iron group nuclei and heavier metals.
-
•
The Galactic cosmic rays escape outside the Galaxy by diffusion in the Galactic magnetic fields. Their energy-dependent confinement time steepens their Galactic spectrum. The ankle is the energy where the Galactic magnetic fields can no longer isotropize their directions and delay their free escape into the IGM.
-
•
The CRs from SN explosions that have escaped the galaxies into the IGM, or were deposited there directly by the jets from galactic SNe, produce the bulk of the CRs in the intra cluster medium in galaxy clusters and in the IGM outside clusters. They have been accumulating there over the Hubble time and were isotropized by the IGM magnetic fields. Above the ankle, the Galactic magnetic fields cannot shield it from UHECRs. Thus most of he UHECRs nuclei in the Galaxy with energy above the ankle are extragalactic in origin.
-
•
The galactic CRs which escape into the IGM, or are directly deposited there, have the injection spectral index below the elemental knees.
-
•
The spectrum of the extragalactic UHECRs in the IGM is modified by the cosmic expansion and by their interaction with the far infrared, microwave and radio background radiations. The effective thresholds for pair production and photo-disintegration are well below the CR ankle but the Galactic magnetic field and Galactic winds probably prevent their penetration at energies well below the ankle. At energies above the ankle, the UHECRs which cross through the Galaxy dominate the CR flux. Most of the UHECR nuclei heavier than are destroyed by photo-disintegration in less than a Hubble time. The bulk of the UHECR protons and nuclei in the IGM suffer a GZK suppression due to production and only those from nearby extragalactic sources may reach the Galaxy.
-
•
Direct CR deposition in the IGM, by CBs and their associated CR jets and by CR diffusion and galactic winds, stir it up and generate the turbulent IGM magnetic fields (Dar and De Rújula 2005a).
-
•
The CR electrons, in external galaxies and in the IGM produce the bulk of the extragalactic diffuse gamma-ray background radiation (GBR) by inverse Compton scattering of the cosmic microwave background (MBR) (Dar and De Rújula 2000).
2 Collimated jets and relativistic beaming
Radio, optical and X-ray observations with high spatial resolution indicate that relativistic jets, which are fired by quasar and microquasars, are made of a sequence of plasmoids (cannonballs) of ordinary matter whose initial expansion (presumably with an expansion velocity similar to the speed of sound in a relativistic gas) stops shortly after launch (e.g., Dar & D Rújula 2004 and references therein). The turbulent magnetic fields in such plasmoids gather and scatter the ionized ISM particles on their path. For the sake of simplicity, we shall assume here that all the incident ISM particles which are scattered in the CBs are first isotropized there by magnetic scattering. Electrons which are trapped in the CBs cool there quickly by synchrotron emission. This radiation which is emitted isotropically in the CBs’ rest frame is beamed by the relativistic bulk motion of the CBs (Lorentz factor . Let primed quantities denote their values in the plasmoid’s rest frame and unprimed quantities their corresponding values in the lab frame. Then the angle of the emitted photons in the CBs’ rest frame relative to the CBs’ direction of motion, and the corresponding angle in the lab frame, are related through:
| (1) |
This relation is valid to a good approximation also for the emission of highly relativistic massive particles. When applied to an isotropic distribution of emitted particles in the CBs’ rest frame, it yields a distribution,
| (2) |
in the lab frame where
| (3) |
is the Doppler factor of the CB motion viewed from a lab angle . For plasmoids with highly relativistic bulk motion Lorentz factor, and for , the Doppler factor is well approximated by
| (4) |
Hence, the isotropic distribution of the emitted particles in the CB’s rest frame is collimated into a narrow conical beam, “the beaming cone”, around the direction of motion of the CB in the lab frame,
| (5) |
The beaming depends only on the CB’s Lorentz factor but not on the mass of the scattered particles.
Ambient ISM particles which are practically at rest in the ISM, enter the CBs with an energy After magnetic scattering and isotropization in the CB they are emitted with a lab energy
| (6) |
Their energy distribution in the lab frame given by a simple step function:
| (7) |
where for and for The accelerated nuclei () and electrons (), which are initially ejected into a narrow cone, are later scattered and isotropized by the galactic magnetic fields. The electrons do not reach far away from their injection cone before they radiate most of their initial energy via synchrotron emission and inverse Compton scattering of the microwave background photons along their direction of motion. Their radiation, which is beamed along their motion, can be seen by an observer outside the CBs’ beaming cone, only when their direction of motion points towards him. Because of the fast radiative cooling of energetic electrons, their radiation is visible mainly when they are still within/near the beaming cone. The gradual increase of the opening angle of the injection cone due to jet deceleration, together with the finite lifetime of the radiating electrons which confines them to near the jet, produce the a conical images of radio and optical jets. It is often confused with the true geometry of the relativistic jet, which reveals itself only in observations at much higher frequencies where the observed emission requires much stronger magnetic fields than those present in the ISM and IGM.
3 GRBs from SN jets
There is mounting observational evidence that long duration gamma ray bursts (GRBs) are produced by ultra-relativistic jets of ordinary matter which are ejected in core collapse supernova (SN) explosions (see, e.g. Dar 2004; Dado these proceedings) as long advocated by the remarkably successful CB model of GRBs (e.g., Dar & De Rújula 2000, 2004; Dado et al. 2002, 2004 and references therein). In the CB model, the long-duration GRBs are produced in ordinary core-collapse SN explosions. Following the collapse of the stellar core into a neutron star or a black hole, and given the characteristically large specific angular momentum of stars, an accretion disk or torus is hypothesized to be produced around the newly formed compact object, either by stellar material originally close to the surface of the imploding core and left behind by the explosion-generating outgoing shock, or by more distant stellar matter falling back after its passage (De Rújula 1987). A CB is emitted, as observed in microquasars, when part of the accretion disk falls abruptly onto the compact object (e.g. Mirabel & Rodrigez 1999; Rodriguez & Mirabel 1999 and references therein). The high-energy photons of a single pulse in a GRB are produced as a CB coasts through the “ambient light” permeating the surroundings of the parent SN. The electrons enclosed in the CB Compton up-scatter photons to energies that, close to the CBs direction of motion, correspond to the -rays of a GRB and less close to it, to the X-rays of an XRF. Each pulse of a GRB corresponds to one CB in the jet. The timing sequence of emission of the successive individual pulses (or CBs) reflects the chaotic accretion process and its properties are not predictable, but those of the single pulses are (Dar & De Rújula 2004 and references therein).
4 CR acceleration by decelerating SN jets
Let be the density of nuclei of atomic mass along the trajectories of SN jets. Let us assume that the elemental abundances are constant along the trajectories, where is the total baryon density. Let us define a total effective mass of these particles, Let us assume that most of them are swept into the jet. Let us also neglect the small energy radiated away by the swept up electrons except for the fact that it ionizes completely the ISM in front of the jet. Then, for large values of , energy conservation implies that where and are the total rest-mass and bulk-motion Lorentz factor of the jet along its trajectory with initial values, and respectively. Let us denote by the number of cosmic ray nuclei of atomic mass which enter a CB at a distance Consequently one can relate the CB deceleration to the number of ISM particles which enter the CB with a Lorentz factor
| (8) |
or
| (9) |
Note that Eq. (8) depends neither on the geometry of the jet nor on the density profile along the jet trajectory. If a constant fraction of these nuclei are scattered elastically by the CBs then the CR energy spectrum due to elastic scattering by a decelerating jet can be obtained by replacing in Eq. (7) by and integrating over at a fixed under condition (6):
| (10) |
where,
| (11) |
is the maximum energy of elastically scattered ISM nuclei in the CB rest frame. For energies well below , the injected spectrum of CRs is a simple power-law, . The effective power on the rhs of Eq. (8) and consequently on the rhs of Eq. (10) steepens slightly if the emission of the elastically scattered ISM particles from the CBs is delayed by diffusion in the CB’s magnetic field whose radius increases during its deceleration. In the CB model, the CB’s radius increases like (Dado et al. 2002) which yields (Dar & De Rújula 2005b). Such a CR injection spectrum was deduced by us from the Galactic diffuse gamma ray emission by inverse Compton scattering of light and microwave background radiation by cosmic ray electrons (e.g. Dar and De Rújula 2001) and from the diffuse radio emission of galaxies and galaxy clusters by synchrotron radiation of CR electrons in their magnetic fields. A similar power-law index has been claimed to arise in numerical calculations of CR acceleration in collisionless shock acceleration (Bednarz & Ostrowski 1998; Kirk et al. 2000).
5 Spectral steepening by magnetic trapping
The cosmic rays which are accelerated by the highly relativistic jets from SN explosions are initially beamed into narrow cones along the jets’ trajectories. Their free escape into the intergalactic space is delayed by diffusion in the galactic magnetic fields which isotropize their direction of motion. The energy-dependent diffusion of CRs due to pitch-angle scattering with a Kraichnan spectrum of MHD turbulence results in a CR residence time in the host galaxy which behaves like (e.g. Wick, Dermer & Atoyan 2003) with to be compared with , which was inferred from the observed relative abundances of CRs at energies far below the knee (Swordy et al. 1990). The same diffusion law inside the CB enhances the emission of the swept-in nuclei by a factor Thus, the diffusion of CRs outside the CBs and the accumulation of CRs before their escape from the Galaxy steepens their injection spectral index to , which yields,
| (12) |
The decreasing metalicity and the deceleration of the jet along the jet’s trajectory result in an effective energy dependent which is discussed in section 7.
6 The CR knees
The distribution of the initial Lorentz factor, of the CBs in the bipolar SN jets which produce GRBs was deduced from a cannonball model analysis of the afterglow of GRBs with well known redshift (Dar & De Rújula 2004). Their well fitted log-normal distribution around yields a log-normal distribution of around which can be well approximated by :
| (13) |
The energy-spectra of the individual CR elements is obtained by integrating Eq. (12) over with the probability distribution (13):
| (14) |
The narrow log-normal distribution of the Lorentz factors of CBs, as inferred from GRBs (Dar & De Rújula 2004), produces a narrow distribution of the maximum energy of CRs produced by elastic scattering of ambient ISM particles. Thus, the energy spectra of the individual CR nuclei, integrated over all CBs, retain a sharp knee at,
| (15) |
Fig. (4) compares the predicted energy spectra of H, He, and Fe group nuclei around their respective knees as calculatedcccFor the sake of simplicity, I have neglected here Fermi acceleration inside the CBs and I have used a fitted effective . from Eqs. (12), (14), (15), and those extracted from the KASKADE observations (Kampert et al. 2004; Hoerandel et al 2004). Despite the large experimental uncertainties, the theory seems to reproduce correctly the elemental knees, their A-dependence and their energy spectrum around these knees. Note that the predicted knee for different elements is proportional to rather than to as in conventional models based on shock acceleration, where the maximum energy gain is limited by the requirement that the size of the accelerator be larger than the Larmor radius of the accelerated CR particles. This difference is large only for nuclei lighter than He nuclei. However, accurate values of the knee energy of such nuclei are not available yet from the CR experiments.
The energy spectrum of individual elements falls rapidly at their knees. The all-particle CR spectrum beyond the proton knee loses progressively the contribution from heavier and heavier elements, until it becomes almost pure iron. This produces the steepening of the spectrum between the proton knee and the iron knee and results in a composition which gradually approaches a pure iron+heavier metal composition. Because the abundances of elements heavier than iron are rather small compared to iron, the all-particle spectrum steepens at the iron knee forming the second knee in the all-particle spectrum.
7 Elemental abundances and spectral indexes below the knees
The elemental abundances of CRs accelerated by SN jets can be read from Eq. (12),
| (16) |
where is the mean element’s abundance encountered by the CBs along their trajectory in the ISM around a distance where the CB Lorentz factor is The -dependence follows from the fact that all CR nuclei, which are accelerated by CBs, have the same universal Lorentz factor distribution : The substitution yields
More than 90% of SN explosions take place in star formation-regions which are enclosed in superbubbles (SB) formed by the ejecta from former SN explosions and massive stars. Therefor, near the GRB site, the elemental abundances are typically that of young SNRs (which are made of SN ejecta + progenitor ejecta prior to the SN). Further down they become typical SB abundances. Both, and are not well known. Their metalicity enhancement is expected to progress from about a factor for C,N,O,Ne and for heavier elements such as Mg,Si,S,Ar,Ca,Fe,Ni (e.g. Higdon et al. 2001). Outside the SB, become normal ISM abundances and when the jet enters the halo, become typical halo abundances. The decrease in metalicity along the CB trajectories by a factor of a few, induces a noticeable change in the spectral index of the different CR elements. It makes the proton spectrum slightly steeper and decreases slightly the steepness of the energy spectrum of the metals. The change in the spectral index is given roughly by
| (17) |
The change in elemental abundances along the CB trajectory from to corresponds to energies increase from to Thus, for protons, below the proton knee, while for iron nuclei below the iron knee, In Fig. 3 we compare the predicted spectral index below the knee for different elements and their observed values as reported by Wiebel-Sooth et al. (1997) from their best fits to the world CR data below the knee. The theoretical predictions are well interpolated by During their residence time in galaxies, spallation of CRs in collisions with ISM nuclei increases significantly the abundances of the long-lived rare elements, but change only slightly the abundances of the most abundant elements. A detailed discussion of the effects of spallation on CR elemental abundances, is beyond the scope of this report. Thus, Table I compares the observed CR elemental abundances relative to hydrogen near TeV energy and the CR abundences which are predicted by Eq. (16) for the most abundant elements He,C,N,O,Ne,Mg,Si,S,Ar,Ca,Fe,Ni. Table I also lists the values of (e.g. Grevesse & Sauval 2002), which were used in the calculations. Note the large enhancement in the abundances of all the elements relative to hydrogen. The CB model reproduces well these large enhancements for the abundant elements which are not changed much by spallation.
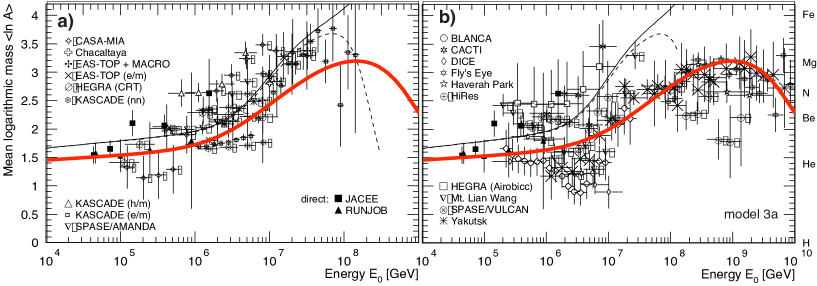
Above the proton knee, CRs become progressively poor in protons. Above the knee, they become poor also in , than also in , etc, until near the iron knee (the second knee) where they consist mainly of iron and traces of heavier elements. Spallation affect only slightly the value of . In Figs. 5, LABEL:fig6 the CB model prediction for as function of CR energy, without spallation, and its extracted values from observations (see, e.g. Hoerandel 2004) are compared. Despite the large spread in the world data, the CB model clearly reproduces the observed trends.
8 CR acceleration above the knees
Swept in ISM particles can also be Fermi accelerated within the CBs by their turbulent magnetic fields to an energy distribution within the CBs, where is the energy of the ISM particles entering a CB and is the maximum energy which CRs can be accelerated to in the CBs before their Larmor radius exceeds , the radius of the CBs (the lLarmor cutoff). In the lab, the maximal CR energy in the CB, becomes
| (18) |
This relation differs from the usual ‘Hillas relation’ by the factor which is due to the relativistic motion of the CR accelerator – the CB. For a magnetic field whose pressure is equal to that of the scattered ISM particles (Dado et al. 2002a), where is the superbubble density, and then the maximal energy is,
| (19) |
Hence, SN jets which produce GRBs can accelerate CR nuclei to energies much higher than the highest energy of a cosmic ray which has ever been measured ().
The integrated spectrum of CRs which are Fermi accelerated within the CBs and escape them by diffusion can be obtained by integrating their emission along the trajectories of the decelerating CBs. The calculation is similar to the calculation of the spectrum of CR acceleration by CB elastic scattering, below the knee, but it is too long to be included here and will be described elsewhere (Dar and De Rújula 2005).
9 The CR ankle
In the CB model the CR ankle is the energy where the Galactic magnetic fields can no longer isotropize the cosmic rays and delay their free escape from the Galaxy. This happens when the Larmor radius of the CRs approaches the coherence length, of the turbulent Galactic magnetic fields. Consequently, the accumulation time of Galactic cosmic rays must satisfy,
| (20) |
For Eq. (20) yields This value is between which is expected at low energies for a Kraichnan spectrum of MHD turbulence, and which is expected at high energies for a Kolmogorov spectrum of MHD turbulence. The transition energy between the two values has not been predicted yet from the diffusion models. A consistency check for the above interpretation of the origin of the ankle can be obtained as follows:
The accumulation time of CRs in the IGM is roughly the age of the Universe, where is the Hubble constant. The SN rate in the Universe per comoving unit volume is roughly proportional to the luminosity of this volume. The luminosity density in the local Universe is, The optical luminosity of the Milky Way is and the volume of its CR halo isdddThis volume was estimated from a best fit by Strong et al. (2004) of the CR production rate of -rays in a “leaky box” model of the galactic CR halo to the diffuse gamma-ray emission of the Galaxy as measured by EGRET (Sreekumar et al. 1998). (the volume of a cylinder with a diameter of and a height of ) The extragalactic (EG) flux takes over the Galactic flux at where
| (21) |
i.e., the theory predicts that at
| (22) |
where the effects of cosmic expansion and stellar evolution are included in a cosmological factor which, for the standard cosmology, has approximately the value as discussed in the next section. Thus, Eq. (22) is well satisfied at if
10 The spectrum of the extragalactic UHECRs
The cosmic SN rate is believed to be proportional to the cosmic star formation rate, which is given approximately by (see, e.g. Lilly et al. 1995; Madau et al. 1996; Perez-Gonzalez et al. 2005 and references therein), and In a steady state, the injection rate of CRs into the IGM by a galaxy is equal to their galactic production rate. Consequently, SN explosions in galaxies, inject into the IGM the kinetic energy of their jets at a rate per comoving unit volume, where the rate of SN explosion in a comoving unit volume, presumably, is proportional to the star formation rate, Using the redshift-time relation for a standard cosmology with
| (23) |
the CR spectral density in the local IGM is given by,
| (24) |
where is the number of CRs produced by the bipolar jets in a single SN explosion, and consequently and, is the observed SN rate in the local Universe iseee The measured SN rate is 2.8 y-1 (Van den Bergh & Tammann, 1991) in a “fiducial volume” of 342 galaxies within the Virgo circle whose total B-band luminosity is ). For ( in units of ) and the galactic luminosity , we also obtain .. Hence, neglecting the interaction of CRs in the IGM, the cosmic expansion modifies the CR accumulation by the factor
| (25) |
During their accumulation time in the IGM, the UHECRs from SN explosions in external galaxies are completely isotropized there by the IGM magnetic fields. Their injection spectrum, is modified in the IGM mainly by cosmic expansion and by photo-disintegration, pair production and pion production in collisions with photons of the cosmic far infrared (FIR), microwave and radio background radiations.
In the CB model, these lead to four major predictions for CRs
-
•
Most nuclei heavier than are destroyed in the IGM by photo-disintegration and the composition of UHECRs becomes almost purely protons and nuclei.
-
•
The spectrum of UHECR protons and nuclei must show the GZK cutoff.
-
•
The CR flux above the ankle should remain highly isotropic up to the GZK cutoff.
-
•
The absolute normalization of the extragalactic flux can be calculated from the Galactic luminosity of UHECRs, the SN rate in the local universe and the star formation rate as function of redshift or look-back time.
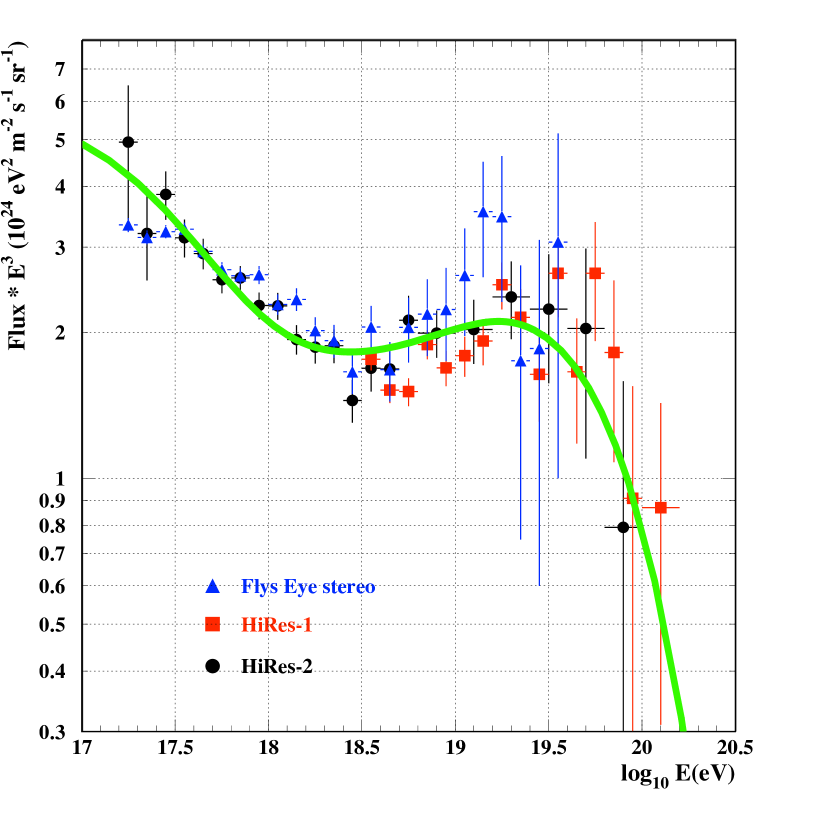
Figs. 2-7 compare the CB model predictions and the observations of the spectrum, composition and the depth of shower maximum of the UHECRs. The detailed descriptions of the calculations of the spectrum, the composition and the depth of shower maximum of the UHECRs are beyond the scope of this paper and will be described elsewhere (Dar and De Rújula, 2005). The predictions of the CB model seem to favour the results from the Fly’s eye and HiRes experiments over those from the AGASA experiment, (unless the AGASA energies are reduced by 30%) as can be clearly seen from Fig. 2.
11 The Galactic CR Luminosity
In a steady state, the escape rate of Galactic CRs into the IGM is equal to their production rate. In the CB model, most of the kinetic energy of SN jets is converted to CR energy in the Galaxy. In the CB model, this energy was estimated Dar & De Rújula 2000,2004) to be per SN. Thus, a Galactic SN rate, generates a Galactic CR luminosity of
| (26) |
This value is consistent with a more direct estimate of As a result of the steep energy spectrum of galactic CRs, the bulk of the CR energy is carried by nuclei with an average energy of a few GeV. The most accurate measurements of their flux, , near Earth and during solar minimum (minimum solar modulation) are those of AMS (Alcaraz et al. 2000a,b) and BESS (Haino et al. 2004). Under the assumption of constant CR density inside the Galactic CR halo, their measurements yield a CR Luminosity fffAt energies below GeV, is affected by the Earth’s and solar wind magnetic fields. The uncertainties in the energy-weighed integral of Eq. (27) are much smaller.:
| (27) |
Traditional estimates which are based on an assumed conversion of the kinetic energy of the non-relativistic ejecta in SN explosions to CR energy through collisionless shock acceleration, yield much smaller CR luminosities, They are adjusted to fit estimates from CR diffusion models which ignore the direct deposition of CRs by SN jets in the Galactic halo and the in the IGM.
12 Conclusions
The CB model of GRBs was used here to demonstrate that the bipolar jets from SN explosions can be the main source of cosmic rays at all energies. The model correctly predicts, within the experimental uncertainties, the observed all-particle CR flux, its energy spectrum and its elemental composition at all energies. In particular, the model predicts that the CRs above the ankle are extragalactic in origin, are mostly protons nuclei, are highly isotropic and their spectrum exhibit the GZK suppression due to their interaction with the microwave and radio background radiations. It appears like the 93 years old puzzle of the origin of galactic CRs has been solved. However, more precise CR data on their energy spectrum and composition, in particular near the CR knees and well above the GZK cutoff, as well as astrophysical data on the elemental abundances in SNRs and SBs are needed before a firm conclusion can be made.
13 Acknowledgments
The author would like to thank Shlomo Dado, and Alvaro De Rújula for a long term collaboration in the development of the CB model for GRBs and CRs. The support of the Asher Space Research Fund is gratefully acknowledged. This research was not supported by the Israel Science Foundation for basic research.
References
- [1] Alcaraz, J., et al. 2000a, PLB, 27, 490
- [2] Alcaraz, J., et al. 2000b, PLB, 27, 494
- [3] Bednarz, J., Ostrowski, M. 1998, PRL, 80, 3991
- [4] Cronin, W. J. 2004, astro-ph/0402487
- [5] Dado, S., Dar, A. & De Rújula, A. 2002, A&A, 388, 1079
- [6] Dar, A. 1998, astro-ph/9809163
- [7] Dar, A. & De Rújula, A. 2000, astro-ph/0008474
- [8] Dar, A. & De Rújula, A. 2001, MNRAS 323, 391
- [9] Dar, A. & De Rújula, A. 2001, ApJ, 547, L33
- [10] Dar, A. & De Rújula, A. 2004, Phys. Rep. 405, 203
- [11] Dar, A. & De Rújula, A. 2005a, PRD 72, 123002
- [12] Dar, A. & De Rújula, A. 2005b, in preparation
- [13] Dar, A. & Plaga, R. 1999, A&A, 349, 259
- [14] Dermer, C. D. Humi, M. 2001, ApJ. 556 479-493
- [15] De Rújula, A. 1987, Phys. Lett. 193, 514
- [16] Engel, R. 2005, astro-ph/0504358
- [17] Greisen, K. 1966, PRL, 16, 748
- [18] Grevesse, N. & Sauval, A. J. 2002, Adv. Sp. Res. 30, 3
- [19] Haino, S., et al. 2004, astro-ph/0403704
- [20] Heinz, S., Sunyaev, R. A. 2002, A&A, 390, 751
- [21] Hoerandel, J. R. 2004, astro-ph/0402356
- [22] Hoerandel, J. R. 2005, astro-ph/0504358
- [23] Kampert, K. H. et al. 2004, astro-ph/0405608
- [24] Kirk, J. G., et al. 2000, ApJ. 542, 235
- [25] Lilly, S. J., et al. 1995, ApJ, 455, 108
- [26] Madau, P., et al. 1996, MNRAS, 283, 1388
- [27] Nagano, A., Watson, A. A. 2000, RMP, 72, 689
- [28] Milgrom, M. & Usov, V. 1996, Astropart. Phys. 4, 365.
- [29] Olinto, A. V. 2004, astro-ph/0410685
- [30] Perez-Gonzalez, P. G., et al. 2005, astro-ph/0505101
- [31] Plaga, R. 2002, NA, 7, 317
- [32] Sreekumar, P., et al. 1998, ApJ, 494, 523
- [33] Strong, A. W., Moskalenko, I. V. & Reimer, O. 2004, ApJ, 613, 962
- [34] Swordy, S. P., et al. 1990, ApJ, 349, 625
- [35] van den Bergh, S. & Tammann, G. A. 1991, ARA&A, 29, 363
- [36] Vietri, M. 1995, ApJ. 453, 883
- [37] Watson, A. A. 2004, astro-ph/0410514
- [38] Waxman, E. 1995, PRL 75, 386
- [39] Weibel-Sooth, B., Biermann, P. L., Meyer, H. 1997, astro-ph/9709253
- [40] Zatsepin, G. T., Kuzmin, V. A. 1966, JETP Lett. 4, 78
- [41] Zech, A. 2004, astro-ph/0409140 (Nucl. Phys. in press)
| Z | |||||
|---|---|---|---|---|---|
| H | 1 | 1 | 1 | 1 | |
| He | 2 | ||||
| C | 6 | ||||
| N | 7 | ||||
| O | 8 | ||||
| Ne | 10 | ||||
| Mg | 12 | ||||
| Si | 14 | ||||
| S | 16 | ||||
| Ar | 18 | ||||
| Ca | 20 | ||||
| Fe | 26 | ||||
| Ni | 28 | ||||