[O III] emission line in narrow-line Seyfert 1 galaxies
Abstract
Three sets of two-component profiles are used to simultaneously model the [O III]4959, 5007 and H lines for the Fe II-subtracted spectra of 149 narrow-line Seyfert 1 galaxies (NLSls) from the Sloan Digital Sky Survey (SDSS). Using the linewidth of the narrow/core component of [O III]5007 to trace the stellar velocity dispersion instead of using the total linewidth of [O III]5007, we found that the SDSS NLSls are still deviated from the relation found in the nearby inactive galaxies, suggesting that the linewidth of the [O III] narrow/core component is likely not a good tracer of bulge velocity dispersion in NLSls, since some other studies indicate that NLS1s, like other active galactic nuclei (AGNs), should follow the relation. If we assume that the [O III]5007/H line ratio emitted in narrow line region (NLR) ranges from one to ten, 63 objects are found to satisfied with this criterion and their H broad components should be used to calculate their virial black hole masses. These 63 objects are statically consistent with the relation. With the Chandra observation of some SDSS NLSls, for one object in these 63 objects, J143030.22-001115.1, we found that it can’t be classified as a genuine NLS1. Its narrow component of H is coming from NLRs. This is consistent with its very flat hard X-ray spectrum found by researchers.
keywords:
galaxies:active — galaxies:nuclei — quasars: emission lines — galaxies:individual: J143030.22-001115.11 INTRODUCTION
There is a strong relation between the central black hole mass and the bulge velocity dispersion (the relation) for inactive nearby galaxies (Gebhardt et al. 2000a; Ferrarese & Merritt 2000; Tremaine et al. 2002), suggesting that the formation and evolution of host galaxies and their active nuclei are intimately related. For active galactic nuclei (AGNs), reverberation mapping method and then the empirical size-luminosity relation are usually used to measure the black hole mass instead of the gas and stellar dynamics used in nearby galaxies (Peterson 1993; Kaspi et al. 2000). Broad-line AGNs follow this relation (Gebhardt et al. 2000b; Ferrarese 2001; Nelson 2001; Shield et al. 2003; Boroson 2003; Bonning et al. 2005; Greene & Ho 2005c). Many theoretical models are presented to explain the established relation, considering the regulation of the bulge growth by the feedback from the accretion around the black hole (e.g. Silk & Rees 1998; King 2003; Hopkins et al. 2005).
However, for an interesting subclass of AGNs, narrow-line Seyfert 1 galaxies (NLSls), their locus in plane is still a question to debate. NLS1s are defined with the following characteristics. H full width at half-maximum (FWHM) less than km s-1; strong optical Fe II multiplets; line ratio of [O III]5007 to H less than 3 (Osterbrock & Pogge 1985; Goodrich 1989); steep, soft X-ray excess (Puchnarewicz et al. 1992; Boller, Brandt & Fink 1996) and rapid soft/hard X-ray variability (Leighly 1999). We also note that the soft X-ray photon indices of some NLS1s observed by Chandra are found to be not too steep compared with that normally observed in NLS1s (Williams et al. 2004). NLS1s are believed to have less massive black holes with higher Eddington ratios, suggesting that NLS1s might be in the early stage of AGN evolution (Grupe 1996; Mathur 2000; Bian & Zhao 2003).
NLSls seemed not to follow the relation if [O III] linewidth is used to trace the bulge velocity dispersion (Mathur, Kuraszkiewicz & Czerney 2001; Bian & Zhao 2004a; Grupe & Mathur 2004). NLS1s locus in the plane possibly depend on some parameters, such as their accretion ratios (Mathur & Grupe 2005). Greene & Ho (2004) presented a sample of 19 AGNs with low-mass black holes from Sloan Digital Sky Survey (SDSS) Data Release One (DR1). These 19 AGNs can be classified as NLS1s because of their H FWHM less than 2000km s-1. Barth, Greene & Ho (2005) measured in these 19 NLS1s. They found these NLS1s follow the relation. The linewidth of [O III] indeed typically overestimates comparing to the direct measurement of . Botte et al. (2005) also reaches this result.
As we known, the [O III] profile is usually bluewards asymmetric, i.e. with more flux on the short-wavelength side of line than on the long-wavelength side (Peterson 1997). And the strong Fe II multiples would blend the [O III] and H lines in NLS1s. Multi-component profile and Fe II template are needed to model the [O III] lines in NLS1s. Greene & Ho (2005a) recently suggested that the core of [O III] after removing its asymmetric blue wing can trace in narrow line (type 2) galaxies. Is it true for NLS1s?
We used the largest published sample of 150 NLSls to investigate this problem (Williams, Pogge & Mathur 2002). Their spectra have been analyzed using multi-component model to investigate the [O III] blueshift in NLS1s, and we found seven ”blue outliers” (Bian, Yuan & Zhao 2005a). In this paper, We want to investigate whether NLS1s follow the relation when we used the narrow/core component of [O III] line to trace . In Sec. 2, we briefly introduce the data and the analysis. Our results and discussion are given in Sec. 3. A conclusion is presented in the final section. All of the cosmological calculations in this paper assume , , .
2 DATA AND ANALYSIS
There are many samples of NLS1s: (1) an optically selected sample of 46 NLS1s with extremely steep soft X-ray spectra observed with ROSAT (Boller et al.1996); (2) a compiled sample of 64 NLS1s (Veron-Cetty, Verron & Cloncalves 2001); (3) a sample of 150 NLS1s found within SDSS Early Data Release (EDR) (Williams et al. 2002); (4) 50 NLS1s from a complete sample of 110 soft X-ray selected AGNs (Grupe et al. 2004); (5) 19 AGNs with low-mass black holes from SDSS DR1 presented by Greene & Ho (2004). Here we used the 150 SDSS NLS1s sample because it is the largest published NLS1s sample. Because of the lack of the [O III] line, SDSS J153243.67-004342.5 is ignored in our analysis.
Considering strong Fe II multiples and the asymmetry of [O III]/H lines, we reduced their SDSS spectra by the multicomponent fitting task SPECFIT (Kriss 1994) in the IRAF-STS package. The components are(1) the Galactic interstellar reddening curve; (2) Fe II template; (3) power-law continuum; (4) three sets of two-gaussian profiles for [O III]4959, 5007 and H lines. For the doublet [O III]4959,5007, We take the same linewidth for each component, and fix the flux ratio of [O III]4959 to [O III]5007 to be 1:3. We didn’t consider the starlight contribution because of no obvious stellar lines (Gu et al. 2005). For more details, please refer to Bian, Yuan & Zhao (2005a).
3 RESULTS AND DISCUSSION
3.1 Distribution of for the H and [O III] lines
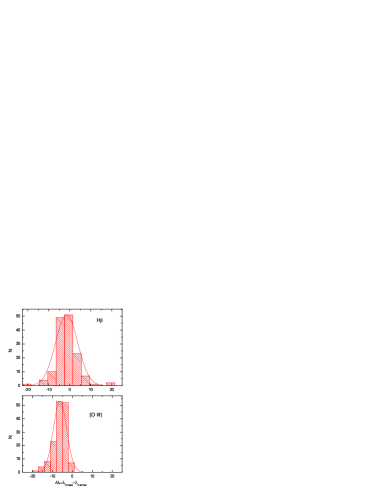
As we mentioned above, the [O III] profile is usually bluewards asymmetric. We calculated the blueshift of the broad component relative to the narrow component () for the [O III] and H lines. In Fig.1, we showed the distribution of for the H and [O III] lines. It is obvious that the [O III] profiles tend to be bluewards while the H profiles tend to be bluewards or redwards.
3.2
In our two-component model, we found that for some objects the optical Fe II multiples seriously blend with the lines of H and [O III]4959, 5007. In some cases, Fe II multiples showed almost the same magnitude of flux to that of [O III] line (see fig. 3 in Bian, Yuan & Zhao 2005a).
Bian & Zhao (2004a) directly measure the [O III]5007 linewidth [hereafter ] using one-Gaussian profile model. The spectrum resolution R is about 1800, which is equivalent to 166km s-1. The typical error of is about 10 per cent. For the width of narrow component of [O III]5007 line [hereafter ] from two-component model, the typical error is about 10 per cent.
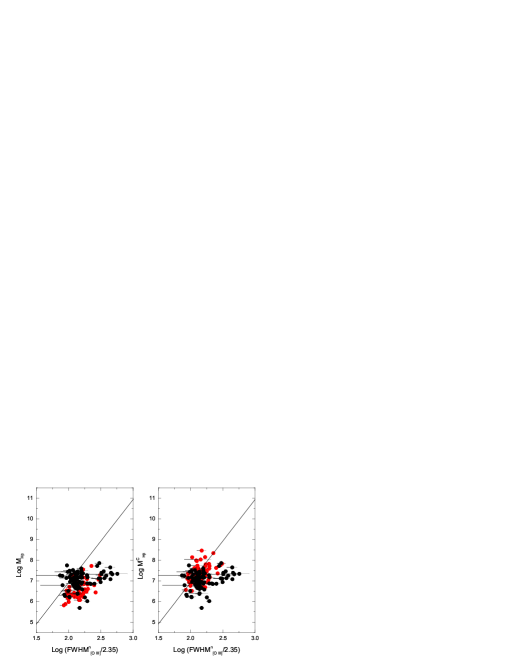
In the left panel of Fig. 2, we plotted the central black hole masses () versus . The mass versus is showed in fig. 1 in Bian & Zhao (2004a). We adopted the same range of x and y axes in order that we can compare the results with that in fig. 1 in Bian & Zhao (2004a). The masses are calculated from the H linewidth using one-Gaussian fit, which are form Bian & Zhao (2004a).
Grupe & Mathur (2004) also plot the relation for a complete sample of 75 soft X-ray Cselected AGNs: 43 broad-line AGNs and 32 NLS1s. They found that the locus of NLS1s obviously deviates from the relation defined by Tremaine et al. (2002). Considering the blue asymmetry of the [O III] profile, they remeasured the width of the [O III] line as two times half-width at half-maximum of the red part of emission line and found the deviation indeed exists. In the left-hand panel of Fig. 2, we still find this result, which is consistent with Grupe & Mathur (2004).
3.3 Mass correction
| Type | number | log() | SD |
|---|---|---|---|
| Total | 149 | -0.770.06 | 0.70 |
| Subsample A | 63 | -0.90 0.06 | 0.51 |
| Subsample A | 63 | -0.13 0.07⋆ | 0.53 |
| Subsample B | 86 | -0.670.09 | 0.79 |
| Subsample C | 54 | -0.090.07 | 0.53 |
When we used the linewidth of H or H to trace the virial velocity around black hole, we should subtract the contribution from NLRs. The template built from [O III] or [S II] is used to model narrow H and H (Grupe et al. 1998; Grupe, Thomas & Leighly 1999; Greene & Ho, 2005a,b). For seven NLS1s, Rodriguez-Ardila et al. (2000) found that the narrow component of H is about, 50% of the total line flux and the [O III] 5007/H ratio emitted in the narrow line regions (NLRs) varies from 1 to 5, instead of the universally adopted value of 10. We also found the [O III] is not too weak in many SDSS NLSls. This is consistent with the results of a sample of 64 NLSls presented by Veron-Cetty et al. (2001). There are 63 SDSS NLSls with [O III]5007/H line ratio larger than one. If we assume the narrow H is emitted from NLRs for these objects, we should use the linewidth of the H broad component to calculate the virial black hole masses, which are showed in the right panel of Fig. 2.
We also calculated the black hole mass, , using FWHM of narrow component of [O III] line as the indicator of , i.e. .
The distributions of log() for 149 SDSS NLSls are shown in Table 1, where is calculated from H FWHM using one-Gaussian fitting. These 149 NLSls statically deviated the relation defined by Tremaine et al. (2002)(See Fig. 2). Considering the spectrum resolution, the intrinsic derived from may be instrumentally broadened by about 60 km s-1(hereafter ) (Greene & Ho 2005a). The values of derived from for all objects in Fig. 1 are larger than 60 km s-1. To first order, the intrinsic can be approximated by . We found that the logarithm value of intrinsic would be lowered by 0.08 dex, which is small relative to the deviation in Fig. 2 (also see Table. 1). Subsample A consists of 63 objects with [O III]5007/H line ratio larger than 1. Subsample B consists of the rest 86 NLSls. If we used the width of the H broad component to calculated the black hole masses, we found that these 63 objects in Subsample A follow the relation. In these 63 objects, we found nine objects with the linewidth of the H broad component less than 2000km s-1. If we excluded these nine objects from sub-sample A, i.e. Subsample C, the mean value of log() would be smaller, -0.090.07 with a standard deviation of 0.53. Therefore, it is possible that these 54 objects in Subsample C are not genuine NLSls. It needs a more careful H subtraction from NLRs contribution in future.
3.4 is not a good tracer in NLSls?
From Fig. 2, we found that the locus of NLS1s obviously deviates from the relation defined by Tremaine et al. (2002). If the linewidth of the [O III] narrow/core component overestimates and then [OIII] is not a good tracer of , this suggests the particular environment of NLRs in NLS1s comparing with other AGNs. On the other hand, if the narrow [OIII] component does trace , then our results showed that NLS1s possibly do lie below the relation (Grupe & Mathur 2005).
However, the values of for some NLS1s are directly measured from the CaII/Mg b absorption lines(Filippenko & Ho 2003; Barth et al. 2004; Botte et al. 2005; Barth et al. 2005), these NLS1s follow the relation in a statistical sense, where the mass is calculated from H FWHM. Bian & Zhao (2004b) also found that the mass from the soft X-ray bump luminosity is consistent with that from the H FWHM for NLSls. Therefore there is no underestimate in mass calculation using H FWHM. This showed that the [O III] line is likely not a good tracer of bulge velocity dispersion.
Greene & Ho (2005a) investigated the relation between the velocity dispersion and the line width of [O III] with the sample of narrow-line (Type 2) AGNs from SDSS DR2. They found that, after the asymmetric blue wing is properly removed, the width of the [O III] core component can be used as a tracer of stellar velocity dispersion. They also looked for the secondary parameters for the and found a correction equation . Considering is in the range of -1 1 (see fig.1 in Bian Yuan & Zhao 2005a), the correction would be 0.008 0.152, which is small relative to the deviation in Fig. 2 (also see Table. 1). Mathur & Grupe (2005) also used this correction to derive from . However, they found that NLS1s and BL AGNs are still significantly different (see their fig. 1). They suggested some NLS1s with high Eddington ratios deviate from the relation and reside preferentially in relatively late type galaxies.
3.5 J143030.22-001115.1 with flat X-ray spectrum
Williams et al. (2004) suggested that the soft X-ray photon indices of some SDSS NLSls observed by Chandra are found not too steep compared with that normally observed in NLSls. There are two objects with the photo indices less than one. One is J125943.59+010255.1 ( ) and the other is J143030.22-001115.1 (). They belong to our 149 SDSS NLSls. For J125943.59+010255.1, the net 0.5-8 kev count rate is smallest among their Chandra observations and the uncertainties of is too large. The [O III] is too weak in the SDSSS spectrum of J1259+0102. For J143030.22-001115.1, its [O III] line is obvious. [O III]5007/H line ratio is 9.236, the largest one in these 149 SDSS NLSls. However, the Fe II line is very weak. Therefor we think the narrow component of the H line is coming from NLRs. We used three-components to model the H line. The widths of two narrow components of H were forced to be equal with that of [O III]5007 line. And the shifts between the corresponding two-component of H and [O III] were fixed to be 146Å. It is found that the FWHM of the H broad component is 2783km s-1. Therefore it is a broad line AGN, a misclassified NLS1. Some authors also found some wrong classified NLSls (e.g. Veron- Cetty et al. 2001; Botte et al. 2004). We should be cautious about using the narrow component of H to trace the black hole masses. We should exclude this kind of object in the statistics of NLSls. For more details, please refer to Bian, Cui & Chao (2005b). It is still a question whether soft X-ray photon indices of NLS1s found in SDSS are not too steep compared with that normally observed in NLSls. It needs more X-ray observations of SDSS NLS1s. We would discussion these questions in our future paper.
4 CONCLUSION
Three sets of two-component profiles are used to model the [O III] 4959, 5007 and H lines for 149 SDSS NLSls. The main conclusions can be summarized as follows.
-
•
Using the linewidth of the [O III] narrow/core component, we found that 149 SDSS NLSls are still deviated from the relation found in nearby inactive galaxies. If the linewidth of the [O III] narrow/core component overestimates and then [OIII] is not a good tracer of , this suggests the particular environment of NLRs in NLS1s comparing with other AGNs. On the other hand, if the narrow [OIII] component does trace then our results showed that NLS1s possibly do lie below the relation.
-
•
If the [O III]/H line ratio from NLRs is between one to ten, we found that the narrow H in 63 objects is from NLRs. we used the broad H line width to calculate the black hole masses. And these 63 objects follow the relation found in nearby inactive galaxies. Excluding nine objects (FWHM(h) less than 2000 km s-1) from these 63 objects, the rest of 54 objects seemed not to be genuine NLSls.
-
•
J143030.22-001115.1 can’t be classified as a genuine NLSls. Its narrow component of H is coming from NLRs. After the H contribution from BLRs removed, H FWHM is 2783km s-1. This is consistent with its very flat hard X-ray spectrum founded by Williams et al. (2004).
ACKNOWLEDGMENTS
We thank Luis C. Ho for his very helpful comments. We thank the anonymous referee for the valuable comments. This work has been supported by the NSFC (No. 10403005; No. 10473005; No. 10273007) and NSF from Jiangsu Provincial Education Department (No. 03KJB160060). Funding for the creation and distribution of the SDSS Archive has been provided by the Alfred P. Sloan Foundation, the Participating Institutions, NASA, the National Science Foundation, the US Department of Energy, the Japanese Monbukagakusho, and the Max Planck Society. The SDSS Web site is http:// www.sdss.org/. This research has made use of the NASA/IPAC Extragalactic Database, which is operated by the Jet Propulsion Laboratory at Caltech, under contract with NASA.
References
- [] Barth A. J., Ho L. C., Rutledge R.E., Sargent W.L.W., 2004, ApJ, 607,90
- [] Barth A. J., Greene, J. E., Ho L. C., 2005, ApJ, 619, L151
- [] Bian W., Zhao Y., 2003, PASJ, 55, 143
- [] Bian W., Zhao Y., 2004a, MNRAS, 347, 607
- [] Bian W., Zhao Y., 2004b, MNRAS, 352, 823
- [] Bian W., Yuan Q., Zhao Y., 2005a, MNRAS, 364, 187
- [] Bian W., Cui Q. Chao L., 2005b, Chinese J. Astron. Astrophys., in press
- [] Boller T., Brandt W.N., Fink H.H., 1996, A&A, 305, 53
- [] Bonning E. W., Shields G. A., Salviander S., McLure R. J., 2005, 626, 89
- [] Boroson T. A., Green R. F., 1992, ApJS 80, 109
- [] Boroson T. A., 2003, ApJ, 585, 647
- [] Botte V., Ciroi S., di Mille F., Rafanelli P., Romano, A., 2005, MNRAS, 356, 789
- [] Ferrarese L., Merrit D., 2000, ApJ, 539, L9
- [] Ferrarese, L., Pogge, R.W., Peterson, B. M.,Merritt, D.,Wandel, A., & Joseph, C. L. 2001, ApJ, 555, L79
- [] Filippenko A. V. & Ho L. C., 2003, ApJ, 588, L13
- [] Gebhardt K. et al., 2000a, ApJ, 539, L13
- [] Gebhardt K. et al., 2000b, ApJ, 543, L5
- [] Goodrich R.W., 1989, ApJ, 342, 224
- [] Greene J. E., Ho L. C., 2004, ApJ, 610, 722
- [] Greene J. E., Ho L. C., 2005a, ApJ, 627, 721
- [] Greene J. E., Ho L. C., 2005b, ApJ, 630, 122
- [] Greene J. E., Ho L. C., 2005c, ApJL, in press, astro-ph/0512461
- [] Grupe D., 1996, PhD Thesis, University Gottingen
- [] Grupe D., Wills B.J., Wills D., Beuermann K., 1998, A&A, 333, 827
- [] Grupe D., Thomas H.-C., & Leighly K. M., 1999, A&A, 350, L31
- [] Grupe D., Mathur S., 2004, ApJ, 606, L41
- [] Gu Q., Melnick J., Cid Fernandes R., Kunth D., Terlevich E., Terlevich R., 2005, MNRAS, in press, astro-ph/0510742
- [] Hopkins P., Hernquist L., Cox T., Matteo T., Robertson B., Springel V., 2005, ApJ, 632, 81
- [] Kaspi S., Smith P.S., Netzer H., Maoz D., Jannuzi B.T., Giveon U., 2000, ApJ, 533, 631
- [] King A. R., 2003, ApJ, 596, L27
- [] Kriss G. A. 1994, in ASP Conf. Ser. 61, Astronomical Data Analysis Software and Systems III, ed. Crabtree D. R., Hanisch R. J., Barnes J. (San Francisco: ASP), 437
- [] Leighly K. M., 1999, ApJS, 125, 297
- [] Mathur S., 2000, MNRAS, 314, L17
- [] Mathur S., Kuraszkiewicz J., & Czerney B. 2001, New Astron., 6, 321
- [] Mathur S., Grupe D., 2005, ApJ, 633, 688
- [] Nelson C. H., 2001, ApJ, 544, L91
- [] Osterbrock D.E., Pogge R., 1985, ApJ, 297, 166
- [] Peterson B. M. , 1997, in An introduction to active galactic nuclei (Cambrigde: Cambridge Univ. Press).
- [] Peterson B. M. , 1993, PASP, 150, 247
- [] Puchnarewicz E. M., Mason K. O., Cordova F. A., et al., 1992, MNRAS, 256, 589
- [] Rodriguez-Ardila A., Binette L., Pastoriza M. G., Donzelli C. J., et al., 2000, ApJ, 538, 581
- [] Shields G. A., Gebhardt K., Salviander S., Wills B. J., Xie B., Brotherton M. S., Yuan J., & Dietrich M., 2003, ApJ, 583, 124
- [] Silk J., Rees M. J. 1998, A&A, 331, L1
- [] Tremaine S., et al., 2002, Ap J, 574, 740
- [] Veron-Cetty M.-P., Verron, P., Cloncalves A. C., 2001, A&A, 372, 730
- [] Williams R.J., Pogge R.W., Mathur S., 2002, AJ, 124, 3042
- [] Williams R. J., Mathur S., Pogge R. W. 2004, ApJ, 610, 737