??–??
Methanol Masers and Star Formation
Abstract
Methanol masers which are traditionally divided into two classes provide possibility to study important parts of the star forming regions: Class II masers trace vicinities of the massive YSOs while class I masers are likely to trace more distant parts of the outflows where newer stars can form.
There are many methanol transitions which produce observed masers. This allows to use pumping analysis for estimation of the physical parameters in the maser formation regions and its environment, for the study of their evolution. Extensive surveys in different masing transitions allow to conclude on the values of the temperatures, densities, dust properties, etc. in the bulk of masing regions. Variability of the brightest masers is monitored during several years. In some cases it is probably caused by the changes of the dust temperature which follow variations in the brightness of the central YSO reflecting the character of the accretion process.
A unified catalogue of the class II methanol masers consisting of more than 500 objects is compiled. Analysis of the data shows that: physical conditions within the usual maser source vary considerably; maser brightness is determined by parameters of some distinguished part of the object - maser formation region; class II methanol masers are formed not within the outflows but in the regions affected by their propagation.
It is shown that the ”near” solutions for the kinematic distances to the sources can be used for statistical analysis. The luminosity function of the 6.7 GHz methanol masers is constructed. It is shown that improvement of the sensitivity of surveys can increase number of detected maser sources considerably.
The distribution of class II methanol masers in the Galaxy is constructed on the basis of estimated kinematic distances. It is shown that most of the sources are located in the Molecular Ring and that the dependence of the number of sources on the distance from the Galactic Center has significant peaks at the positions corresponding to the spiral arms.
A survey of CS(2-1) line emission tracing dense gas is performed at Mopra toward the positions of the brightest class II methanol masers. Velocity correlations between the maser and CS lines are analyzed. It is shown that the sources with l from 320 to 350 deg in which the masers are relatively blue-shifted, form a group which is located in the region of the Scutum-Centaurus spiral arm. This can reflect existence of a grand design, i.e., grouping of the sources with similar peculiarity of morphology or evolutionary stage of the massive star forming regions.
keywords:
masers; catalogs; surveys; stars: formation; ISM: clouds, evolution, kinematics and dynamics, structure; Galaxy: structure; radio lines: ISM1 Introduction
Methanol masers are traditionally divided into two classes. Although masers of both classes often co-exist in the same star-forming region, they are usually seen apart from each other. Class II masers are found in the vicinity of the massive YSOs while class I masers are believed to trace distant parts of the outflows from these YSOs.
Class II methanol masers display strong emission in transitions at 6.6 and 12.1 GHz ([Menten (1991)]). More than 2 dozens of weaker class II maser transitions are detected in several sources (see, e.g., [Sobolev et al. (2002)]). At present there exist 3 unified catalogues of class II methanol masers containing more than 500 objects ([Malyshev & Sobolev (2003)], [Xu, Zheng & Jiang (2003)] and [Pestalozzi, Minier & Booth (2005)]) and references to the initial data. Distinguishing feature of the [Malyshev & Sobolev (2003)] catalogue is that it contains data on several maser transitions and cross-references to the data on molecular shock tracers. Most of the class II maser sources were found toward positions of the IRAS sources while the blind surveys brought some detections in the places without other evidences of star formation. At present class II masers were found only in the high mass star forming regions ([Minier et al. (2003)]).
Class I methanol masers are less strong and widespread. Most of them were found in vicinities of class II maser sources (see, e.g., [Slysh et al. (1994)] and [Ellingsen (2005)]). There were extensive searches (e.g., [Slysh et al. (1994)] and [Val’tts et al. (2000)]) for class I sources but no unified catalogues of these objects do exist and no blind surveys were performed yet.
2 Determination of parameters of the high mass star forming regions
2.1 Class I methanol masers
The transitions of the J2 – J1E series at about 25 GHz in OMC-1 were the first methanol masers detected in the interstellar medium. Existence of the interferometry data ([Johnston et al. (1992)]) allowed construction of the models constraining characteristics of the turbulence in this source ([Sobolev, Wallin & Watson (1998), Sobolev, Watson & Okorokov (2003)]).
Analysis of existing observational data on class I methanol masers allows to distinguish 4 regimes differing by the series of the brightest (in terms of brightness temperature) line.
Most widespread maser regime is likely to have brightest lines which belong to the J-1 – (J-1)0E series. The lines 4-1 – 30E at 36.1 GHz and 5-1 – 40E at 84.5 GHz are likely to be a weak masers under normal conditions of the massive star forming region. Usually maser nature of the lines in this regime is difficult to prove observationally. Anyhow, there are cases when the line profiles contain narrow spikes and the maser nature is proved interferometrically. The sources Sgr B2, G30.8-0.1, and G1.6-0.025 can be considered as representatives of this maser regime ([Sobolev (1996)]).
In the other maser regime the lines of the J0 – (J-1)1A+ series become prevalent. Numerous sources manifest definitely maser lines arising in the 70 – 61A+ and J0 – (J-1)1A+ transitions at 44.1 and 95.2 GHz, respectively. Masers in the sources DR21W, NGC2264 and OMC-2 represent this regime ([Menten (1991)]). Preliminary theoretical analysis of the pumping shows that the lines of J0 – (J-1)1A+ series become brightest in the models with rather high beaming () and moderate column densities (Sobolev, Ostrovskii & Voronkov, in prep., presented in the poster at IAUS227).
Next maser regime is less widespread and is represented by the sources where the lines of the J2 – J1E series at about 25 GHz are the brightest. OMC-1 is the famous example of such sources ([Johnston et al. (1992)]) and some bright sources were found recently ([Voronkov et al. (2005)]). Lines of this series become brightest in the models with the high specific column densities ( [cmc])) and require relatively high temperatures ( K) and densities ( [cm).
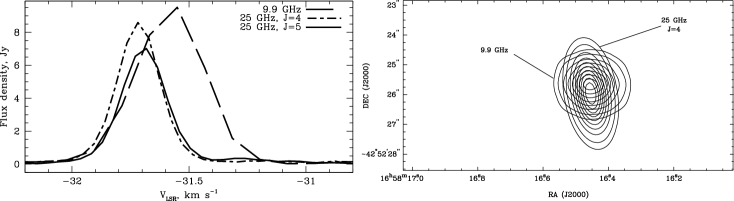
Existence of the forth maser regime with the brightest line at 9.9 GHz from the J-2 – (J-1)-1E series was previously uncertain. Recent ATCA observations have shown that this regime is actually realized in the sources W33A and G343.12-0.06 (see figure 1). Preliminary modelling shows that the 9-2 – 8-1E line at 9.9 GHz becomes brightest in the models with specific column densities which are as high as required for the previous regime but prefers greater beaming and either lower densities or higher temperatures ( K).
So, class I methanol masers are potentially a good probe of such physical parameters as the temperature, density and column density.
2.2 Class II methanol masers
Both observations and modelling of class II masers show that the 6.6 GHz transition always manifests the highest brightness temperature ([Malyshev & Sobolev (2003)], [Sobolev, Cragg & Godfrey (1997)]). Observations did not find significant differences in positions of the maser spots (see, e.g., [Menten et al. (1992)], [Sutton et al. (2001)]). So, there is basically only one known pumping regime of class II masers. However, ratios of the brightnesses of different maser lines show considerable dependence on the values of the physical parameters. This allows determination of the physical parameters in individual sources (on the basis of multi-transitional observations, e.g., [Sutton et al. (2001)], [Cragg et al. (2001)]) and construction of the model of the ”common” class II methanol maser source (on the basis of extensive surveys, e.g., [Cragg et al. (2004)] and [Ellingsen et al. (2004)]). Results of such studies are summarized in [Sobolev et al. (2002)] and [Cragg, Sobolev & Godfrey (2005)] and will not be considered here.
Different response of the maser fluxes to the changes of the physical parameters provides possibility to elucidate nature of the time variability and estimate physical parameters in the source via modelling of variability in the different maser lines. For example, interferometric studies of variability in the source G9.62+0.20 show that the changes in the different parts of the source are synchronized with the speed of light ([Goedhart et al. (2005)]). In this case the variability is most probably caused by the changes of the dust temperature which follow variations in the brightness of the central YSO reflecting the character of the accretion process.
3 Some topics of the methanol maser statistics
3.1 Distribution of the methanol masers in the Galaxy
Extensive surveys have shown that the radial velocities of class II methanol masers are usually coincident with those of associated molecular cores to within several km/s (see, e.g., [Malyshev & Sobolev (2003), Slysh et al. (1999)] and [Szymczak, Pillai & Menten (2005)]). This provides a possibility for making estimates of distances to these sources using models of rotation curves of the gas in the Galaxy (the kinematic distances). On the basis of such estimates several authors discussed the distribution of methanol maser sources in the Galaxy (see, e.g.,[van der Walt (1997), Slysh et al. (1999)] and [Pestalozzi, Minier & Booth (2005)]). It should be noted that for the most of the sources kinematic estimates are ambiguous and allow 2 solutions: ”near” and ”far” ones. Anyhow, it was firmly established that the most of methanol masers are situated in the Molecular Ring of the Galaxy.
We addressed the question of the kinematic distance ambiguity from the statistical point of view. Of course, sometimes the ”near” estimate is closer to the real distance to the source and sometimes the ”far” estimate appears to be more realistic. We looked at the extremes. This is reasonable because in the top view of the maser distribution there is a pronounced dip of the maser number density between the ”near” and ”far” distance domains.
Firstly, we assumed that the ”far” estimate of kinematic distance is correct. It was found that in this case the dependence of the average peak maser flux on the distance from the Sun is odd and shows general tendency to increase when the distances exceed 5 kpc. Such dependence is certainly unrealistic.
Secondly, we considered the dependence of the average peak maser flux on the distance from the Sun for the ”near” distance estimates. In this case there is a pronounced tendency of the decrease with the distance from the Sun. Taking into account that the weaker masers at greater distances are missed due to the limited sensitivity of the surveys we obtained the dependence which is quite close to the natural, i.e., fall which is proportional to the square of the distance from the Sun. So, confinement to the ”near” kinematic distances is likely to produce statistical results close to reality.
Guided by this hypothesis we constructed the radial dependence of the maser number density as a function of the distance from the Galactic Center which is shown in the figure 2. This dependence shows pronounced peaks at the distances which are close to those of the spiral arms in the current model of the Galaxy. Maser statistics shows that the lifetime of the methanol masers is rather limited (see, e.g.,[van der Walt (2005)] and [Szymczak, Pillai & Menten (2005)]). Hence, maser sources are a good tracers of regions of the early massive star formation which are likely to be concentrated to the spiral arms. So, the correlation which is found does look promising for the studies of the structure of our Galaxy.

Consideration of the selection effect related to the limited sensitivity of the surveys leaves the maser number density peaks at their places.
We also constructed the 6.6 GHz methanol maser luminosity function using ”near” distances. It was found that the population of masers is greatly dominated by the low luminosity sources and future sensitive surveys are likely to increase the number of the known sources substantially. It should be noted that the surveys in the regions of the spiral arm tangents are the most promising in the sense of new detections but provide little information for the studies of the structure of the Galaxy.
3.2 Statistics and the maser formation regions
Using the unified catalogue we studied the spread of the ratios of the brightnesses in the different maser transitions as well as the correlation between the maser ranges and the breadths of such molecular shock tracers as CS and SiO lines ([Malyshev & Sobolev (2003)]). It was shown that: physical conditions within the usual maser source vary considerably; maser brightness is determined by parameters of some distinguished part of the object - maser formation region; class II methanol masers are formed in the regions affected by the shock propagation.
3.3 Comparison of the methanol maser velocities with those of CS(2-1) line
We aimed on finding the relation between the bulk motions in the maser formation region with those of the dense gas of the ambient cloud. Observations show that the peak velocities of the different maser lines often do not coincide ([Caswell et al. (1995), Malyshev & Sobolev (2003)]) and the relative brightness of the peaks varies with time ([Goedhart, Gaylard & van der Walt (2004)]). In this situation the mean velocity of the maser formation region is better represented by the center of the range of velocities of the maser features. This should be true for the case when the source is strong enough.
In order to get the data on the CS(2-1) velocities of the brightest masers we carried out observations of 31 source using the Mopra antenna. This brought us 18 new detections and a collection of the better quality spectra. As a result we obtained accurate CS(2-1) velocities for practically all masers with the 6.6 GHz flux density exceeding 150 Jy.
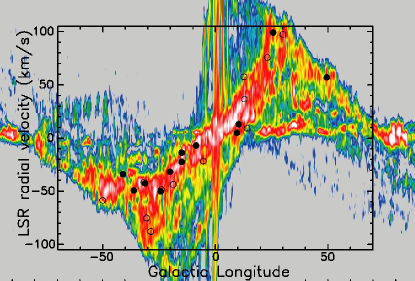
We assumed that the maser has significantly shifted velocity if the center of the maser range was apart from the CS(2-1) line center by more than 0.75 km/s. It was found that the difference in the numbers of the red-shifted and blue-shifted masers is statistically insignificant. However, the distributions of maser sources with the different sense of the shift display considerable difference. Figure 3 shows that the blue-shifted maser sources with galactic longitudes from 320o to 350o form a distinguished group which is located in the region of the Scutum-Centaurus spiral arm. This can reflect existence of a grand design, i.e., grouping of the sources with similar peculiarity of morphology or of the evolutionary stage of the massive star forming regions.
4 Conclusions
We have shown that the methanol masers represent a powerful diagnostic tool for the studies of the nature of the massive star formation regions and their distribution in the Galaxy.
Acknowledgements.
Russian coauthors are supported by the Ministry of education and science and RFBR under grant number 03-02-16433.References
- [Caswell et al. (1995)] Caswell, J.L., Vaile, R.A., Ellingsen, S.P. & Norris, R.P. 1995, MNRAS 274, 1126
- [Cragg et al. (2004)] Cragg, D.M., Sobolev, A.M., Caswell, J.L., Ellingsen, S.P. & Godfrey, P.D. 2004, MNRAS 351, 1327
- [Cragg et al. (2001)] Cragg, D.M., Sobolev, A.M., Ellingsen, S.P., Caswell, J.L., Godfrey, P.D., Salii, S.V. & Dodson, R.G. 2001, MNRAS 323, 939
- [Cragg, Sobolev & Godfrey (2005)] Cragg, D.M., Sobolev, A.M. & Godfrey, P.D. 2005, MNRAS 360, 533
- [Ellingsen (2005)] Ellingsen S.P. 2005, MNRAS 359, 1498
- [Ellingsen et al. (2004)] Ellingsen, S.P., Cragg, D.M., Lovell, J.E.J., Sobolev, A.M., Ramsdale, P.D. & Godfrey, P.D. 2004, MNRAS 354, 401
- [Goedhart, Gaylard & van der Walt (2004)] Goedhart, S., Gaylard, M.J. & van der Walt, D.J. 2004, MNRAS, 355, 553
- [Goedhart et al. (2005)] Goedhart, S., Minier, V., Gaylard, M.J. & van der Walt, D.J. 2005, MNRAS, 356, 839
- [Johnston et al. (1992)] Johnston, K.J., Gaume, R., Stolovy, S., et al. 1992, ApJ 385, 232
- [Malyshev & Sobolev (2003)] Malyshev A.V. & Sobolev A.M. 2003, A&ATr 22, 1
- [Menten (1991)] Menten K.M. 1991, ApJ (Letters) 380, L75
- [Menten et al. (1992)] Menten, K.M., Reid, M.J., Pratap, P., Moran, J.M. & Wilson, T.L. 1992, ApJ (Lett) 401, L39
- [Minier et al. (2003)] Minier V., Ellingsen S.P., Norris R.P. & Booth R.S. 20053, A&A 403, 1095
- [Pestalozzi, Minier & Booth (2005)] Pestalozzi M., Minier V. & Booth R. 2005, A&A 432, 737
- [Slysh et al. (1994)] Slysh, V.I., Kalenskii S.V., Val’tts I.E. & Otrupcek, R. 1994, MNRAS 268, 464
- [Slysh et al. (1999)] Slysh, V.I., Val’tts, I.E., Kalenskii, S.V., Voronkov, M.A., Palagi, F., Tofani, G. & Catarzi, M. 1999, A&AS 134, 115
- [Sobolev (1996)] Sobolev, A.M. 1996, ASP Conf.Ser. 102, 68
- [Sobolev, Cragg & Godfrey (1997)] Sobolev, A.M., Cragg, D.M. & Godfrey, P.D. 1997, MNRAS 288, 39
- [Sobolev et al. (2002)] A.M. Sobolev, A.B. Ostrovskii, A.V. Malyshev, D.M. Cragg, P.D. Godfrey, E.C. Sutton, W.D. Watson, S.P. Ellingsen & J.L. Caswell 2002, ASP Conf.Ser. 206, 179
- [Sobolev, Wallin & Watson (1998)] Sobolev, A.M., Wallin, B.K. & Watson, W.D. 1998, ApJ 498, 763
- [Sobolev, Watson & Okorokov (2003)] Sobolev, A.M., Watson, W.D. & Okorokov, V.A. 2003, ApJ 590, 333
- [Sutton et al. (2001)] Sutton, E.C., Sobolev, A.M., Ellingsen, S.P., Cragg, D.M., Mehringer, D.M., Ostrovskii, A.B. & Godfrey, P.D. 2001, ApJ 554, 173
- [Szymczak, Pillai & Menten (2005)] Szymczak, M., Pillai, T. & Menten, K.M. 2005, A&A 434, 613
- [Val’tts et al. (2000)] Val’tts I.E., Ellingsen, S.P., Slysh, V.I., Kalenskii S.V., Otrupcek, R. & Larionov, G.M. 2000, MNRAS 317, 315
- [van der Walt (1997)] van der Walt, D.J. 1997, A&A 322, 307
- [van der Walt (2005)] van der Walt, D.J. 2005, MNRAS 360, 153
- [Voronkov et al. (2005)] Voronkov, M.A., Sobolev, A.M., Ellingsen, S.P., Ostrovskii, A.B. & Alakoz, A. 2005, Ap&SS 295, 217
- [Xu, Zheng & Jiang (2003)] Xu Y., Zheng X.-W. & Jiang D.-R. 2003, ChJAA 3, 49