XMM-Newton observations of PSR B1259–63 near the 2004 periastron passage
Abstract
PSR B1259–63 is in a highly eccentric 3.4 year orbit with a Be star and crosses the Be star disc twice per orbit, just prior to and just after periastron. Unpulsed radio, X-ray and gamma-ray emission observed from the binary system is thought to be due to the collision of pulsar wind with the wind of Be star. We present here the results of new XMM-Newton observations of the PSR B1259–63 system during the beginning of 2004 as the pulsar approached the disc of Be star. We combine these results with earlier unpublished X-ray data from BeppoSAX and XMM-Newton as well as with ASCA data. The detailed X-ray lightcurve of the system shows that the pulsar passes (twice per orbit) through a well-defined gaussian-profile disk with the half-opening angle (projected on the pulsar orbit plane) . The intersection of the disk middle plane with the pulsar orbital plane is inclined at to the major axis of the pulsar orbit. Comparing the X-ray lightcurve to the TeV lightcurve of the the system we find that the increase of the TeV flux some 10–100 days after the periastron passage is unambiguously related to the disk passage. At the moment of entrance to the disk the X-ray photon index hardens from up to before returning to the steeper value . Such behaviour is not easily accounted for by the model in which the X-ray emission is synchrotron emission from the shocked pulsar wind. We argue that the observed hardening of the X-ray spectrum is due to the inverse Compton or bremsstrahlung emission from 10-100 MeV electrons responsible for the radio synchrotron emission.
keywords:
pulsars : individual: PSR B1259–63 – X-rays: binaries – X-rays: individual: PSR B1259–631 Introduction
PSR B1259–63 is a 48 ms radio pulsar in a highly eccentric (e0.87), 3.4 year orbit with a Be star SS 2883 (Johnston et al., 1992). The system’s distance from Earth is kpc (Johnston et al., 1994), note, however, that is uncertain by a factor of 2 based on radio measurements (see, e.g., Manchester, Taylor, & Lyne 1993).
Be stars are well-known to be sources of strong highly anisotropic matter outflow. Both a dilute polar wind and a denser equatorial disc have been invoked to reconcile models for infra-red, ultra-violet and optical observations (Waters et al., 1988). Timing analysis of the PSR B1259–63 system shows that the disc of Be star is tilted with respect to the orbital plane (Wex et al., 1998; Wang et al., 2004). The properties of the radio emission from the system are very different close to and far from the periastron. Radio observations of the 1994, 1997 (Johnston et al., 1999), 2000 (Connors et al., 2002), and the 2004 (Johnston et al., 2005) periastron passages show that when the pulsar is far from periastron the observed radio emission is comprised entirely in highly linearly polarized pulsed emission from the pulsar itself with an intensity practically independent of the pulsar orbital position (McClure-Griffiths et al., 1998). But, starting about 100 days before periastron, depolarization of the pulsed emission occurs, the dispersion measure and the absolute value of the rotation measure increase while the flux density decreases. The pulsed radio emission then disappears entirely as the pulsar enters the disc and is hidden behind it (relative to the observer) approximately 20 days before the periastron passage. Shortly before the disc crossing unpulsed radio emission appears and within several days sharply rises to a peak which is more than ten times higher than the intensity of the pulsed emission far from the periastron. Afterward the unpulsed flux slightly decreases, as the pulsar passes through periastron before reaching a second peak just after the pulsar crosses the disc for the second time. The unpulsed radio emission is detected until at least 100 days after the periastron passage. (Johnston et al., 1999, 2005; Connors et al., 2002).
The first detection of the X-rays from PSR B1259–63 system was done by ROSAT in 1992 (Cominsky et al., 1994). The most recent published observations of the system in X-rays were carried out with the ASCA satellite in 1994 and 1995 (Kaspi et al., 1995; Hirayama et al., 1999). These observations show that X-ray emission is approximately twice as high at the time of the disc crossing than at periastron. In soft gamma-rays the system was observed only after the periastron passage with CGRO/OSSE and INTEGRAL/ISGRI (Grove, 1995; Shaw et al., 2004). The combined soft gamma- and X-ray spectrum is consistent with a power law of photon index . This index also coincides with the radio spectral index of the unpulsed emission. No pulsed X-ray emission was detected from the system. With the standard epoch-folding method the upper limit to a pulsed component in 2 – 10 Kev energy range was estimated to be about 10% of the unpulsed component close to the periastron, and to about 40% during the apastron (Kaspi et al., 1995; Hirayama et al., 1999). Note that search for the pulsations in P - Ṗ space allowed Kaspi et al. (1995) to reduce an upper limit close to the periastron to less than 2% under a certain assumptions on the shape of pulse profile.
The 2004 periastron passage was observed in TeV gamma-rays by HESS (Aharonian et al., 2005). TeV lightcurve of the source shows an unexpected behaviour. Contrary to the prediction that the TeV flux should be maximum at the periastron (Kirk et al., 2002), the flux apparently has a local minimum around this moment.
Several theoretical models were put forward to explain the behaviour of the X-ray lightcurve of the system. In the model of Tavani & Arons (1997), the enhancement of synchrotron X-ray emission during the disk passage is attributed to enhancement of magnetic field at the position of the contact surface of pulsar and stellar winds. In the model of Chernyakova & Illarionov (1999, 2000) the enhancement of the inverse Compton X-ray emission during the disk passage is supposed to be due to the effect of the macroscopic mixing of the stellar and pulsar winds in the disk which effectively enhances the escape time of high-energy electrons responsible for the observed emission.
Typical energies of electrons responsible for the X-ray emission are TeV in Tavani & Arons (1997) model while in Chernyakova & Illarionov (1999) model MeV. One can, in principle, distinguish between the two models by comparing the details of radio, X-ray and TeV lightcurve of the system. We have organized a cycle of five XMM-Newton observations as the pulsar approached the 2004 periastron. In this paper we present the results of our observations along with other XMM-Newton observations of the system not previously published. For the completeness we also include the analysis of the previously unpublished BeppoSAX data. The 2004 periastron passage was extensively observed in radio (Johnston et al., 2005) and TeV (Aharonian et al., 2005) bands. Combination of the radio, X-ray and TeV data opens up a possibility, to study the evolution of the spectrum of PSR B1259–63 system over some 12 decades in energy.
Our analysis of large X-ray data set enables, for the first time, to constrain the geometrical parameters of the disk of Be star, such as the opening angle and orientation. Comparing the TeV and X-ray lightcurves we find that the increase of the TeV flux some 10 to 100 days after the periastron passage is unambiguously related to the pulsar passage through the Be star disk for the second time. This challenges the conventional interpretation of the observed TeV emission as the inverse Compton emission from the pulsar wind electrons.
Another surprising result of our analysis that is not predicted in the theroetical models cited above is the persistently hard X-ray spectrum (photon index ) observed during the 10-day period when the pulsar enters the disk.
This paper is organized as follows: in Section 2 we describe the details of the XMM-Newton and BeppoSAX data analysis. The results are presented in Section 3, and discussed in Section 4.
2 Observations and Data Analysis
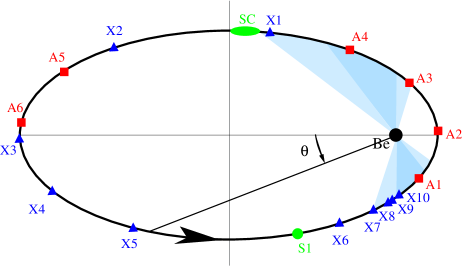
In Figure 1 we show a schematic drawing of the pulsar orbit along with the approximate location of the pulsar position during XMM-Newton, BeppoSAX, and ASCA observations. The X-ray observations are more-or-less homogeneously distributed over the whole range of pulsar orbital phase . The figure also shows the location of the Be star disk (parameters of the disk are found below from the analysis of the X-ray data). One can see that the set of observations denoted as X6 – X10 enables to study the entrance to the disk in great details.
2.1 XMM-Newton observations
The log of the XMM-Newton data analyzed in this paper is presented in Table 1. Observations X6 – X10 were obtained as part of the 2004 periastron campaign and we have also used all other XMM-Newton observations of the system, which are now public (X1 – X5). In the Table negative denotes the number of days before the date of 2004 periastron passage (2004 March 7), and positive values correspond to the number of days after the 2000 periastron (2000 October 17). is the orbital phase counted as shown in Fig. 1.
| Data | Date | MJD | Exposure | ||
|---|---|---|---|---|---|
| Set | (days) | (deg) | (ks) | ||
| X1 | 2001-01-12 | 51921.73 | 87.2 | 320.8 | 11.3 |
| X2 | 2001-07-11 | 52101.31 | 266.7 | 342.9 | 11.6 |
| X3 | 2002-07-11 | 52467.24 | 604.1 | 0.5 | 41.0 |
| X4 | 2003-01-29 | 52668.27 | 403.1 | 9.31 | 11.0 |
| X5 | 2003-07-17 | 52837.53 | 233.9 | 19.5 | 11.0 |
| X6 | 2004-01-24 | 53028.79 | 42.6 | 57.4 | 9.7 |
| X7 | 2004-02-10 | 53045.43 | 25.0 | 73.4 | 5.2 |
| X8 | 2004-02-16 | 53051.39 | 20.0 | 83.1 | 7.7 |
| X9 | 2004-02-18 | 53052.02 | 18.4 | 86.5 | 5.2 |
| X10 | 2004-02-20 | 53055.82 | 15.6 | 93.2 | 6.9 |
The XMM-Newton Observation Data Files (ODFs) were obtained from the on-line Science Archive111http://xmm.vilspa.esa.es/external/xmm_data_acc/xsa/index.shtml; the data were then processed and the event-lists filtered using xmmselect within the Science Analysis Software (sas) v6.0.1. In all observations the source was observed with the MOS1 and MOS2 detectors. The X1 – X5 observations were done in the Full Frame Mode, while the 2004 observations were performed in the Small Window Mode, to minimize the pile-up problems. For the X6 – X10 observations PN data are also available. In all observations a medium filter was used.
The event lists for spectral analysis were extracted from a 45′′ radius circle at the source position for the X1 – X5 observations, and from a 22.5′′ radius circle for MOS 1,2 observations in Small Window Mode (X6 – X10). For the PN instrument a region of 35′′ around the source position was chosen. Background photons were collected from a region located in the vicinity of the source with the same size area as the one chosen for the source photons.
For the spectral analysis, periods of soft proton flares need to be filtered out. To exclude them we have built light curves with a hundred second binning and excluded all time bins in which the count rate above 10 keV was higher than 1.5 cnt/s. The source countrate in 1 – 10 keV energy range varied from about 0.07 to 1.2 cts/s for MOS instruments, and from 0.4 to 4 cts/s for PN. Data from MOS1, MOS2 and, when available, PN detectors were combined in the spectral analysis to achieve best statistics.
2.2 BeppoSAX observations
Table 2 lists the observations of PSR B1259–63 made with BeppoSAX around the 1997 periastron passage. In the Table denotes the number of days before or after the 1997 periastron passage.
We used data of MECS instruments aboard BeppoSAX observatory which provides the coverage in the energy range 1.5-11.0 keV. Reduction of MECS data was done with the help of standard tasks of LHEASOFT/FTOOLS 5.2 package according to recommendations of BeppoSAX Guest Observer Facility222http://heasarc.gsfc.nasa.gov/docs/sax/abc/saxabc/saxabc.html, http://www.asdc.asi.it/bepposax/software/cookbook/. Spectrum of the source was obtained extracting events from a circle of radius around the source position. Spectrum of the instrument background was estimated considering events from a circle of the same radius away from the source. Typically the source provided several hundreds of counts per observation. Response matrices (RMF and ARF) of MECS detectors were taken from HEASARC archive333http://heasarc.gsfc.nasa.gov/FTP/sax/cal/responses. Corrections of photons arrival time to the Solar system barycenter for subsequent usage of the event lists in timing analysis were done with the help of tasks from SAXDAS package444http://www.asdc.asi.it/bepposax/software/saxdas/index.html.
| Data | Date | MJD | Exposure | ||
|---|---|---|---|---|---|
| Set | (days) | (deg) | (ks) | ||
| S1 | 1997-03-22 | 50529.63 | 68.31 | 44.9 | 28.622 |
| S2 | 1997-09-02 | 50693.75 | 95.81 | 322.9 | 16.985 |
| S3 | 1997-09-08 | 50699.44 | 101.50 | 324.1 | 53.555 |
| S4 | 1997-09-17 | 50708.08 | 110.14 | 325.9 | 51.301 |
| S5 | 1997-09-25 | 50716.05 | 118.11 | 327.3 | 28.719 |
We have checked that all the spectra obtained in the S2 – S5 observations are consistent with each other, and combined them in order to improve statistics. This combined spectrum we denote as SC hereafter.
3 Results
3.1 Imaging Analysis
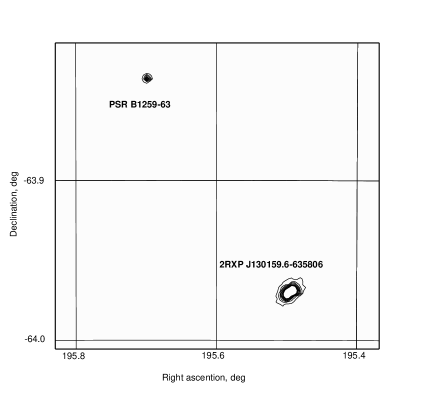

In the XMM-Newton field of view during its PSR B1259–63 observation program, two sources were clearly detected (see Fig. 2 for the contour plot of XMM-Newton field of view for the MJD 53029 (X6) observation). Besides PSR B1259–63 itself there is second source, which we have identified as 2RXP J130159.6-635806. Detailed analysis of this source are presented in Chernyakova et al. (2005). In this paper it is shown in particular, that 2RXP J130159.6-635806 is highly variable, with an intensity during flares which is several times larger than the peak intensity of PSR B1259–63. Therefore, although many observations of PSR B1259–63 have been made with RXTE, the fact that it is a non-imaging telescope means that it is extremely difficult to determine the flux from PSR B1259–63 alone. We therefore do not use numerous RXTE observations of the 2004 periastron passage, presented in Shaw et al. (2004). Note that despite in the Shaw et al. (2004) all RXTE observations are analysed, the authors were able to use in their analysis only data simultaneous to INTEGRAL observations, when it was clear that influence of 2RXP J130159.6-635806 is small.
3.2 The X-ray lightcurve
The upper panel of Fig. 3 shows the X-ray lightcurve of the system. For comparison we also show in the same Figure TeV lightcurve of 2004 HESS observation (Aharonian et al., 2005) and radio (Johnston et al., 1999; Connors et al., 2002; Johnston et al., 2005) lightcurves of different years periastron passages.
The X-ray flux from the source, in agreement with previous observations, was observed to be highly variable. The 1 – 10 keV flux is at minimum near apastron (observation X3), and has maximum more than 20 times larger, 18 days before periastron (X9). During observations X5, X6, and X7, the intensity of the emission increased, as the pulsar approached periastron and the Be star disc. Five days after X7 observation the flux increased by a factor of 4. During the next two days the intensity continued to increase, and reached its peak value at X9. The next observation (X10) was done only three days later, and the observed flux was already one and a half times lower.
Comparison of X-ray and radio lightcurves shows that the X-ray flux from the system varies in a more regular way than the radio flux: the X-ray data points from different periastron passages lie more-or-less on the same curve. Rapid grows of the X-ray flux found in our XMM-Newton observations X6 – X10 is correlated with the rapid growth of the unpulsed radio emission from the system. The growth of radio and X-ray flux at these phases can be attributed to the pulsar entering the Be star disk.
Unfortunately, TeV observations start somewhat later and it is not possible to see whether the TeV flux growth during the pre-periastron disk crossing. However, simple geometrical argument tells that the orbital phase at which the pulsar should enter the disk for the second time should be shifted by relative to the first entrance. From Fig. 3 one can infer that the first pre-periastron entrance falls roughly between the phases . Thus, the pulsar has to enter the disk again between the phases . Surprisingly, one can clearly see from the middle panel of Fig. 3 that the TeV flux grows in this phase interval.
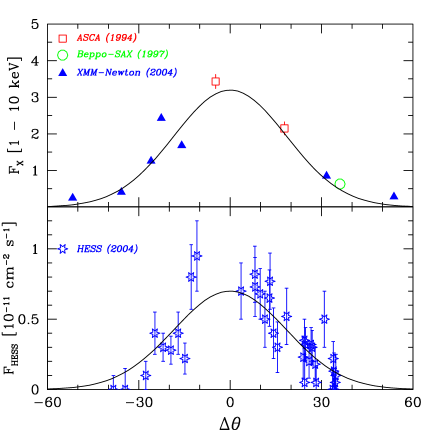
The growth rate of the X-ray flux between the phases is remarkably close to the decrease rate at the phases . This enables us to make a conjecture that the observed decrease of the X-ray flux can be associated to the exit of the pulsar from the disk. To test this conjecture we superimpose the pre-periastron X-ray and TeV lightcurves over the post-periastron lightcurves by shifting the phase of the post-periastron data points by . For X-rays we have used only data from the rise () and the fall () periods. The result is shown in Fig. 4. One can see that in such representation the rise and decrease of both X-ray and TeV flux from the system can be well fitted with a gaussian curve . We find that the best fit is achieved with the parameter choice , (the coordinate along the X-axis of Fig. 4 is, in fact ).
The most obvious explanation to the shape of the X-ray and TeV lightcurves shown in Fig. 4 is that pulsar crosses the thick disk with the half opening angle . The “middle” plane of the disk intersects the pulsar orbital plane along the line . The intersection of the disk with the above parameters with the pulsar orbital plane is shown schematically in Fig. 1 by a shaded area. Because of the exponential profile, the disk has no fixed boundary. Denser shading in Fig. 1 corresponds to the one opening angle of the disk, while lighter shading corresponds to two opening angles. The disk is also shown by the same shading in the Fig. 3. From this figure one can see that although the disk appears quite symmetric in terms of the orbital phase , it is highly asymmetric in terms of the time which measures days from the periastron passage. For example, during the second (post-periastron) disk passage, the rise phase () of X-ray and TeV lightcurves takes just some 10 days, while the decay () takes about 100 days.
3.3 Timing Analysis
For each of the five PN event files in 0.2 – 10 keV energy range with a 6 ms time resolution we searched for a possible pulsation around the nominal 47.6 ms period using the epoch-folding technique (efsearch tool from the XRONOS package). From the individual observations the best upper limit on pulsation at a period of 47.6 ms is 9%, compatible with previous similar analysis made with ASCA (Kaspi et al., 1995; Hirayama et al., 1999). In order to perform a deeper search for pulsations we combined neighboring XMM observations (namely X7-X10, see. Table 1). As the time span of these observations covers only small fraction of the binary orbit we did not make corrections to the binary motion of the neutron star. Usage of the combined XMM data improves the upper limit to 2%.
Data of BeppoSAX/MECS (1.5-11 keV) observations also were searched for pulsations. For deeper search we combined observations S2-S5 (see Table 2). Due to small time period of performed observations we did not make correction for binary motion of the neutron star. In spite of considerably smaller effective area of MECS instruments of BeppoSAX observatory, the effective exposure time of observations of the source was much larger, which resulted in a comparable upper limit on X-ray pulsation fraction. We have not found pulsations with 3- upper limit at 2%.
3.4 Spectral Analysis
The spectral analysis was done with NASA/GSFC XSPEC software package. In Fig. 5 the folded and unfolded spectra of PSR B1259–63 for SC, X3, X6, and X9 observations are shown.

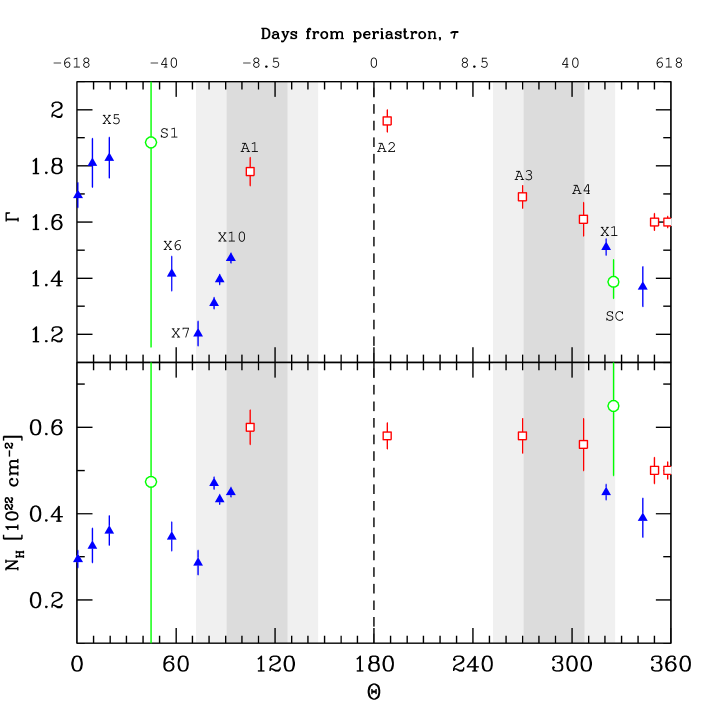
A simple power law with a photoelectrical absorption describes the data well, with no evidence for any line features. In Table 3 we present the results of the three parameter fits to the XMM-Newton data in the 0.5 – 10 keV energy range. The uncertainties are given at the statistical level and do not include systematic uncertainties. The graphical representation of the evolution of the PSR B1259–63 spectral parameters along the orbit is given in Figure 6 which includes data from the BeppoSAX and XMM-Newton observations, and those from ASCA (taken from Hirayama et al. (1999)).
| Data | (1-10 keV) | (dof) | ||
|---|---|---|---|---|
| Set | erg s-1 | ( cm-2) | ||
| S1 | 1.36 | 1.88 | 0.47 | 0.814(201) |
| SC | 6.31 | 1.39 | 0.65 | 0.898(813) |
| X1 | 8.51(30) | 1.51(3) | 0.45(2) | 0.97 (341) |
| X2 | 2.81(23) | 1.36(7) | 0.39(4) | 1.02 (122) |
| X3 | 1.04(49) | 1.69(4) | 0.29(2) | 0.88 (207) |
| X4 | 1.82(14) | 1.82(7) | 0.36(3) | 1.01 (109) |
| X5 | 0.99(9) | 1.80(8) | 0.32(4) | 0.80 ( 62) |
| X6 | 2.47(17) | 1.41(6) | 0.35(3) | 0.96 (151) |
| X7 | 4.05(23) | 1.20(4) | 0.28(3) | 0.95 (154) |
| X8 | 12.59(34) | 1.31(2) | 0.47(1) | 1.12 (614) |
| X9 | 24.27(56) | 1.39(2) | 0.43(1) | 1.07 (737) |
| X10 | 16.79(37) | 1.47(2) | 0.45(1) | 0.88 (772) |
∗ Number in parentheses represent 68% confidence interval uncertainties in the last digit quoted.
In Figure 7 we show contour plots of versus photon spectral index , holding the 1 – 10 keV flux fixed at the values given in Table 3. The contours plotted are the 68%, 90%, and 99% confidence levels. For the X5 observation the values of and are consistent with X4 observation, and we omitted the X4 contours to keep the Figure clear.
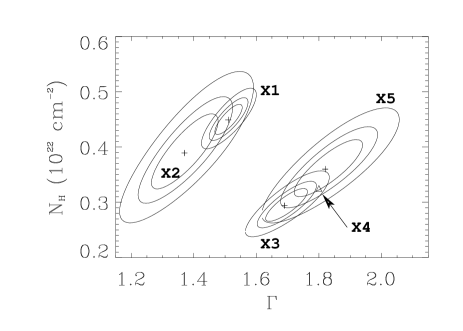
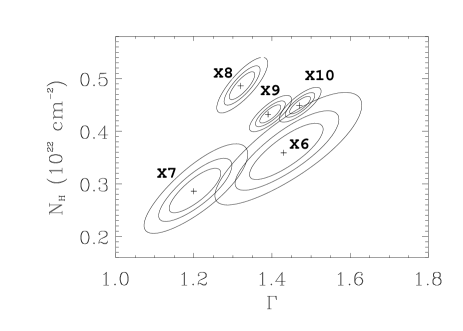
One can see that the variation of as a function of orbital phase is correlated with the Be star disk crossing. No variations of are observed for the XMM-Newton observations X2 to X7 which all fall outside the disk (assuming the disk parameters found in Section 3.2). The mean value of of during these observations is cm-2. However, the observations X8, X9, X10 and X1 are characterized by absorption which is higher by a factor of about 1.5, cm-2. Thus, the hydrogen column density remains high starting from about 20 days before the periastron till at least 87 days after periastron.
The behaviour of the spectral slope as a function of the orbital phase found in XMM observations differs from the one found in ASCA observations. Whereas in 1994 – 1995 the spectrum at apastron was found to be significantly harder than during periastron, XMM-Newton observations show much softer spectrum at the apastron with the spectral slope close to the ASCA periastron value.
The most remarkable feature of the spectral evolution of the system is the hardening of the X-ray spectrum close to the moment when pulsar enters the Be star disk at the phase . One can see that the decrease of the photon index is simultaneous with the onset of the rapid growth of the X-ray flux. To the best of our knowledge, such behaviour was not predicted in any of existing models of X-ray emission from the system. Moreover, the observed values during the observations X6 – X10 are difficult to reconcile with the models of synchrotron or inverse Compton emission from shock-accelerated electrons because of the too hard electron spectrum implied. Possible error in determination of due to the uncertainty in determination of (see Fig. 7) is too small to allow for at least for observations X7 – X9.
4 Discussion
In all theoretical models of unpulsed emission from PSR B1259–63 the collision of relativistic pulsar wind with non-relativistic wind of the Be star plays a crucial role. Due to the interaction of the winds a system of two shock waves forms between the stars. Close to the Be star and to the pulsar both winds are supposed to be radial but after passing the shocks particles turn and start to flow along the contact surface, losing their energy via synchrotron and inverse Compton (with the seed photons being the Be star soft photons) emission.
In the model of Chernyakova & Illarionov (1999, 2000) (CI) the observed X-ray emission is due to inverse Compton scattering of soft photons from the Be star on the same electron populaiton that produce the non-pulsed radio emission from the system. The intensity of observed unpulsed X-ray and radio emission depends strongly on the flow velocity of the relativistic particles beyond the shock. Slower drift velocity leads to the higher concentration of the relativistic electrons beyond the shock and higher X-ray and radio luminosity. Decrease of the drift velocity during the pulsar passage through the disk is caused by the macroscopical mixing of pulsar wind with the stellar wind.
Main prediction of this model is the correlation of X-ray with the radio lightcurves of the system. Although different quality of X-ray and radio lightcurves does not allow to make definitive conclusions about radio-X-ray correlations, our XMM-Newton observations show that the onset of rapid increase of the X-ray flux is simultaneous with appearance of the unpulsed radio emission from the system (see Fig 3).
The X-ray inverse Compton emission in the CI model is produced by electrons with rather moderate gamma-factors, while the gamma-factors of radio-synchrotron-emitting electrons are around . The synchrotron/inverse Compton cooling times for such electrons are
| (1) |
Both are large compared to the typical adiabatic cooling (or escape) time s ( is the characteristic size of the emission region, and v is the velocity of the flow along the contact surface). Another important time scale for the electrons in the energy range relevant in the CI model is the Coulomb loss scale
| (2) |
As the pulsar enters the disk, the density of the stellar wind increases. Typical estimates of the wind denisty at the pulsar location (assuming the radial profile ) result in the density estimate cm-3. Thus, inside the disk Coulomb cooling time is comparable to the escape time.
This effect leads to the modification of electron spectrum at the energies below the so-called “Coulomb break” energy at which :
| (3) |
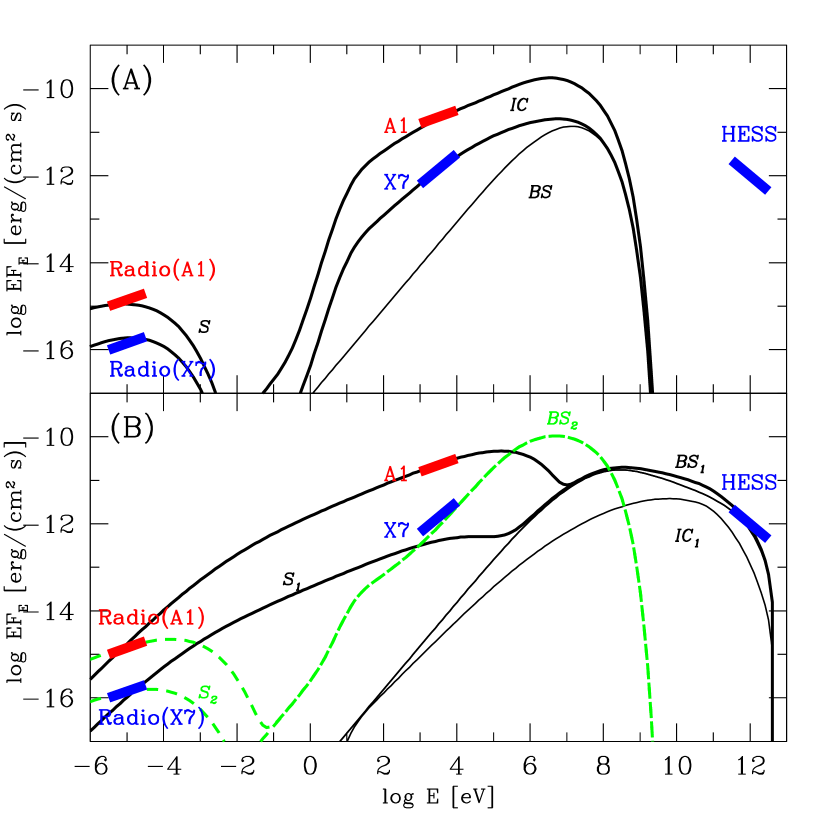
Namely, since the Coulomb loss rate is energy-independent, the electron acceleration spectrum with the spectral index hardens to below the break energy. This naturally leads to the hardening of the spectrum of inverse Compton X-ray emission at the moment when the pulsar enters the disk, as it is shown in Fig. 8a. One can note that the Coulomb break energy (3) is close to the energy of the X-ray emitting photons. This means that the X-ray photon index is very sensitive to the slight changes of the density and/or of the outflow velocity (see Fig. 8a in which the two spectra are calculated for and ). Since both vary during the disk passage (it is assumed that within the disk pulsar and stellar winds are macroscopically mixed), numerical modelling is required to predict the time evolution of the X-ray spectral index. We leave the detailed modelling of this for future work (Chernyakova & Neronov, 2006).
In the original CI model, only electorns with typical gamma-factors of 10-100 are considered. The presence of protons with comparable gamma-factors at the contact surface would lead to the generation of TeV emission during the disk passage which is due to the proton-proton interactions in the disk (see Kawachi et al. (2004)). Macroscopic mixing of the pulsar and stellar wind will lead to the increase of the proton-proton interaction rate in the disk, which can explain the form of the TeV lightcurve of the system.
In the model of Tavani & Arons (1997) (TA) the X-ray emission is the synchrotron emission from shock-accelerated electrons of the pulsar wind. Typical gamma-factors of the X-ray emitting electrons are . Modulation of the X-ray flux from the source during the disk and periastron passage is due to the combined effect of displacement of the contact surface by the disk (which leads to the variation of the magnetic field strength) and the increase of the inverse Compton energy loss close to the periastron.
One of the main predictions of TA model is steepening of the X-ray spectrum during the disk and periastron passage. The effect is due to the fact that synchrotron and/or inverse Compton cooling time of X-ray emitting electron becomes comparable or shorter than the time needed to escape from the emission region. However, the observed behaviour of the spectrum is quite opposite: the entrance to the disc is accompanied by the hardening of the spectrum.
The values of the photon index found in the observations X6 – X10 are too hard to be explained with the synchrotron emission from shock-accelerated electrons which normally result in the electron spectra with power-law index and, correspondingly in synchrotron spectra with photon index . Of course, over a large fraction of the pulsar orbit the synchrotron cooling time is larger than the time needed to escape from the emission region along the contact surface. Thus, if one assumes that the production spectrum of high-energy electrons responsible for the X-ray emission is harder than , (if, e.g. electrons originate in the cold pulsar wind with the bulk Lorentz factor ), it is possible, in principle, to obtain spectra which are harder than . However, in this case one expects to observe the very hard X-ray spectrum with over most of the pulsar orbit.
Within the TA model radio synchrotron emission originates from different population of electrons than the X-ray synchrotron emission (radio is convensionally attributed to shock-accelerated stellar wind electrons, while X-ray flux is emitted by the pulsar wind electrons). Although it is not possible to explain the hardening of the X-ray spectral index by the changes in the pulsar wind electron spectrum, one can try to ascribe the observed hardening to the contribution from the shocked stellar wind electrons. The X-ray spectrum with photon index harder than is natural if there is a bremsstrahlung contribution to the X-ray flux. The increase of the density of stellar wind inside the disk can lead to the increase of bremsstrahlung luminosity.
The estimate of the bremsstrahlung loss time
| (4) |
shows that for radio emitting electrons it is orders of magnitude shorter than the synchrotron cooling time (see (4)). Thus, the bremsstrahlung luminosity should be much higher than the radio synchrotron luminosity. From Fig. 8 one can see that a satisfactory fit to the broad-band spectrum can be obtained assuming the disk density cm-3. It is interesting to note that bremsstrahlung can also explain the behaviour of the TeV lightcurve in this case, if one assumes the possibility of mixing of the pulsar wind electrons with the pulsar disk medium (similar to the one assumed in the CI model).
The bremsstrahlung model faces, however, a serious overall energetics problem. From Fig. 8b one can see that the total bremsstrahlung luminosity is at least 2 orders of magnitude higher than the X-ray luminosity at the moment of X7 observation, erg/s (see Fig. 3). As it is discussed above, the energy loss rate of mildly relativistic electrons responsible for the bremsstrahlung emission is dominated by the Coulomb losses. Comparing (4) to (2) one can see that the Coulom loss rate is still 2-3 orders of magnitude higher than the bremsstrahlung luminosity. Thus, to obtain the X-ray bremsstrahlung flux at the level of erg/s one has to assume that the power injected into the MeV electrons is about erg/s which is much higher than the spin-down luminosity of the pulsar erg/s.
5 Conclusions
In this paper we have presented the XMM-Newton observations of the pulsar PSR B1259-63 during its 2004 periastron passage near the companion Be star SS 2883. Combining our observations with the previous X-ray observations from XMM-Newton, BeppoSAX and ASCA we produced the detailed lightcurve of the system over the wide range of the orbital phases.
Using the large X-ray data sample we were able to constrain the geometry of the Be star disk. In particular, we have found that the half-opening angle of the disk (projected on the pulsar orbital plane) is and that the line of intersection of the disk with the pulsar orbital plane is inclined at about with respect to the major axis of the pulsar orbit.
Inspection of the X-ray and TeV lightcurves of the system has revealed correlation of the X-ray and TeV flux variations. Our analysis shows that the variations of the TeV flux some 10-100 days after the periastron passage can be well fit with the gaussian curve whose parameters coincide with the parameters of the disk found from the X-ray analysis (center at , half-width ) (see Fig. 4). If the observed behaviour of the flux is indeed due to the influence of Be star disk, it can not be explained within the inverse Compton scattering model of TeV emission from the system.
Our XMM-Newton observations which were done during the period of first pulsar entrance to the disk (some 40 to 20 days before the periastron) revealed quite unexpected evolution of the spectrum of X-ray emission. In particular, the X-ray spectral slope hardened from down to roughly at the onset of the rapid growth of the X-ray luminosity. This behaviour can not be explained within the synchrotron model of X-ray emission from the system. We have shown that the observed hardening can be the result of the hardening of electron spectrum due to the Coulomb losses in the disk in the model where X-ray emission is the inverse Compton emission from the population of electrons responsible for the radio synchrotron emission. Otherwise, the hardening can be caused by the increase of the bremsstrahlung emission from these electrons. However, the bremsstrahlung problem faces a serious energy balance problem.
6 Acknowledgments
The authors acknowledge useful discussions with F. Aharonian and V. Beskin. Authors are grateful to V. Kaspi for helpful comments. We are grateful to L. Foschini for helpful advices on the XMM-Newton data analysis and thank M. Revnivtsev for the help with the BeppoSAX data reduction. MC thank M. Türler for the help with figure production. AL acknowledges the support of RFFI grant 040217276.
References
- Aharonian et al. (2005) Aharonian F. et al., A&A, 442, 1
- Ball et al. (1999) Ball L., Melatos A., Johnston S., Skjæraasen O., 1999, ApJ, 514, L39
- Chernyakova & Illarionov (1999) Chernyakova M., Illarionov A., 1999, MNRAS, 304, 359
- Chernyakova & Illarionov (2000) Chernyakova M., Illarionov A., 2000, ApSS, 274, 177
- Chernyakova et al. (2005) Chernyakova M., Lutovinov A., Rodriguez J., Revnivtsev M., 2005, MNRAS, 364, 455
- Chernyakova & Neronov (2006) Chernyakova M., Neronov A., 2006, in preparation
- Cominsky et al. (1994) Cominsky L., Roberts M., Johnston S., 1994, ApJ, 427, 978
- Connors et al. (2002) Connors T.W., Johnston S., Manchester R. N., McConnell D., 2002, MNRAS, 336, 1201
- Grove (1995) Grove J. E., Tavani M., Purcell W. R., et al., 1995, ApJ, 447, L113
- Hirayama et al. (1999) Hirayama M., Cominsky L. R., Kaspi V. M., Nagase F., Tavani M., Kawai N., Grove J. E., 1999, ApJ, 521, 718
- Johnston et al. (1992) Johnston S., Manchester R.N., Lyne A., Bailes M., Kaspi V. M., Qiao Guojun, D’Amico N., 1992, ApJ ,387, L37
- Johnston et al. (1994) Johnston S., Manchester R. N., Lyne A. G., Nicastro L., Spyromilio J., 1994, MNRAS, 268, 430
- Johnston et al. (1999) Johnston S. Manchester R.N., McConnell D., Campbell-Wilson D., 1999, MNRAS, 302, 277
- Johnston et al. (2005) Johnston S., Ball L., Wang N., Manchester R. N., 2005, MNRAS, 358, 1069
- Kaspi et al. (1995) Kaspi V. M., Tavani M., Nagase F., Hirayama M., Hoshino M., Aoki T., Kawai N., Arons J., 1995, ApJ, 453, 424
- Kawachi et al. (2004) Kawachi A., Naito T., Patterson J. R., 2004, ApJ, 607, 949
- Kirk et al. (2002) Kirk, J. G., Skjæraasen, O., Gallant, Y. A, 2002, A&A,388, L29
- McClure-Griffiths et al. (1998) McClure-Griffiths N. M., Johnston S., Stinebring D. R.,Nicastro L., 1998, ApJ, 492L
- Shaw et al. (2004) Shaw S., Chernyakova M., Rodriguez J.,Walter R., Kretschmar P., Mereghetti S., 2004, A&A, 426, L33
- Tavani & Arons (1997) Tavani M., Arons J., 1997, ApJ, 477, 439
- Taylor, Manchester, & Lyne (1993) Taylor J. H., Manchester R. N., Lyne A. G., 1993, ApJS, 88, 529
- Wang et al. (2004) Wang N.,Johnston S., Manchester R.N., 2004 MNRAS, 351, 599
- Waters et al. (1988) Waters L.B.F.M., van den Heuvel E. P. J., Taylor, A. R., et al., 1988, A&A, 198, 200
- Wex et al. (1998) Wex N., Johnston S., Manchester R. N., Lyne A. G., Stappers B. W., Bailes M., 1998,MNRAS 298, 997