Physical and Chemical Structure of Protoplanetary Disks with Grain Growth
Abstract
We calculate the physical structure of protoplanetary disks by evaluating the gas density and temperature self-consistently and solving separately for the dust temperature. The effect of grain growth is taken into account by assuming a power-law size distribution and varying the maximum radius of grains . In our fiducial model with m, the gas is warmer than the dust in the surface layer of the disk, while the gas and dust have the same temperature in deeper layers. In the models with larger , the gas temperature in the surface layer is lower than in the fiducial model because of reduced photo-electric heating rates from small grains, while the deeper penetration of stellar radiation warms the gas at intermediate height. A detailed chemical reaction network is solved at outer radii ( AU). Vertical distributions of some molecular species at different radii are similar, when plotted as a function of hydrogen column density from the disk surface. Consequently, molecular column densities do not much depend on disk radius. In the models with larger , the lower temperature in the surface layer makes the geometrical thickness of the disk smaller, and the gaseous molecules are confined to smaller heights. However, if we plot the vertical distributions of molecules as a function of , they do not significantly depend on . The dependence of the molecular column densities on is not significant, either. Notable exceptions are HCO+, H and H2D+, which have smaller column densities in the models with larger .
1 Introduction
Planetary systems are thought to be formed in circumstellar disks, called protoplanetary disks, around young low-mass stars. The physical structure and evolution of the disks have been investigated by observation and by theoretical modeling. The disks are in hydrostatic equilibrium in the vertical direction, while the temperature is determined mainly by accretion at inner radii ( several AU) and by irradiation from the central star at outer radii. Hence the calculation of temperature is important in determining the physical structure of disks. In recent years several groups have been constructing disk models by solving the equations of radiation transfer. D’Alessio et al. (1998) obtained the vertical structure by solving one-dimensional radiation transfer at each disk radius, while Nomura (2002) and Dullemond (2002) solved the disk structure using a two-dimensional radiation transfer code. Although these models differ quantitatively, they all flare up significantly — the scale height is larger at larger radii. It should be noted that the density and temperature distributions are coupled; warm temperature in the outer radii makes the flared-up structure, which enhances the local irradiation (i.e. heating) from the central star. D’Alessio et al. (1999) pointed out that these model disks are geometrically too thick. In order to reproduce the observed spectral energy distribution and images of edge-on disks, some fraction of grains should be larger than interstellar dust (D’Alessio et al., 2001). This grain growth decreases the vertical height of the disk photosphere where the optical depth to the stellar radiation is unity, and thus the local heating rate by irradiation and hence the scale height. The presence of mm-sized grain is also required to account for the relatively high intensity of the millimeter dust continuum emission.
The theoretical models mentioned above, however, assumed that the gas temperature is equal to the dust temperature. Since the vertical density distribution is determined by gas-pressure gradient, the validity of this assumption should be checked. Recently Kamp & Dullemond (2004) tackled this problem; thermal balance is solved to obtain gas temperature, while the density distribution and the dust temperature are fixed to those of Dullemond et al. (2002), in which astronomical silicate grains of 0.1 m were assumed. It is found that dust and gas temperatures are equal to within 10% for the visual extinction of mag, and that the gas temperature exceeds the dust temperature at larger heights. A similar result is obtained by Jonkheid et al. (2004), who calculated the gas temperature by using the density distribution and the dust temperature of D’Alessio et al. (1999). Jonkheid et al. (2004) also investigated effect of dust settling; the gas temperature is calculated with the dust abundance reduced by two orders of magnitude above certain heights. They found that the dust settling increases the amount of hot gas if PAHs remain well-mixed with the gas.
In the present paper, we calculate gas and dust temperature separately together with the gas density distribution in the disk. The gas temperature is obtained by assuming a simple chemical equilibrium and detailed thermal balance, including gas-dust heat exchange, at each position in the disk. Then the vertical density distribution is determined from hydrostatic equilibrium. The dust temperature is obtained by solving the two-dimensional radiation transfer (Nomura, 2002). We calculate the temperature and density profiles self-consistently by iteratively solving the equations. The effect of grain growth is investigated by assuming a power-law size distribution of grains and varying the maximum grain radius (Miyake & Nakagawa, 1993).
We also calculate molecular distributions in the disk models obtained above by solving a detailed chemical reaction network. Several molecular lines, such as CO, HCO+, HCN and CN are detected by radio observations (Dutrey et al., 1997; Qi et al., 2003; Thi et al., 2004), which are sensitive to the region outside AU because of the beam size () of the current instruments. Although emission bands of CO and H2O in inner hot region ( AU) are detected in the infrared wavelength (Najita et al., 2003; Carr et al., 2004), little constraints are given yet on the molecular abundance and their spatial distribution. Therefore we constrain our discussion of the detailed chemistry to radii AU.
Aikawa et al. (2002) and van Zadelhoff et al. (2003) calculated the molecular distribution using the disk model of D’Alessio et al. (1999), in which interstellar-sized grains are well mixed with gas. The disk can be schematically divided into three layers. In the surface layer, molecules are dissociated by ultraviolet (UV) radiation and X-rays from the central star and the interstellar field, while heavy-element species are frozen onto grains in the midplane with high density and low temperature. Gaseous molecules observed at radio wavelengths are mostly present in the intermediate layer where the gas temperature and density are relatively high and the UV radiation is not too harsh. The model explains the observational results; the freeze-out in the midplane lowers the averaged abundances of heavy-element species and the UV radiation causes the high abundances of radical species. However, there are some quantitative disagreements. The models of Aikawa et al. (2002) overestimate CO column density in DM Tau, and underestimate column densities of organic species in LkCa15. van Zadelhoff et al. (2003) somewhat improved the agreement by including scattering of stellar UV, which enhances the UV intensity and hence the photo-dissociation rate of CO within the disk. The dissociation of CO produces carbon atoms, which are transformed to other organic species. Therefore it is interesting to see how the molecular abundances are affected by grain growth, which will enhance the UV penetration into the disk.
The remainder of the paper is organized as follows. A description of the physical and chemical model is given in §2. Numerical results of the physical structure and the molecular distribution are presented in §3. In §4, we check the self-consistency of our model and discuss implications for molecular line observations. A summary is given in §5.
2 Models
2.1 Physical Model
In this subsection we briefly describe how we obtain the physical structure of a disk; more detailed explanations are given in Nomura & Millar (2005). We consider an axisymmetric Keplerian disk around a typical T Tauri star with mass , radius , and temperature K (e.g. Kenyon & Hartmann, 1995).
The disk is in hydrostatic equilibrium in the vertical direction. The surface density distribution, , is determined by assuming a steady accretion rate (e.g. Lynden-Bell & Pringle, 1974); the thermal heating via viscous dissipation is equal to the gravitational energy of accreting mass at each radius. We assume constant mass accretion rate of yr-1 and the viscous parameter of .
The dust temperature is calculated assuming the local thermodynamic equilibrium and the local radiative equilibrium between absorption and reemission by dust grains at each position () in the disk, where is the distance from the central star and is the angle from the rotation axis. The equation is
| (1) |
where , , and represents the monochromatic opacity, the specific intensity, and the Planck function for blackbody radiation at a frequency , respectively. The energy exchange between gas and dust (Eq. [3]) is not included in the calculation of dust temperature because it is negligible compared with the radiative heating (e.g. Chiang & Goldreich, 1997). The specific intensity is calculated by solving the axisymmetric two-dimensional radiative transfer equation,
| (2) |
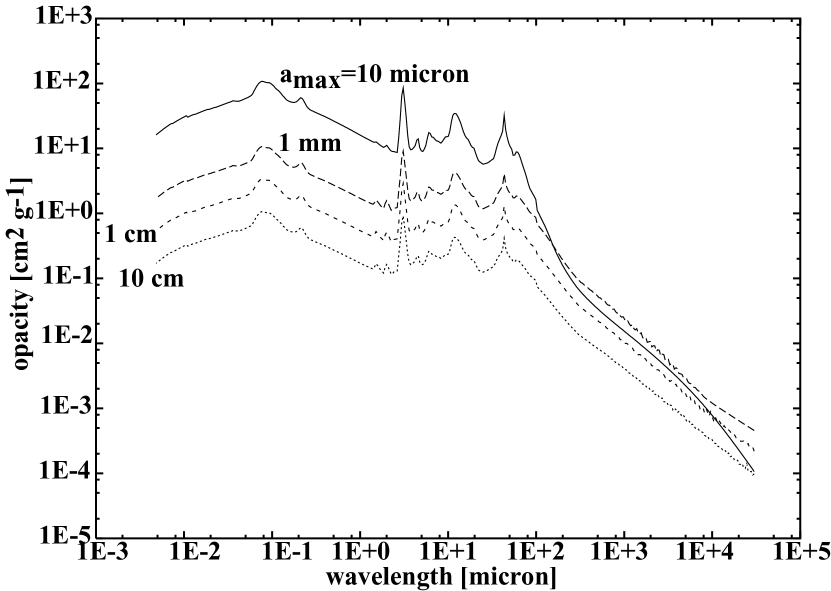
where is the specific optical depth from a point to by means of the short characteristic method in spherical coordinates (Dullemond & Turolla, 2000). As a dust model, we assume a power-law size distribution of grains, , where is the dust radius, and vary the maximum grain radius (Miyake & Nakagawa, 1993). The minimum grain radius is set to be 50 Å for all models. The dust grains are assumed to be well-mixed with the gas, and the mass ratio of the dust to the gas is fixed throughout the disk. The dust opacity for each model is calculated using Mie theory and plotted in Figure 1, where silicate, carboneous, and water ice are adopted as dust components. Heating sources of dust grains are the viscous dissipation at the midplane of the disk and the irradiation from the central star.
The gas temperature is determined by detailed energy balance at each position in the disk. In the surface layer of the disk, photo-electric heating is the dominant heating mechanism. For our model with m, we adopt the photo-electric heating rate of Weingartner & Draine (2001b) (, Case B), in which the carboneous grains have PAH-like properties in small size limit and graphite-like properties at larger sizes, and the maximum size of carbonaceous grain is m. In the models with different , the photo-electric heating rate is calculated to be proportional to the total number of grain particles, since small grains dominate in both the photo-electric heating rates and the particle number.
Radiative cooling by line transitions among fine-structure levels of OI (63 m) and CII (158 m), and by rotational line transitions of CO is taken into account, and dominates the cooling process in the very surface layer of the disk. The level populations of OI and CII are obtained by solving the equation of statistical equilibrium, while the level populations of CO are assumed to be in LTE. The cooling rate is calculated using the photon escape probability method (e.g. de Jong et al., 1980), while the abundances of the coolants (OI, CII, and CO) are calculated using the chemical equilibrium equation given by Nelson & Langer (1997).
In the dense region of the disk the energy exchange between gas and dust through collisions is an important heating or cooling process. We adopt the rate for the energy exchange
| (3) |
following Burke & Hollenbach (1983) and Tielens & Hollenbach (1985). In the models with grain growth, the rate is reduced in proportion to the total cross section of grain particles.
The heating by X-ray irradiation from the central star and viscous dissipation within the disk are not included in our model for simplicity. The viscous heating is more important than the photoelectric heating, if the phenomenological viscous parameter is larger than a critical value . In the case of m, is 0.05 for AU and 0.1 for AU, while in the case of cm, is . The X-rays could be the dominant heating source at the surface layer, if the X-ray luminosity is as high as 1, 5 and 1 ergs s-1 for AU, AU, and AU, respectively, in the case of m (e.g. Glassgold et al., 2004; Gorti & Hollenbach, 2004). We will take X-ray heating into account in future work.
Protoplanetary disks are irradiated by UV radiation from the central star and the interstellar field which affects the gas temperature and chemistry through photo-electric heating, photodissociation and photoionization. Many classical T Tauri stars have excess UV radiation compared to the main-sequence stars with similar effective temperatures (e.g. Herbig & Goodrich, 1986). In the present paper we adopt the stellar UV radiation observed towards TW Hya (Costa et al., 2000); black body radiation with K from the star and thermal bremsstrahlung emission with K and cm-3, where and are the electron number density and the volume of the emission region. Contribution of Ly line emission is not taken into account in the present work. The interstellar UV field, on the other hand, is given by Draine field (Draine, 1978) for the wavelength range Å Å and van Dishoeck & Black (1982) for Å.
Transfer of UV radiation is calculated 1+1 dimensionally; in cylindrical coordinates
| (4) |
where represents the optical depth integrated vertically from the disk surface to the height . The first term represents the (attenuated) interstellar UV radiation. The second term represents the contribution of the stellar UV radiation which is scattered on dust grains towards the disk midplane:
| (5) |
where and represent the monochromatic albedo and the specific optical depth from the central star, respectively, and is a square of the distance from the central star.
2.2 Chemical Model
The abundance and distribution of molecules are obtained by solving the molecular evolution equations at each position in the disk. The basic equation can be written as
| (6) |
where and are reaction rate coefficients and we adopt as initial conditions, molecular cloud abundances. Chemical equilibrium is reached in a relatively short time scale yr in the surface PDR (i.e. photon-dominated region) and in the freeze-out layer in the midplane. Although chemistry in the intermediate layer shows more complex behavior, it is almost in a pseudo-steady state at yr, and the molecular column densities do not change much during this period. Hence we will present abundance distributions at yr in the following sections.
We do not include hydrodynamic motions (turbulence and accretion) of disk material and time-dependent grain growth (i.e. grain radius is fixed). Coupling these effects with a detailed chemical reaction network could be important, but it is very time-consuming (Ilgner et al., 2004). So far, there are many studies which do not include hydrodynamics and yet reproduce the observed molecular abundances and improve our understanding of disk chemistry (e.g. Aikawa & Herbst, 1999; Willacy & Langer, 2000; Markwick et al., 2002; Kamp & Dullemond, 2004; Jonkheid et al., 2004; Semenov et al., 2005). The primary aim of the present work is to investigate how grain growth changes the distribution of physical parameters (density, temperature and UV radiation) and molecular abundances in a pseudo-steady state. The effect of hydrodynamic motions will be briefly discussed in §4.2.
Calculation of molecular abundances at a fixed position may also appear inconsistent with our derivation of physical structure, in which we assumed steady accretion. It should be noted that the assumption of steady accretion is used to determine the surface density and temperature. Gravitational energy released by the accretion is much less than the irradiation from the central star at radii several AU, in the region in which we calculate molecular abundances. Hence our model of the outer disk is almost identical to a passive disk with a given surface density. In addition, our results show that the vertical distributions of molecular abundance at different radii are similar, which suggests that inclusion of accretion and radial mixing would not significantly modify our results at least in the outer disk.
The set of reactions and rate coefficients are given by the “new standard model” (NSM) (Terzieva & Herbst, 1998; Osamura et al., 1999). Although the original NSM is for gas-phase chemistry, we extend it to include deuterium chemistry, adsorption of molecules onto grains, and thermal desorption (Aikawa & Herbst, 1999, and references therein). The rates of adsorption and H2 formation are proportional to the total surface area of grain particles and thus are reduced in the model with large grains. The formation rate of H2 is also assumed to be proportional to the sticking probability of H atoms, which is given by Tielens & Hollenbach (1985).
The rates of photodissociation and photoionization are calculated by
| (7) |
where is Planck’s constant, and the intensity of radiation field at frequency . Some molecules can be dissociated by absorption of continuum radiation, while others need discrete line transitions or a combination of the two (van Dishoeck, 1988). We adopt the cross sections given by van Dishoeck (1988) and updated by Jansen et al. (1995a) and Jansen et al. (1995b). For species for which no data on the cross sections are available, a rate given by a similar type of molecule was adopted.
The hydrogen molecule and CO are dissociated by absorption of FUV ( Å) and discrete line transitions. Because of their high abundances, self-shielding and mutual shielding of CO by H2 are important. We calculate their photodissociation rates at each position in the disk as follows. First, the UV flux at Å is calculated by integrating the spectrum and then dividing it by the interstellar FUV field, which gives the enhancement factor of the photodissociation photon flux. Second, vertical column densities of H2 and CO are calculated by integrating their number densities from the disk surface to each position. The self-shielding factor of H2 is given as a function of H2 column density following Draine & Bertoldi (1996), while that of CO is given as a function of H2 and CO column density following Lee et al. (1996). Finally, we multiply the interstellar photodissociation rates of H2 and CO ( s-1 and s-1, respectively) by the enhancement factor and their shielding factors.
3 Results
3.1 Physical Structure
3.1.1 Vertical Structure
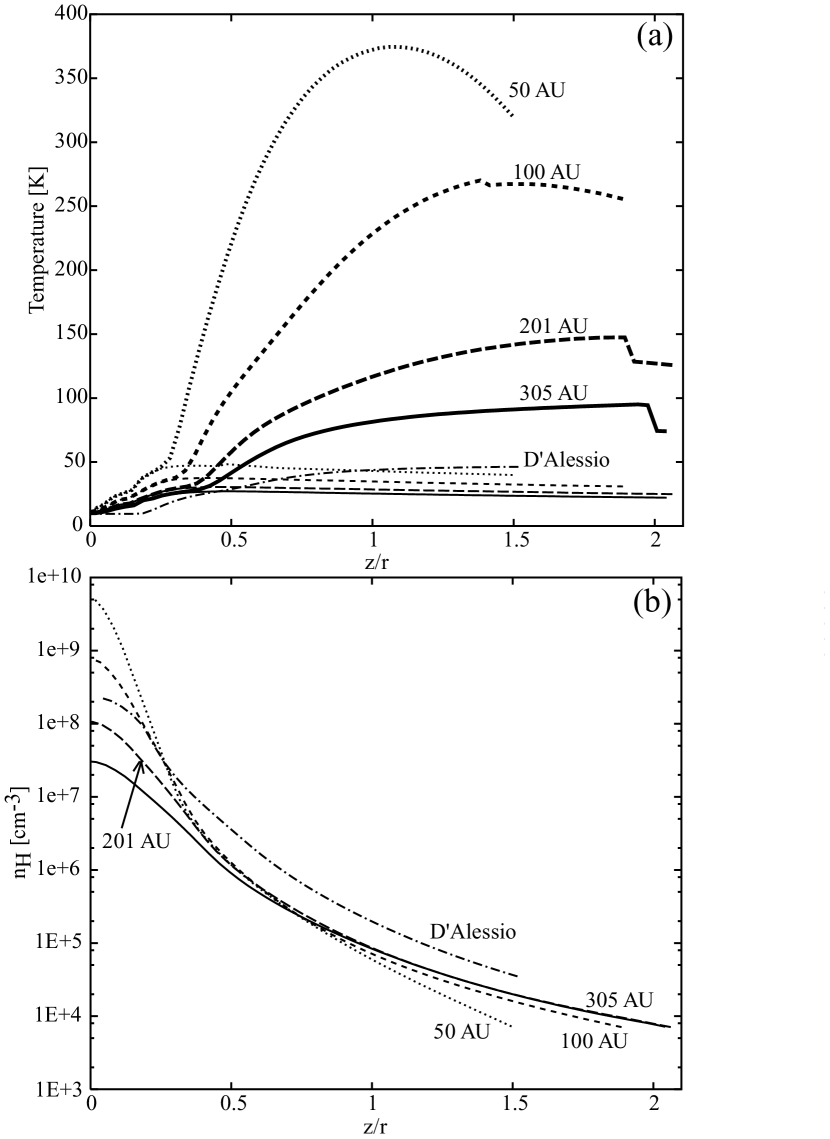
Figure 2 shows the vertical distribution of gas and dust temperatures at radii of 50, 100, 201 and 305 AU. The maximum size of dust grain is set to be 10 m. At , gas and dust are energetically well-coupled because of the high density. On the other hand, the gas temperature is much higher than the dust temperature at . In these surface regions the gas temperature is determined by photo-electric heating and line cooling of CII and OI. Sudden changes of gas temperature at appear where molecular hydrogen dominates atomic hydrogen in collisionally exciting CII. The difference between the gas and dust temperatures is important in predicting the the molecular line intensity from a disk (Jonkheid et al., 2004). The gas temperature in our model is lower than those in Kamp & Dullemond (2004) and Jonkheid et al. (2004) because of different rates of photo-electric heating on PAHs and dust grains.
Figure 2 shows the distribution of gas density, which is denoted by the number density of hydrogen nuclei . The disk is puffed up by the high gas temperature in the surface regions. It can also be seen that the disk is flared; i.e. the disk height increases with radius.
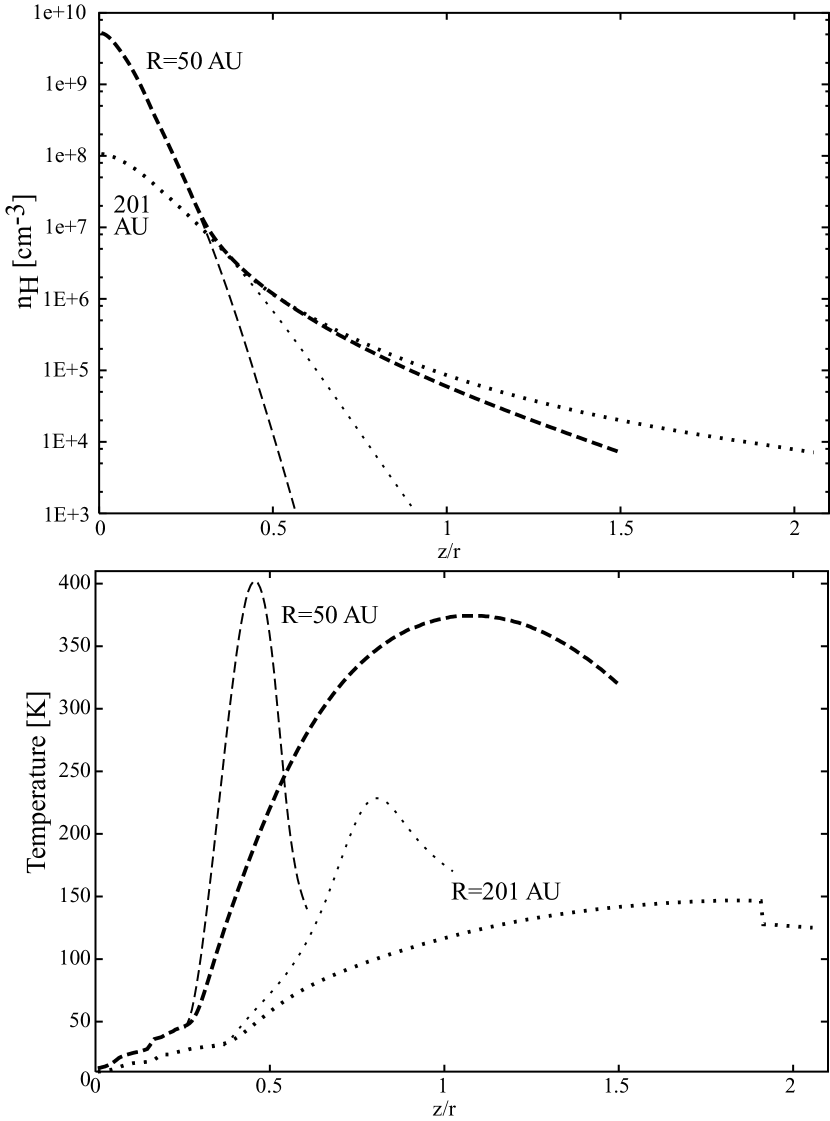
It should be noted that the distributions of gas density, gas and dust temperatures are obtained self-consistently in the present work, while Kamp & Dullemond (2004) and Jonkheid et al. (2004) calculated gas temperature by adopting the gas density and the dust temperature of Dullemond et al. (2002) and D’Alessio et al. (1999), respectively. For comparison with those, we have calculated the gas density by assuming the gas and dust temperatures are equal, and then evaluated the gas temperature as in previous studies. Figure 3 shows the resultant gas density (a) and temperature (b), which are compared with our self-consistent model. It can be seen that if the gas and dust temperatures are assumed to be equal, the gas density is lower than the self-consistent model in the disk surface. The self-consistent calculation of gas density is important in the prediction of molecular line intensities and the gas heating and cooling processes. The lower gas density at the disk surface leads to weaker line intensity if the line emission mainly comes from the hot surface layer. It also leads to an underestimate of the gas-grain collision rate, which is proportional to square of the density. The gas temperature in the disk surface is overestimated in the inconsistent model, since the lower dust density in the inner disk leads to an underestimate of the absorption of UV photons from the central star, and hence to an overestimation of the photoelectric heating rate. On the other hand, the gas densities in the two models are similar in the region close to the midplane. Consequently, the location of the absorption surface where the dust optical depth to the stellar radiation is unity is almost the same in the two models.
The dot-dashed line in Figure 2 shows the distribution of () dust temperature and () gas density at AU in a disk model by D’Alessio et al. (1999). The deviation of our dust temperature from theirs in the surface region is caused by a different treatment of radiative transfer; a radial component of the flux keeps the dust temperature almost constant at in our model, while the temperature is lower at smaller height in the 1+1D model of D’Alessio et al. (1999). In the deeper layers (), on the other hand, our model gives a higher temperature than D’Alessio et al. (1999), because we use the frequency dependent opacity in calculating the reprocessed radiation, while they use mean opacity (see Dullemond et al., 2002). Their gas density profile is similar to ours especially at larger disk radii (except for the difference in the total column density by a factor of ), since their dust temperature profile is somehow similar to ours.
3.1.2 Dependence on Grain Size
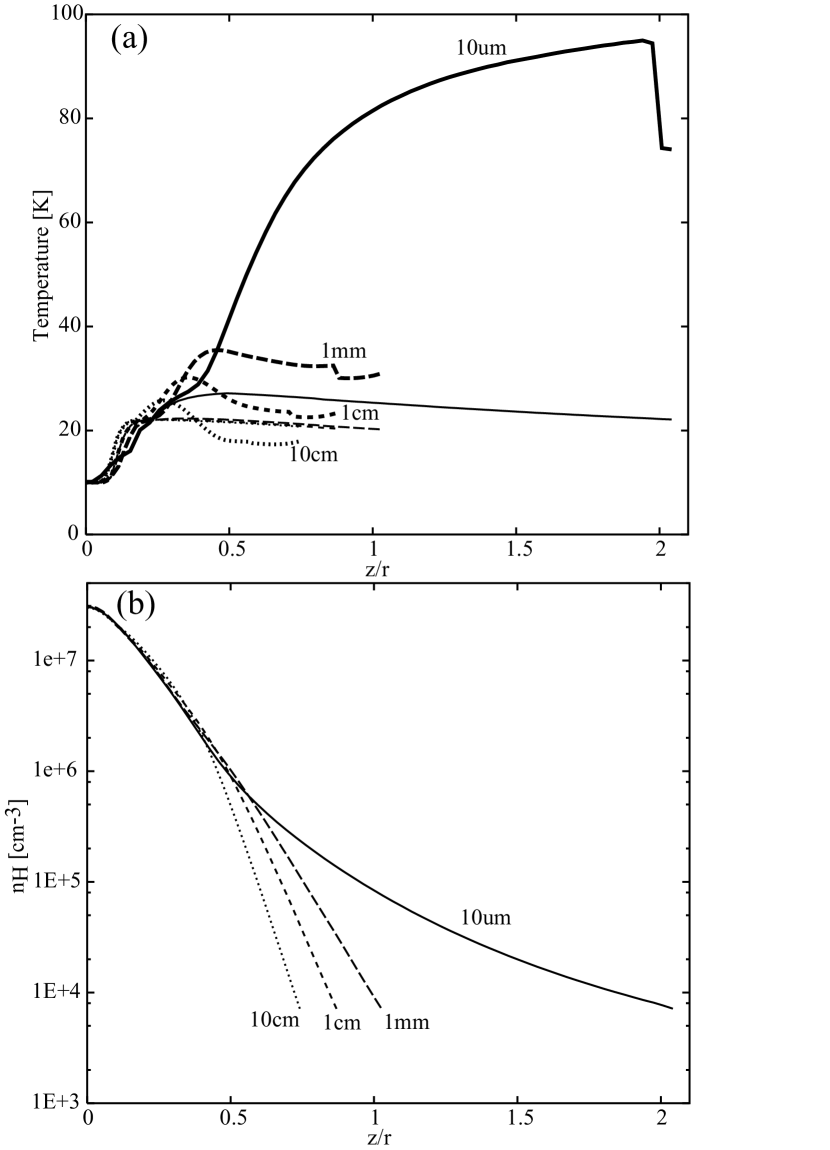
Figure 4 shows two-dimensional () distributions of gas temperature and density in the models with m, 1mm, 1 cm, and 10 cm. For a closer look, Figure 5 shows the vertical distributions of gas and dust temperatures at radius of 305 AU in these models. The gas temperature in the surface region () is lower in the models with larger because of the reduced photo-electric heating rate on small grains. On the other hand, the gas temperature at intermediate height () is higher in the models with larger , because of deeper penetration by stellar radiation.
The model with m gives higher dust temperature in the surface region than other models. This is caused by the dependence of dust opacity on grain size (Figure 1). At the wavelength of stellar radiation (m), the dust opacity varies significantly with . For example, it is larger by more than an order of magnitude in the model with m than in mm. At the wavelength of dust thermal emission (m), on the other hand, the dependence of dust opacity on is less significant; for example, the dust opacity is almost the same in the models with m and 1 mm.
Figure 5 shows vertical distribution of gas density at radius of 305 AU for models with various . The disks with smaller are more puffed up because of the higher gas temperature in the surface layer.
3.2 Molecular Abundance
3.2.1 Vertical and Radial Distribution
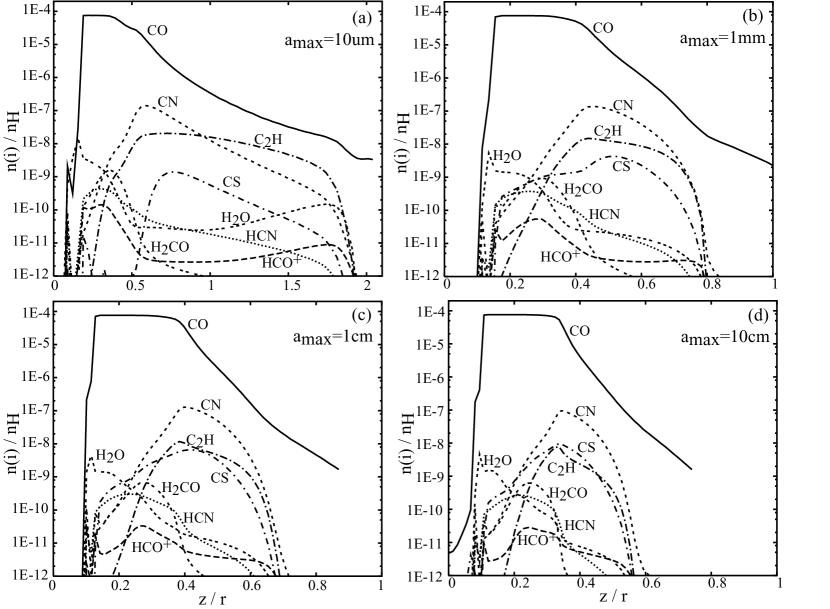
Figure 6 shows the vertical distribution of molecular abundance at radius of 305 AU in the disk with m. It is qualitatively similar to the results of van Zadelhoff et al. (2003). The surface layer is a PDR, while heavy element species are depleted onto grains in the midplane layer. Gaseous molecules are abundant in the intermediate layer, and they reach their maximum abundance at different heights; CN and C2H reach peak abundances at larger heights than HCN, H2CO, and H2O. At some species show a sharp local peak, which is caused by a selective adsorption at temperatures of K. Such small structure would, in reality, be smeared out by turbulent mixing (§4.2).
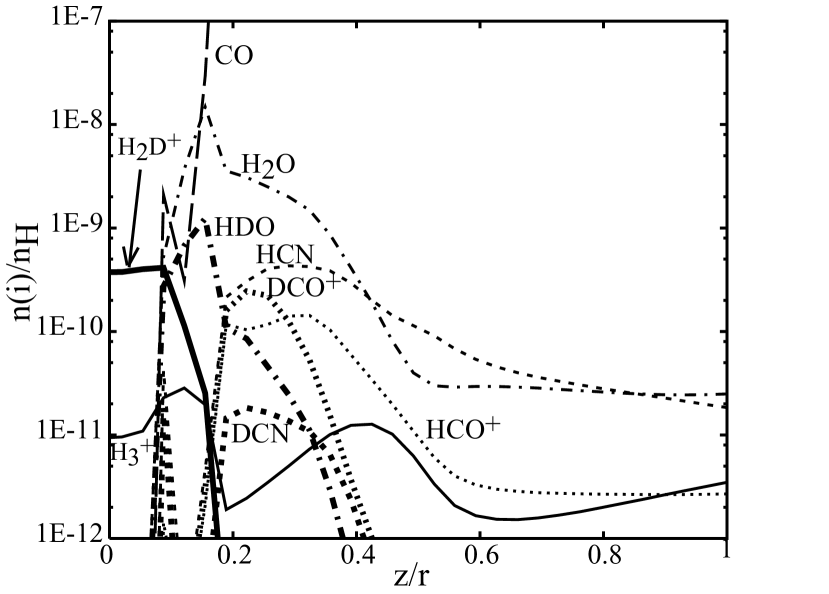
Our reaction network contains mono-deuterated species. Figure 7 shows the vertical distribution of some deuterated species and their normal counterparts at AU in the disk with m. Significant deuterium fractionation can be found; heavy element species such as DCN and HDO are abundant right above the midplane layer, while H2D+ is more abundant than H in the cold midplane layer. Since H2D+ is formed by the reaction H + HD and destroyed by reactions with CO and electron, the abundance ratio of H2D+ to H becomes very high in the region of heavy CO depletion and low ionization degree. The abundance ratio of DCO+ to HCO+ is also higher than unity at . This result, however, should be taken with caution. It is partly caused by the high abundance of D atom through D + HCO+ which forms DCO+. Due to the lack of an approximate method (such as the shielding factor) to evaluate the photodissociation rate of HD, we assume that its dependence on UV spectrum is the same as that of CN. If the rate is evaluated more accurately, i.e., considering the self shielding and mutual shielding with H2 lines, D atoms and hence DCO+ could be less abundant.
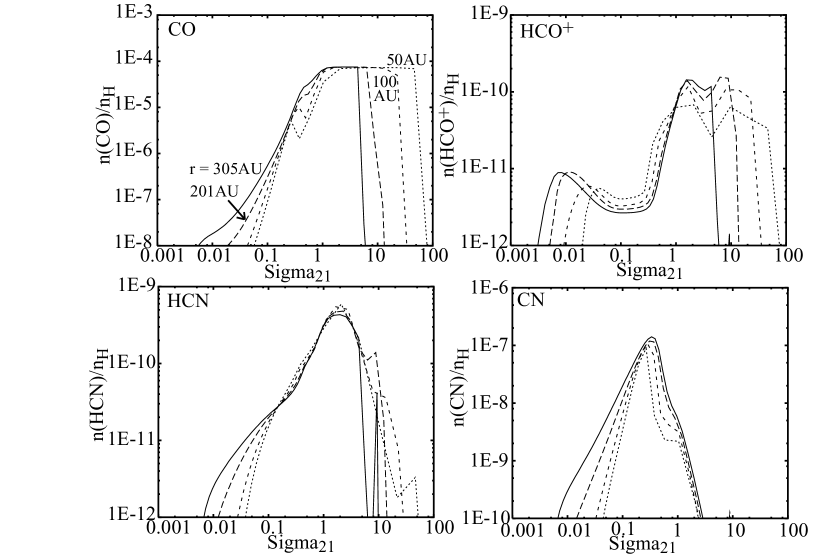
Input parameters of the chemical network model are density, temperature and UV radiation field, which can be approximately represented by or the column density of hydrogen nuclei measured from the disk surface . Since they vary with height (), it would be interesting to switch the horizontal axis of Figure 6 to these parameters. In fact, Aikawa et al. (2002) described the conditions for a high abundance of CO and HCN in terms of these parameters. We checked the dependence of molecular abundances on the three parameters, and found that for some species the vertical distributions at different radii are similar, if they are plotted as a function of the hydrogen column density measured from the disk surface. Figure 8 shows the abundance of CO, HCO+, HCN and CN at assorted radii as a function of cm, the denominator of which is a conversion factor of the hydrogen column density to in the case of interstellar dust. Although dust grains are larger than the interstellar dust in our models, we adopt this normalization for convenience. CO is abundant at , while HCO+, HCN and CN reach their peak abundance at , 2 and 0.3, respectively. The lower boundary of the CO and HCO+ layers is determined by the freeze out of CO at K. It is worth noting that the peak abundances of CO, HCN, and CN are almost independent of radius. On the other hand, the peak abundance of HCO+ is proportional to and thus is lower at inner radii, where the layer of a certain value of has higher density than that at outer radii. The vertical distribution of molecular abundances obtained in van Zadelhoff et al. (2003) also shows a good correlation with (i.e. ). Since it is time-consuming to calculate a detailed chemical reaction network throughout the spatial grid, such a “scaling law” would be useful to make an empirical abundance model for the comparison with observation.
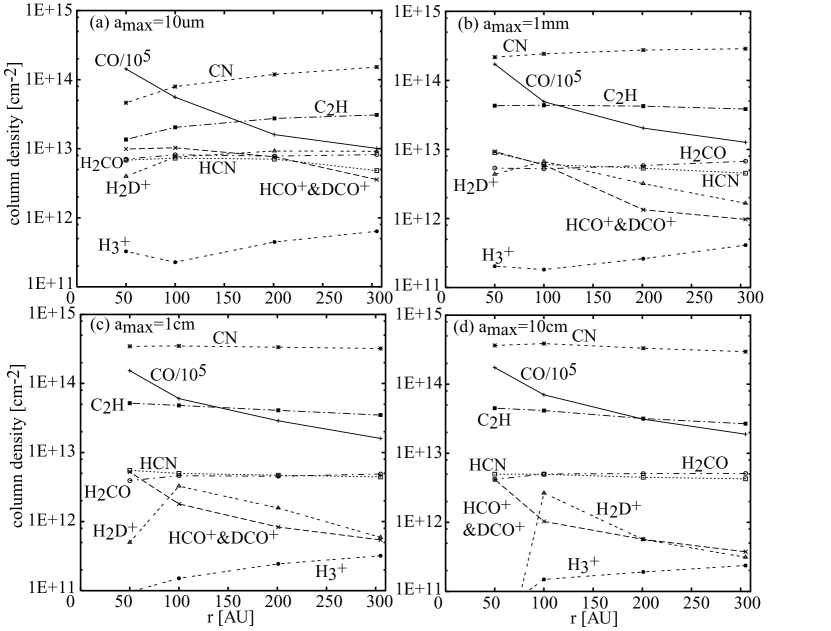
Molecular column densities are obtained by integrating the absolute molecular abundance (i) in the vertical direction. The radial distribution of assorted molecular column densities in the model with m is shown in Figure 9 (a). We plot the sum of HCO+ and DCO+ column densities, instead of HCO+, because our model may over-produce DCO+ from HCO+ as stated above. Carbon monoxide and HCO+ increase towards the center because the amount of warm gas ( K) is larger at the inner radius. The column densities of H2CO and HCN are almost constant at these radii ( AU), as expected from the weak dependence of their vertical distribution on radius (Figure 8). A slight decrease of CN and C2H column densities toward the center is caused by their low abundance in the layer of at the inner radius (Figure 8). Note that even the CO abundance is low there; a large fraction of carbon is adsorbed onto grains in the form of C5 or C6. These carbon chains are efficiently produced by gas-phase reactions in such a dense PDR (Suzuki, 1983) and adsorbed onto grains. At the temperature of K, the carbon chains do not sublimate efficiently, and are selectively accumulated onto grain surfaces (Aikawa et al., 1999). The adsorption rates are higher in the inner radius with higher densities. In the models with larger (panel of Figure 9, see below), column densities of CN and C2H do not decrease toward the center, because the time scales for adsorption and selective accumulation of carbon chains are larger.
3.2.2 Dependence on Grain Size
Figure 6 show the vertical distribution of molecular abundances at AU in the cases of 1mm, 1 cm, and 10 cm. It should be noted that the range of the horizontal axis of panel is different from that of panel . The distributions are qualitatively similar to the model with m (Figure 6 ) except that they are confined to smaller heights.
If we plot the molecular abundances as a function of instead of , they are similar to Figure 8, except that the peak abundance is reached at larger by a factor of a few. For example, HCN abundance has a peak at in the model with cm, compared with in the m model. It may sound counter-intuitive, since the dust opacity at UV wavelength is smaller by 1-2 orders of magnitude in the large grain models than in the m model (Figure 1). It should be noted that H2 molecule, which is a key ingredient for the formation of other molecules, is self-shielded from UV radiation, and that the gas density rapidly increases as a function of depth from the disk surface. Because of the geometrical effects, it is easier to attenuate the UV radiation directly coming from the central star than that coming from the vertical direction (i.e. interstellar radiation and scattering of the stellar component). Even though UV photons, especially those coming from the vertical direction, are not much attenuated, rates of two-body reactions overwhelm the photodissociation rates at a certain depth. It is worth noting that in the model of van Zadelhoff et al. (2003), which assumed interstellar grains, photodissociation rates are not necessarily low in the molecular layer (see their Figures 3 and 4).
Consequently, column densities of many molecular species do not much depend on (Figure 9). Notable exceptions are HCO+, H and H2D+. Since the HCO+ abundance is lower at higher densities, its column density is smaller in the models with larger , in which the molecular layer is confined to smaller heights. Protonated dihydrogen H and its isotopes are abundant in the cold midplane, which is thinner in the models with larger (Figure 5).
4 Discussion
4.1 Self consistency of the model
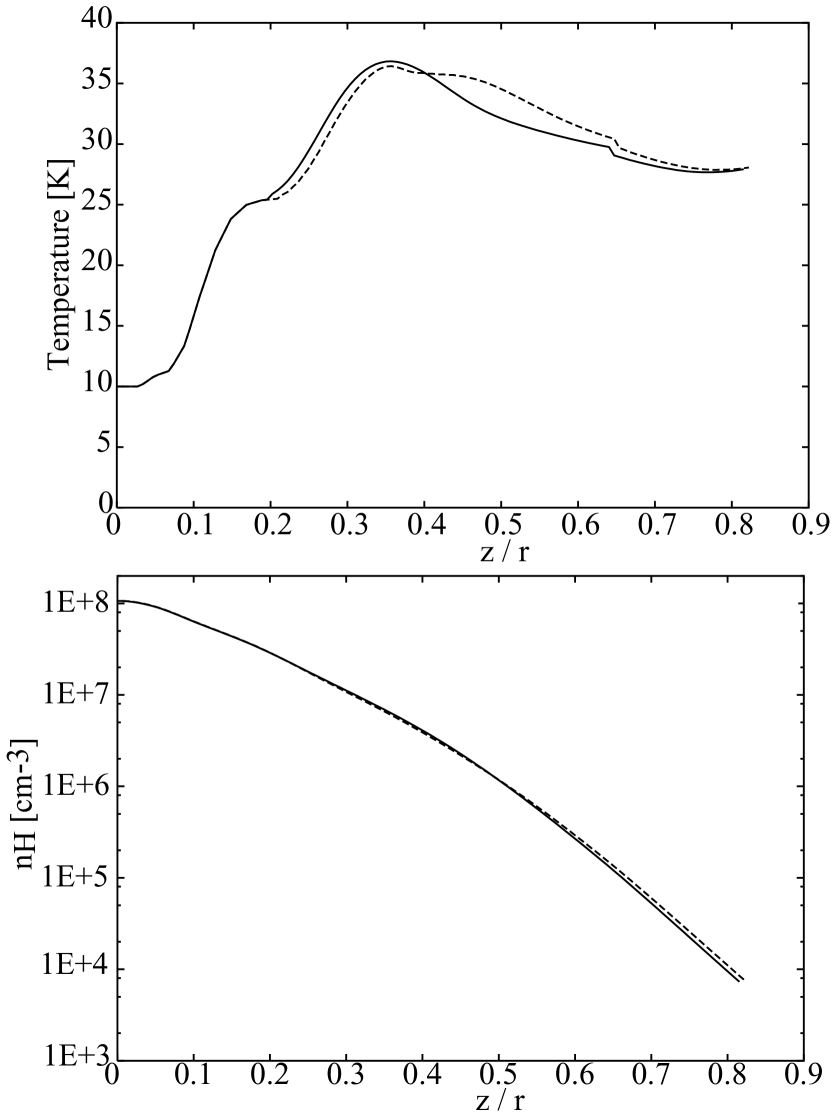
Chemistry and physical structure in disks are coupled; molecular abundances depend on physical parameters such as density, and line emission from certain species such as C+ and O is the main coolant in the surface layers. It is, however, very time-consuming if we couple the calculation of physical structure with the detailed time-dependent chemical model. Instead, we have constructed a physical disk model adopting a chemical equilibrium equation of Nelson & Langer (1997), and then performed a detailed chemical network calculation. Here we check the self consistency of our models; the temperature and density distributions are re-evaluated using the molecular abundances obtained from the detailed chemical reaction network.
Figure 10 shows the vertical distribution of density and temperature at radius of AU and time yr in the model with cm. The solid lines represent our original values, while the dotted lines are obtained using the molecular abundances from the detailed reaction network. In the surface layer () the temperature is slightly higher than the original value; the self shielding of CO, which is not included in the simple equilibrium equation, lowers the C+ abundance, which is a major coolant in the surface layer. The gas density in the surface layer is thus higher than the original value, which then slightly lowers the gas temperature at .
It should be noted that the difference between the original and re-evaluated structures is small enough that the detailed chemical reaction network would give almost the same abundance distribution for the re-evaluated structure. Therefore we can conclude that our models of physical structure and molecular abundances are essentially self-consistent.
4.2 Effects of hydrodynamical processes
We did not include hydrodynamic motions such as turbulence within the disk. Such motion will have two major effects on chemistry: (i) it tends to smear the stratification of molecular abundances and (ii) transport of chemically active species and/or mother molecules will modify the chemical reaction network.
The former effect, (i), can be estimated by comparing the mixing and chemical timescales. Following Aikawa et al. (1996), the mixing timescale over distance can be written as
| (8) |
The equation stands for either radial mixing and vertical mixing, as long as the transport process is turbulence with typical eddy size of and eddy speed of . For example, at radius of 200 AU, the midplane temperature is 10 K, and hence the sound speed is cm s-1, and the scale height is AU. If we set and to be 10 % of the scale height and sound velocity, respectively, it will take yr to mix the matter over the scale height ( AU). The chemical timescale is short yr in the surface and midplane layers of the disk (§2.2), while the chemistry in the intermediate molecular layer is almost in a pseudo-steady state at yr (§2.2). Therefore the overall three-layer model cannot be smeared out by the mixing in the vertical direction, although the distribution within the molecular layer can be somewhat averaged and the molecular layer can be extended in the vertical direction. For example, Dartois et al. (2003) observed two rotational transitions ( and ) of 13CO in DM Tau, and obtained the gas temperature of 13 K, which is lower than the freeze-out temperature of CO ( K). The existence of such cold CO gas can be explained by the vertical mixing. Equation (8) indicates that at the radius of AU CO gas can migrate over AU in the vertical direction within yr, which is comparable to the freeze-out timescale in the midplane regions of DM Tau.111The midplane density in DM Tau is lower than that in our disk model (Dutrey et al., 1997).
Accretion and radial mixing would not significantly modify our results, because the vertical distributions of molecular abundance at different radii are similar at least in the outer radius (§2.2, §3.2).
The latter effect, (ii), will enhance the gas-phase abundance of grain-surface products in the intermediate molecular layer; species such as H2CO are formed on the grain surface in the midplane and are sublimated to the gas phase in the warm molecular layer (Willacy et al. in prep; Semenov et al. in prep).
4.3 Implications for molecular line observations
The derivation of molecular abundances from line intensities is not straightforward because of spatial variation of molecular abundances and physical condition (i.e. temperature and density). Hence a prediction of line intensities from model disks is important. Calculation of non-LTE 2D line transfer, however, is beyond a scope of the present work. Here we make some qualitative comments on molecular line intensities by comparing the spatial distribution of molecular abundances and physical conditions.
Firstly, we compare the distributions of gas density (Figure 2) and molecular abundances (Figure 6). At , where various molecular species reach their peak abundance, the gas density is cm-3. Hence most of the major molecular lines in millimeter wavelength can be excited. Secondly, distributions of abundances and temperature are compared. Because of vertical distribution of abundances, each molecular line and the dust continuum trace different layers of the disk. Significant amounts of CN, C2H and CO exist in the upper layer in which gas and dust temperature is not coupled. As the maximum grain size becomes larger, the gas temperature in the surface layer decreases, which could be observable through these molecular lines. Species such as HCN and H2O exist in the layer in which the gas and dust temperatures are mostly coupled, but are higher than their midplane values. On the other hand, a major fraction of dust exists in the midplane. Our results suggest that owing to the vertical temperature gradient the molecular lines can be observed even in the disks which are optically thick in the dust continuum. Although the detailed chemical network is solved only in the outer region ( AU) of small-mass disks in the present work, the vertical distribution of temperature and molecular abundances in the surface layers would be qualitatively similar in the inner regions and/or more massive disks.
5 Summary
We have self-consistently calculated the distribution of density, dust temperature and gas temperature in protoplanetary disks. The density is obtained by assuming hydrostatic equilibrium. The dust temperature is obtained by the 2D radiation transfer, and the gas temperature is determined by a detailed energy balance among photo-electric heating, line cooling, and gas-dust heat exchange. Gas is much hotter than dust in the surface layers, while the gas and dust are energetically well-coupled at smaller heights because of higher densities.
We have investigated the effect of grain growth on disk structure by varying the maximum size of dust grains in the disk model. In the models with larger , the gas temperature in the surface layers is smaller because of reduced photo-electric heating rates on small dust particles. On the other hand, the gas temperature at intermediate heights is higher in the models with larger , because of deeper penetration of stellar radiation. The density distribution is more puffed up in the models with smaller .
Molecular abundances at , 100, 201, and 305 AU are calculated using a detailed chemical reaction network. In the surface layer, the dominant chemical process is photodissociation and/or photoionization by UV radiation from the central star and interstellar field. At intermediate heights, the gas density is high, and molecular formation via two-body reactions is more efficient than photodissociation. The vertical distributions of some molecular abundance do not depend much on radius, when they are plotted as a function of the hydrogen column density measured from the disk surface. Hence the integrated molecular column densities do not much depend on radius. Exceptions are CO and HCO+; they are abundant if the temperature is higher than the sublimation temperature of CO ( K), and if CO is shielded from the UV radiation. The amount of such warm gas is larger at inner radii.
The dependence of the molecular distributions on grain size () is investigated. In the models with larger , the geometrical thickness of the disk is smaller, and the gaseous molecules are confined to smaller height. However, if we plot the vertical distribution of molecules as a function of hydrogen column density from the disk surface, it does not significantly depend on ; in the model with cm, the column density of the peak molecular abundance is larger only by a factor of a few compared with the case of m. Hence the integrated molecular column densities do not much depend on . Notable exceptions are HCO+, H and H2D+, which have smaller column densities in the models with larger .
Because of the vertical distribution of molecular abundances, layers at different heights can be traced by choosing appropriate molecular lines. Significant amounts of CN, C2H and CO exist in the surface layer in which gas and dust temperatures are not coupled. Species such as HCN and H2CO exist in the layer in which the gas and dust temperatures are mostly coupled but are higher than their midplane values, while a major fraction of dust exists in the midplane.
References
- Aikawa et al. (1996) Aikawa, Y., Miyama, S. M., Nakano, T., & Umebayashi, T. 1996, ApJ, 467, 684
- Aikawa et al. (1999) Aikawa, Y., Umebayashi, T., Nakano, T., & Miyama, S. M. 1999, ApJ, 519, 705
- Aikawa & Herbst (1999) Aikawa, Y., & Herbst, E. 1999, A&A, 351, 233
- Aikawa et al. (2002) Aikawa, Y., van Zadelhoff, G. J., van Dishoeck, E. F., & Herbst, E. 2002, A&A, 386, 622
- Burke & Hollenbach (1983) Burke, J. R. & Hollenbach, D. J. 1983, ApJ, 265, 223
- Carr et al. (2004) Carr, J. S., Tokunaga, A. T., & Najita, J., 2004, ApJ, 603, 213
- Chiang & Goldreich (1997) Chiang, E.I. & Goldreich, P. 1997, ApJ, 490, 368
- Costa et al. (2000) Costa, V. M., Lago, M. T. V. T., Norci, L., & Meurs, E. J. A. 2000, A&A, 354, 621
- D’Alessio et al. (1998) D’Alessio, P., Cantó J., Calvet, N.,& Lizano, S. 1998, ApJ, 500, 411
- D’Alessio et al. (1999) D’Alessio, P., Calvet, N., Hartmann, L., Lizano, S., & Cantó, J. 1999, ApJ, 527, 893
- D’Alessio et al. (2001) D’Alessio, P., Nuria, C., & Hartmann, L. 2001, ApJ, 553, 321
- Dartois et al. (2003) Dartois, E., Dutrey, A., & Guilloteau, S. 2003, A&A 399, 773
- de Jong et al. (1980) de Jong, T., Dalgarno, A., & Boland, W. 1980, A&A 91, 68
- Draine (1978) Draine, B. T. 1978, ApJS, 36, 595
- Draine & Bertoldi (1996) Draine, B. T., & Bertoldi, F. 1996, ApJ, 468, 269
- Dullemond & Turolla (2000) Dullemond, C. P., & Turolla, R. 2000, A&A, 360, 1187
- Dullemond (2002) Dullemond, C. P. 2002, A&A, 395, 853
- Dullemond et al. (2002) Dullemond, C. P., van Zadelhoff, G. J., & Natta, A., 2002, A&A, 389, 464
- Dutrey et al. (1997) Dutrey, A., Guilloteau, S., Gulin, M. 1997, A&A, 317, L55
- Herbig & Goodrich (1986) Herbig, G. H., & Goodrich, R. W. 1986, ApJ, 309, 294
- Glassgold et al. (2004) Glassgold, A.E., Najita, J., & Igea, J. 2004, ApJ, 615, 972
- Gorti & Hollenbach (2004) Gorti, U., & Hollenbach, D. 2004, ApJ, 613, 424
- Ilgner et al. (2004) Ilgner M., Henning, Th., Markwick, A. J., & Millar, T. J. 2004, A&A 415, 643
- Jansen et al. (1995a) Jansen, D. J., Spaans, M., Hogerheijde, M. R., & van Dishoeck, E. F. 1995, A&A, 303, 541
- Jansen et al. (1995b) Jansen, D. J., van Dishoeck, E. F., Black, J. H., Spaans, M., & Sosin, C. 1995, A&A, 302, 223
- Jonkheid et al. (2004) Jonkheid, B., Faas, F. G. A., van Zadelhoff, G. J., & van Dishoeck, E. F. 2004, A&A 428, 511
- Kamp & Dullemond (2004) Kamp, I., & Dullemond, C. P. 2004, ApJ, 615, 991
- Kenyon & Hartmann (1995) Kenyon, S. J., & Hartmann, L. 1995, ApJS, 101, 117
- Lee et al. (1996) Lee, H. -H., Herbst, E., Pineau des Forêts, G., Roueff, E., & Le Bourlot, J. 1996, A&A, 311, 690
- Lynden-Bell & Pringle (1974) Lynden-Bell, D., & Pringle, J. E. 1974, MNRAS, 168, 603
- Markwick et al. (2002) Markwick, A. J., Ilgner, M., Millar, T. J., & Henning, T. 2002, A&A, 385, 632
- Miyake & Nakagawa (1993) Miyake, K., & Nakagawa, Y. 1993, Icarus, 106, 20
- Najita et al. (2003) Najita, J., Carr, J. S., & Mathieu, R. D. 2003, ApJ, 589, 931
- Nelson & Langer (1997) Nelson, R. P., & Langer, W. D. 1997, ApJ, 482, 796
- Nomura (2002) Nomura, H. 2002, ApJ, 567, 587
- Nomura & Millar (2005) Nomura, H., & Millar, T. J. 2005, A&A, 438, 923
- Osamura et al. (1999) Osamura, Y., Fukuzawa, K., Terzieva, R., & Herbst, E. 1999, ApJ 519, 697
- Qi et al. (2003) Qi, C., Kessler, J. E., Koerner, D. W., Sargent, A. I., & Blake, G. A. 2003, ApJ, 597, 986
- Semenov et al. (2005) Semenov, D., Pavlyuchenkov, Ya, Schreyer, K., Henning, Th., Dullemond, C. P., & Bacmann, A. 2005, ApJ, 621, 853
- Suzuki (1983) Suzuki, H. 1983, ApJ, 272, 579
- Terzieva & Herbst (1998) Terzieva, R., & Herbst, E. 1998, ApJ, 501, 207
- Thi et al. (2004) Thi, W. F., van Zadelhoff, G. J., & van Dishoeck, E. F. 2004, A&A, 425, 955
- Tielens & Hollenbach (1985) Tielens, A. G. G. M. & Hollenbach, D. 1985, ApJ, 291, 722
- van Dishoeck & Black (1982) van Dishoeck, E. F. & Black, J. H. 1982, ApJ, 258, 533
- van Dishoeck (1988) van Dishoeck, E. F. 1988, in Rate Coefficients in Astrochemistry, ed. T. J. Millar & D. A. Williams (Kluwer, Astrophys. Space Science Library), 146, 49
- van Zadelhoff et al. (2003) van Zadelhoff, G. J., Aikawa, Y., & Hogerheijde, M. R., & van Dishoeck, E. F. 2003, A&A, 397, 789
- Weingartner & Draine (2001a) Weingartner, J. C., & Draine, B. T. 2001a, ApJ, 548, 296
- Weingartner & Draine (2001b) Weingartner, J. C., & Draine, B. T. 2001b, ApJ, ApJS, 134, 263
- Willacy & Langer (2000) Willacy, K., & Langer, W. D. 2000, ApJ, 544, 903