Bump Cepheids in the Magellanic Clouds
Metallicities, the Distances to
the LMC and SMC, and the Pulsation-Evolution Mass Discrepancy
Abstract
We utilize nonlinear pulsation models to reproduce the observed light and color curves for two samples of bump Cepheid variables, 19 from the Large Magellanic Cloud and 9 from the Small Magellanic Cloud. This analysis determines the fundamental parameters mass, luminosity, effective temperature, metallicity, distance and reddening for the sample of stars. The use of light curve shape alone to determine metallicity is a new modelling technique introduced here.
The metallicity, distance and reddening distributions for the two samples are in agreement with those of similar stellar populations in the literature. The distance modulus of the Large Magellanic Cloud is determined to be 18.540.018 and the distance modulus of the Small Magellanic Cloud is determined to be 18.930.024. The mean Cepheid metallicities are and for the LMC and SMC, respectively.
The masses derived from pulsation analysis are significantly less than those predicted by stellar evolutionary models with no or mild convective core overshoot. We show that this discrepancy can not be accounted for by uncertainties in our input opacities or in mass-loss physics. We interpret the observed mass discrepancy in terms of enhanced internal mixing in the vicinity of the convective core during the main-sequence lifetime and find that the overshoot parameter rises from 0.6880.009Hp at the mean LMC metallicity to 0.7460.009Hp in the SMC.
1 Introduction
Wide-field photometric studies such as the OGLE and MACHO projects have left a legacy of well-sampled highly uniform photometry for the Cepheid populations of the Magellanic Clouds. In the present paper we compare these data to the predictions of stellar pulsation models. A number of recent studies have shown that nonlinear pulsation models are able to reproduce both the gross features of Cepheids light curves such as periods and amplitudes as well as much smaller morphological features such as resonance features seen in bump Cepheids (Wood, Arnold, & Sebo, 1997; Bono, Castellani, & Marconi, 2002).
The morphology of the light curve proves highly sensitive to the physical parameters of mass, luminosity and effective temperature. By matching the model light and color curves to those observed we can constrain the physical parameters of the star to greater precision than available with other techniques (Keller & Wood, 2002). The distance and reddening to each Cepheid can also be determined. The resulting distances offer an independent method of distance determination to the Magellanic Clouds: one which is solely based on the physics of stellar interiors.
Mass estimates derived from bump Cepheids have caused much debate since Stobie (1969) first showed that pulsation masses for bump Cepheids are significantly lower than those predicted from stellar evolution. Largely in response to this mass discrepancy, more detailed modelling of opacities was undertaken by the OPAL (Rogers & Iglesias, 1992) and Opacity Projects (Seaton et al., 1994). The resultant enhanced metal opacities resolved much of the mass discrepancy (Moskalik, Buchler, & Marom, 1992). However a series of studies of galactic (Caputo et al., 2005) and LMC (Wood, Arnold, & Sebo, 1997; Keller & Wood, 2002; Bono, Castellani, & Marconi, 2002) bump Cepheids have shown that the masses of bump Cepheids remain smaller than predicted by evolution. This discrepancy amounts to 15% in mass or, seen another way, bump Cepheids appear more luminous for a given mass (Keller & Wood, 2002).
The luminosity of a Cepheid is critically dependent on the mass of the He core established during the star’s main-sequence life. The mass of the He-core is dependent on the extent of the convective core during core-H burning. Classical models define the limit to convection via the Schwarzschild criterion. This places the boundary to convection at the radius at which the buoyant force drops to zero. However, the temperature and density regime in the vicinity of the convective boundary of the main-sequence Cepheid progenitor are such that restorative forces in the region formally stable to convection are mild and some significant level of overshoot of the classical boundary is expected (Zahn, 1991).
It is typical to parameterize the level of convective core overshoot using the mixing-length formulation where gas packets progress a distance given by pressure-scale heights () into the classically stable region. A star with larger core overshoot is able to draw upon more H and hence lives longer on the main-sequence, develops a more massive He core and is more luminous than classical models during the post-main-sequence evolution.
Our description of convection is the weakest point in our understanding of the physics of massive stars. Numerical modelling of core convection requires a description of the turbulence field at all scales. Three-dimensional hydrodynamical calculations capable of adequate resolution have only recently become a possibility and are in their infancy (Eggleton et al., 2003). At present we must rely on observation for constraint.
Observational determinations of the magnitude of convective core overshoot (CCO) have focused on populations of intermediate mass stars ( M⊙) where the signature of overshoot is expected to be most clearly seen. The study of Mermilliod & Maeder (1986) examined a range of galactic clusters with main-sequence turn-offs in mass range 9-15M⊙ and derived overshoot parameter .111We quantify CCO using the formalism of Bressan, Chiosi, & Bertelli (1981) who use an overshoot parameter pressure scale heights. Note that is a factor of 2.0 times the overshoot parameter in the formalism of the Geneva group (Schaller et al., 1992). Chiosi et al. (1992) summarize a number of similar studies converging on a mild efficiency of overshoot . This is the basis for the level of CCO included in the stellar evolutionary models for M⊙ by Girardi et al. (2000).
A number of subsequent studies have focused on the intermediate age LMC cluster NGC 1866 whose large population of post-main-sequence stars was proposed as proof both for (Barmina et al., 2002) and against (Testa et al., 1999) mild overshoot. Keller, Da Costa, & Bessell (2001) examined the populations of a series of young populous clusters in the Magellanic Clouds and found for the SMC cluster NGC 330 and mean of for three similar clusters in the LMC. This result does not indicate any strong dependence of on metallicity. The subsequent study of Cordier et al. (2002) examined the field population of the Magellanic Clouds and in contrast found evidence for a strong metallicity dependence in the degree of overshoot ( and 0.2 for the SMC and LMC respectively. Such studies based on the color-magnitude diagrams of stellar populations do face uncertainty due to contamination by unresolved binary systems (and significant blending of unrelated stars in the case of the Magellanic Clouds), contamination by the surrounding field population, small numbers of stars on the upper main-sequence and systematics introduced by bolometric corrections to place the population on the H-R diagram.
Bono, Castellani, & Marconi (2002) reported the results of light curve modelling of two LMC bump Cepheids and found that they were able to match the luminosities of the Cepheids using masses 15% less than predicted by evolutionary models which neglect convective core overshoot and mass-loss. Keller & Wood (2002) (Paper I) presented results of pulsation modelling for a sample of 20 LMC bump Cepheids. Paper I found a level of core overshoot of under the assumption of a LMC abundance of Z=0.008. The models of Paper I incorporated convective energy transfer in the Cepheid envelope through the mixing-length approximation. This approximation is expected to break down at cooler temperatures as the convective region of the Cepheid becomes a substantial fraction of the envelope. A consequence is that these models do not reproduce the red edge of the instability strip. Redward of the red edge the pulsation growth rate remains above zero. Consequently in Paper I we were restricted to bump Cepheids close to the blue edge of the instability strip. In addition, Feuchtinger, Buchler & Kollath (2000) demonstrates that neglect of the effects of convection can shift the blue edge to temperatures on the order of 400K cooler than predicted by models incorporating the effects of turbulent convection.
In this paper, we present updated models which include convection and turbulent eddy viscosity. The formulation of our models is discussed in Section 2. In Section 3 we analyze for the first time a sample 9 SMC stars and reanalyse 19 LMC Cepheids for comparison. We then discuss the implication of our results for the level of convective core overshoot and its dependence on metallicity in Section 4.
2 Model details
The details of the nonlinear pulsation code have been presented in Wood (1974) and Wood, Arnold, & Sebo (1997). Briefly, opacities are drawn from OPAL 96 (Iglesias & Rogers 1996) and supplemented at low temperatures by Alexander & Ferguson (1994). A new addition to the pulsation code is eddy viscosity pressure , implemented using the prescription given by Kolláth et al. (2002). Given the convective velocity from the time-dependent mixing length theory described by Wood (1974), is given by , where is the mixing length, is the pulsation velocity and is a dimensionless parameter for which we use a value 0.15, similar to the value 0.164 used by Kolláth et al. (2002).
Envelope models were defined using 460 radial points outside an radius of 0.3 R⊙. A linear non-adiabatic code was used to derive the starting envelope model. This model was perturbed by the fundamental mode eigenfunction and the pulsation followed in time with the nonlinear code until the kinetic energy of pulsation reached a steady limit cycle (typically requiring around 500 cycles).
3 Light curve modelling
Photometry for our sample of bump Cepheids is taken from the MACHO photometric database. The MACHO and magnitudes have been converted to Kron-Cousins V and R using the transformations described in Alcock et al. (1999). Alcock et al. quote global systematic uncertainties of mag in zero point and color. The photometric parameters of our Cepheid sample are presented in Table 1.
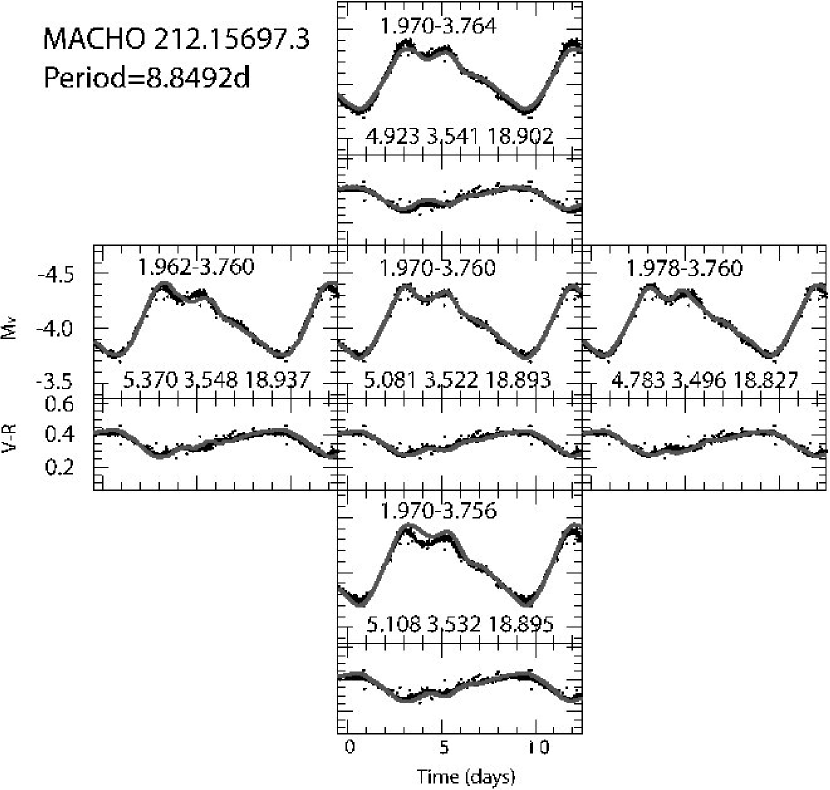
The appearance of a bump in the light curve of Cepheids of periods 6dP16d and its dependence on period was first described by Hertzsprung (1926). This Hertzsprung progression starts at short periods with a small amplitude bump on the descending branch of the light curve. As the period increases the amplitude increases and the phase of the bump decreases until the bump appears at maximum light. This is the centre of the Hertzsprung progression. With increasing period the bump amplitude decreases and it moves along down the rising branch of the light curve. From a Galactic sample the center of the Hertzsprung progression is seen to occur at P=9.950.05 d (Moskalik et al., 2000). The study of Beaulieu (1998) finds that in the LMC this occurs at P=10.50.5d and in the SMC at P=11.00.5 d. The theoretical investigation of the Hertzsprung progression by Bono et al. (2000) determined the center of the Hertzsprung progression in the LMC to be at d, in good agreement with the empirial evidence. The shape of a Cepheid light curve depends upon the mass, luminosity and effective temperature of the star together with its metallicity. Hence four constraints are required to fully define the parameters of our chosen star. The first constraint is that the fundamental frequency of pulsation must match that observed. The remaining three constraints are derived from fitting the nonlinear pulsation model light curves to the observed light curve. Our nonlinear models span a three dimensional parameter space defined by: effective temperature, metallicity and P02, the ratio of the fundamental to the second overtone period. This choice of parameters is driven by the simplicity they bring to subsequent analysis, as each parameter acts on a separate feature of the light curve. The effective temperature determines the amplitude of pulsation. The quantity P02 determines the phase of the bump and the metallicity affects the phase of a tertiary bump on the declining side of the light curve.
Determining an optimal match to the observed light curve involved a chi-squared minimization in this parameter space. For trial values of effective temperature and P02 we determine a mass and luminosity to give the observed period of pulsation. We then examine the light curve from the trial and form a chi-squared figure of merit relative to the observed light curve. This is repeated over a grid of metallicity values of Z=0.001 step size.
Figures 1 and 2 show the effects of variation of the parameters , P02 and Z. As we increase temperature in the vertical direction on Figure 1 the amplitude of pulsation is decreased as we approach the blue edge of the instability strip. As we vary P02 we modify the phase at which the bump is located.
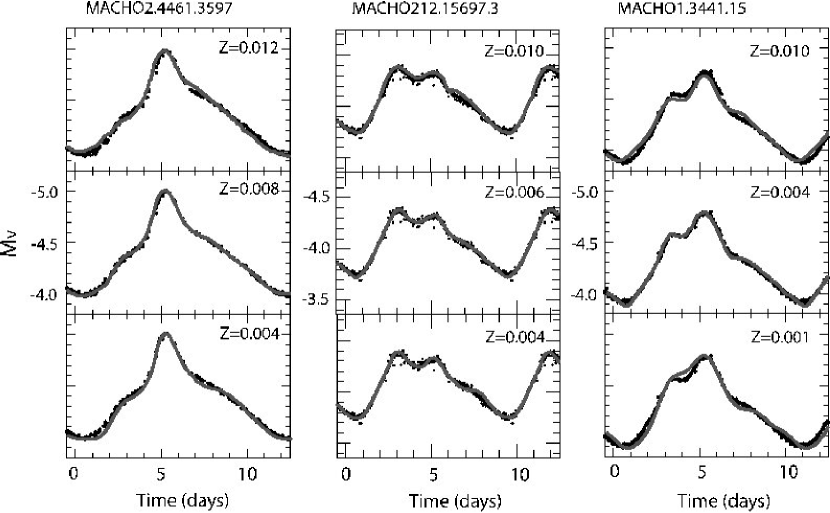
In Figure 2, we see that the effect of changing Z is to modify the phase of a third bump evident during the decline in light: this bump is also evident in the extremely well sampled MACHO light curves. We note that the metallicity bump is not one which has been discussed previously in the literature, perhaps not surprisingly given the low amplitude of the feature. As metallicity is decreased the feature descends the declining branch of the light curve and the amplitude diminishes. The feature is no longer apparent by Z0.002 since it has moved into the upturn region of the light curve. Given this situation, it seems that this method of determining metallicity is useful from solar to one tenth solar.
Having located the optimal match to the observed light curve the observed V-R color curve is then dereddened to the model V-R color curve to derive the color excess EV-R. This can be converted to a visual absorption via the standard reddening curve (Bessell, Castelli, & Plez (1998) based on Mathis (1990)). Likewise, the apparent distance modulus to the star is simply the magnitude difference between the model absolute magnitude and the observed mean magnitude. The apparent distance modulus minus the visual absorption provides the true distance modulus. The parameters of the best-fit models for the Cepheids of our sample are given in Table 2.
The internal accuracy of the best model parameters is limited by the presence of cycle-to-cycle variations in the pulsation model output. These variations arise since the models have not reached a perfectly steady pulsation limit cycle. In practice the approach to the limit cycle becomes prohibitively slow and one must accept some level of inter-cycle variation. These variations typically amount to around magnitudes. The inter-cycle variations place a strong limit on our ability to determine the metallicity, with typical uncertainties per star ranging from to 0.004 in the value of Z.
The uncertainty in MACHO photometric calibrations noted above lead to systematic uncertainties. The uncertainties in mass and bolometric luminosity for each star from this source are M⊙ and dex in , respectively. The values presented in figures 6 and 7 are the sum in quadrature of systematic and internal uncertainties.
3.1 Reddenings and distance modulii
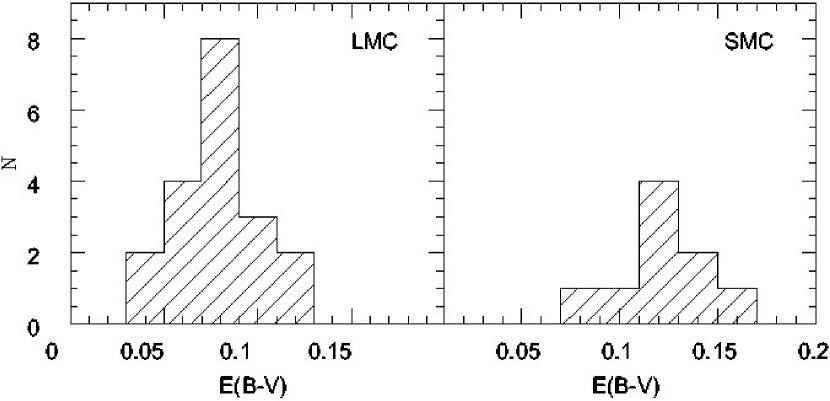
In Figures 3 and 4 we present the distributions of derived reddenings and distance modulii for our LMC and SMC samples. The mean derived reddening is 0.080.02 for the LMC and 0.120.02 for the SMC. Bessell (1991) summarizes a large body of previous reddening investigations for the LMC and SMC and concludes that average reddening of stars in both systems is of order =0.10 but importantly, different populations give systematically different results. The studies of Zaritsky (1999) and Zaritsky et al. (2002) describes this systematic effect in more detail. In the LMC Zaritsky (1999) find a mean =0.03 from a red-clump giant sample and =0.14 from OB stars. Both populations exhibit non-Gaussian tails extending to 0.3. The results are similar for the SMC: =0.06 from red-clump giants and =0.14 from OB types (Zaritsky et al., 2002). Zaritsky et al. (2002) propose that the variation in reddening between populations is due to an age dependent scale height. OB stars having a smaller scale height lie predominantly in the dusty disk. With this background, we find that the reddenings derived for our sample are applicable to the range of values expected in the two localities.
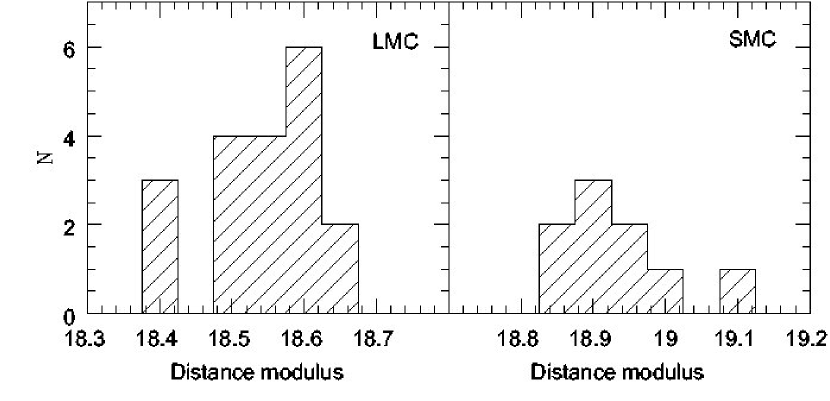
The mean distance modulus is 18.540.018 for the LMC and 18.930.024 for the SMC. Both are in good agreement with existing determinations in the literature. In the case of the LMC, determinations of the distance modulus from population I and II distance indicators cover the range of 18.3-18.7 magnitudes. Since 2002 there has been a convergence towards a value of 18.500.02mag (Alves, 2004). A recent pulsation-based determination of LMC distance modulus using light curve fitting to RR Lyrae stars rather than Cepheids (Marconi & Clementini, 2005) gave a value of , essentially identical to the value found here. The distance to the SMC is much less well defined, probably due to line-of-sight depth effects within the galaxy. Using stellar population studies, Udalski et al. (1999) and Groenewegen (2000) have estimated that the differential distance modulus of the SMC from the LMC is +0.5mag. Hilditch et al. (2005) used a sample of 40 eclipsing binaries in the SMC to derive a mean distance modulus to the SMC of 18.910.03 magnitudes (mag systematic).
3.2 Metallicity distribution for Cepheids in the Magellanic Clouds
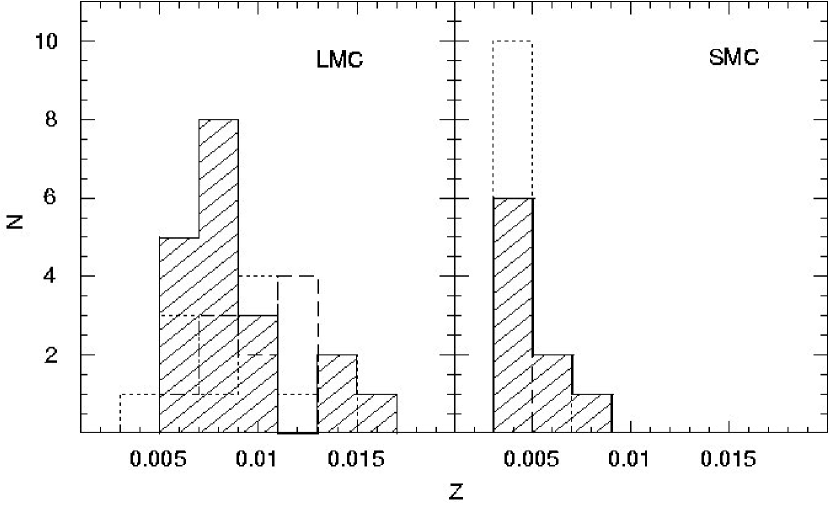
As we have seen from the above light curve modelling it is possible to estimate the metallicity of the target bump Cepheid from the phase of the secondary bump. The distribution of metallicities so derived for the LMC and SMC samples is shown in Figure 5. The mean metallicity is 0.00910.0007 for the LMC ([Fe/H] = ) and 0.00500.0005 for the SMC ([Fe/H] = ). This result is in line with previous determinations of metal abundance within the young population of the Magellanic Clouds. The recent study of the metal abundance of a sample of 12 LMC and 12 SMC Cepheids by Romaniello et al. (2005) reveals a mean [Fe/H]=-0.4 and -0.7 respectively with associated rms of 0.15 mag. Luck et al. (1998) present abundances for a sample of 6 SMC and 10 LMC Cepheids. In the LMC they derive a mean [Fe/H]=-0.30 with stars ranging from [Fe/H]=-0.55 to -0.19, while in the SMC they derive a mean [Fe/H]=-0.68 with a range of [Fe/H] from -0.84 to -0.65.
4 The Cepheid pulsation and evolution mass discrepancy
Our pulsation modelling has provided us with stellar masses for a set of bump Cepheids. We can now compare these pulsation masses with masses predicted by evolutionary models. From an evolutionary perspective, Cepheids are understood to be crossing the instability strip along the so-called blue loops following the initiation of core-He burning. The luminosity of these loops is relatively constant during the passage through the instability strip. The loops therefore define an evolutionary mass-luminosity relationship for Cepheids.
The mass-luminosity relation is a function of metallicity. Less metal-rich Cepheids appear more luminous. In order to derive the evolutionary mass of each of our Cepheids, we use the evolutionary tracks of Girardi et al. (2000), which are defined for a wide range of metallicities. We interpolate between the tracks to the model-derived metallicity of each Cepheid. The known luminosity then gives the corresponding evolutionary mass.
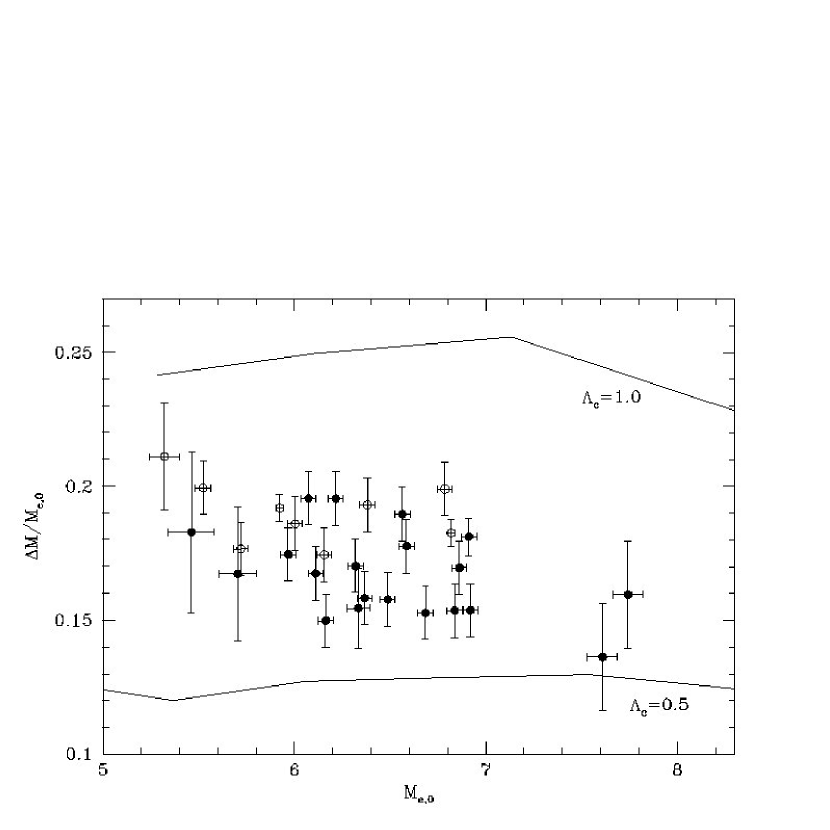
In Figure 6, we plot the difference between the pulsation mass, , and classical evolutionary mass, , corresponding to models without convective core overshoot on the main-sequence i.e. . We also show the effects of convective core overshoot on this diagram by displaying the difference between and evolutionary mass for models with and 1.0Hp (Fagotto et al. 1994 and A. G. Bressan 2001, private communication). The figure clearly shows that the pulsation masses are significantly smaller than those predicted by classical evolutionary models, and they are also smaller than the commonly implemented “mild” convective core overshoot models which have = 0.5Hp.
It has been suggested by Caputo et al. (2005) and Bono, Castellani, & Marconi (2002) that mass loss is responsible for the reduction of mass. As opposed to the models of Caputo et al. and Bono, Castellani, & Marconi that neglect mass loss, the models of Girardi et al. (2000) that we show in Figure 6 do incorporate mass-loss. In the mass regime of interest to the present work, it is important to note that the observational study of de Jager et al. (1988) shows negligible mass loss prior to the RGB phase and similarly on the blue loop excursion.
It is well known that significant mass loss can occur during the RGB phase. In the models of Girardi et al. this is modeled using the parameterized empirical fit (Reimers, 1975) where . The value of is derived from consideration of the mass of stars on the horizontal branch (HB), however a single value of can not account for the range of masses seen on the HB. Typical masses range from 0.8M⊙ for red HB stars to 0.5M⊙ for extreme HB stars. This is a long standing problem: Yong et al. (2000) suggests that mass loss rates of to M can produce a population of extreme HB stars. Vink & Cassisi (2002), on the other hand, compute mass loss rates from radiation pressure and find they are insufficent to give rise to mass loss of this order on the HB.
If we consider the distribution of effective temperatures for HB stars is entirely due to variable mass loss on the RGB we must allow to range from 0 to more than 0.4. The upper range of is not easily defined as there exists no detailed modern investigation of the effects of varying beyond the recent evolutionary models of Pietrinferni et al. (2004) who consider =0.2 and 0.4. To account for the mass discrepancy for a 5M⊙ star would require mass loss of some 0.8M⊙ during the RGB phase. By contrast, the models of Girardi et al. (2000) loose 0.03M⊙. To account for the observed mass discrepancy would have to be some 20-30 times larger which hardly seems plausible. We therefore conclude that it is unlikely that mass loss on the RGB can explain the observed Cepheid mass discrepancy.
Attempts to measure the mass loss rate during the Cepheid phase have been made by Deasy (1988) who utilized the infrared excess from IRAS data in combination with UV line profiles from IUE spectra. Mass loss rates spanned the range from to M. However, the high end of mass loss range is defined by only one object in the sample of Deasy namely RS Pup, well-known for its surrounding nebulosity. The majority of Cepheids are characterised by mass loss rates of the order of M. Furthermore, mass loss rates for Cepheids are not found to be significantly different from those of non-variable supergiants in the vicinity of the instability strip. Welch & Duric (1988) place upper limits on the mass loss rate from radio observations of M. Both studies conclude that mass loss is insufficent in and of itself to resolve the Cepheid mass discrepancy.
Uncertainty in opacity is also unlikely to explain the mass discrepancy (via a change in derived pulsation mass). Critical to the pulsation properties of Cepheids is the Z-bump opacity arising from the dense spectrum of transitions originating from highly ionized Fe. Inclusion of these transitions in the works of OPAL (Rogers & Iglesias, 1992) and OP (Seaton et al., 1994) resulted in a substantial increase in opacity at . The Opacity Project (Badnell et al., 2005) have recently included further details of atomic structure (in particular, the treatment of atomic inner-shell processes) in their calculation of opacity. The new opacities of Badnell et al. (2005) do show an increase over the 1992 OP and OPAL values of opacity in the Z-bump but at a level of only 5-10%. To account for the mass discrepancy we observe, the opacity would need to be raised by 40-50%, equivalent to the increase between the early Los Alamos opacities (Cox & Tabor, 1976) and 1992 OPAL-OP opacities.
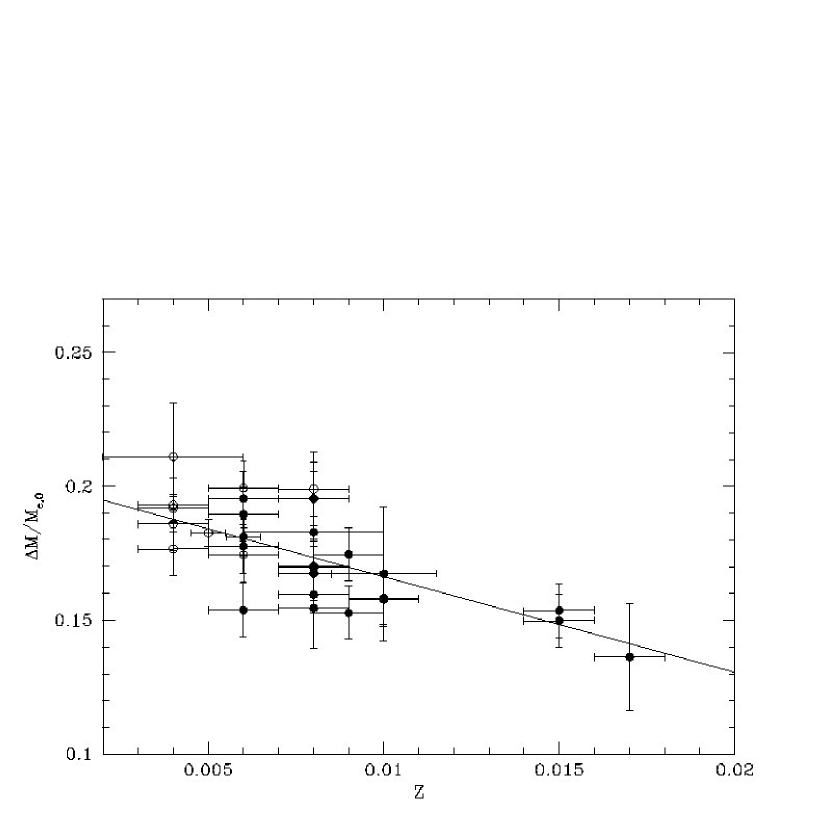
In Figure 7 we examine mass discrepancy as a function of metallicity. There is a clear increase in the fractional mass discrepancy with decreasing metallicity: the slope of the correlation seen in Figure 7 is different from zero by more than 5-sigma. In order to produce the observed change in mass discrepancy with metallicity, it is necessary for to increase with decreasing Z. The changes in mass discrepancy are small, rising from = 0.16920.0022222Quoted uncertainties are 1 from Monte-Carlo realizations of the data using the individual quoted uncertainties () at the derived mean LMC metallicity of Z=0.0091 to 0.18360.0021 () at SMC metallicity of Z=0.0050.
In showing that the extent of the convective core is significantly larger than that defined by the Schwarzschild criterion, we can not determine its physical origin. In addition to the ad-hoc convective core overshoot model we have discussed above, one natural way to bring about larger internal mixing is via the effects of rotation. The sheer layer formed at the interface between convective and radiative regions has been shown to lead to larger He core size (Heger, Langer, & Woosley, 2000; Meynet & Maeder, 2000). Furthermore, rotation can account for the range in surface abundance modifications seen in stars of M⊙ during both the pre- and post-first-dredge-up stages (Venn, 1995; Dufton et al., 2000; Daflon et al., 2001; Gies & Lambert, 1992). Furthermore, Venn (1999) finds evidence for a range of N abundance enhancements amongst a sample of SMC A supergiants that is much greater than that found in Galactic counterparts. Taken together, these various observations suggest that average stellar rotation increases in lower metallicity populations (or at least that it increases from the Galaxy to the LMC to the SMC). Such an effect has been seen directly by Keller (2004) who made a comparison of the rotation velocity distribution of MM⊙ main-sequence stars in the LMC and the Galaxy. The findings of the present paper qualitatively match that expected from the rotationally-induced mixing paradigm provided rotation increases with decreasing metallicity.
5 Conclusions
By matching the observed light and color curves of 19 LMC and 9 SMC bump Cepheids we have been able to place tight constraints on the fundamental stellar parameters of mass, luminosity, effective temperature and metallicity and the secondary parameters of distance and reddening. The use of light curve fitting to derive metallicity is a new technique developed here. We have revisited the mass discrepancy that exists between the masses derived from pulsation modelling and the masses predicted from stellar evolution for bump Cepheids. The derived pulsational masses are significantly less than expected from stellar evolution models that do not incorporate extension to the convective core during main-sequence evolution. Significant overshoot of the convective core during the main-sequence phase is required to bring pulsation and evolutionary masses into agreement. In addition, we find that the amount of overshoot is a function of metallicity. The level of convective core overshoot rises from 0.6880.009Hp at LMC metallicity to 0.7460.009Hp at typical SMC metallicity. This trend with metallicity is qualitatively in line with expectation from models that incorporate rotationally-induced mixing provided rotation increases with decreasing metallicity.
Work is currently underway to further refine our technique by the comparison of radial velocity measurements with those predicted by our models. This offers a more stringent test of the details of our pulsation models without limitations imposed by systematic photometric uncertainties (viz. bolometric corrections, photometric transformations and zeropoints).
References
- Alexander & Ferguson (1994) Alexander, D. R. & Ferguson, J. W. 1994, ApJ, 437, 879
- Alves (2004) Alves, D. R. 2004, New Astronomy Review, 48, 659
- Badnell et al. (2005) Badnell, N. R., Bautista, M. A., Butler, K., Delahaye, F., Mendoza, C., Palmeri, P., Zeippen, C. J., & Seaton, M. J. 2005, MNRAS, 360, 458
- Barmina et al. (2002) Barmina, R., Girardi, L.,Chiosi, C. 2002, A&Aaccepted, astro-ph/0202128
- Beaulieu (1998) Beaulieu, J. P. 1998, Memorie della Societa Astronomica Italiana, 69, 21
- Bessell (1991) Bessell, M. S. 1991, A&A, 242, L17
- Bessell, Castelli, & Plez (1998) Bessell, M. S., Castelli, F., & Plez, B. 1998, A&A, 333, 231
- Bono et al. (2000) Bono, G., Marconi, M., & Stellingwerf, R. F. 2000, A&A, 360, 245
- Bono, Castellani, & Marconi (2002) Bono, G., Castellani, V., & Marconi, M. 2002, ApJ, 565, L83
- Bressan, Chiosi, & Bertelli (1981) Bressan, A. G., Chiosi, C., & Bertelli, G. 1981, A&A, 102, 25
- Bressan (2001) Bressan, A. G., 2001, priv. comm.
- Caputo et al. (2005) Caputo, F., Bono, G., Fiorentino, G., Marconi, M., & Musella, I. 2005, ApJ, 629, 1021
- Chiosi et al. (1992) Chiosi, C., Bertelli, G., Bressan, A. 1992, ARA&A, 30, 235
- Cordier et al. (2002) Cordier, D., Lebreton, Y., Goupil, M.-J., Lejeune, T., Beaulieu, J.-P. & Arenou, F. 2002, A&A submitted
- Cox & Tabor (1976) Cox, A. N., & Tabor, J. E. 1976, ApJS, 31, 271
- Daflon et al. (2001) Daflon, S., Cunha, K., Butler, K., & Smith, V. V. 2001, ApJ, 563, 325
- de Jager et al. (1988) de Jager, C., Nieuwenhuijzen, H., & van der Hucht, K. A. 1988, A&AS, 72, 259
- Deasy (1988) Deasy, H. P. 1988, MNRAS, 231,
- Dufton et al. (2000) Dufton, P. L., McErlean, N. D., Lennon, D. J., & Ryans, R. S. I. 2000, A&A, 353, 311
- Eggleton et al. (2003) Eggleton, P. P., Bazán, G., Cavallo, R. M., Dearborn, D. S. P., Dossa, D. D., Keller, S. C., Taylor, A. G., & Turcotte, S. 2003, ASP Conf. Ser. 293: 3D Stellar Evolution, 293, 15
- Feuchtinger, Buchler & Kollath (2000) Feuchtinger, M., Buchler, J. R. & Kollath, Z. 2000, ApJ, 544, 1056
- Girardi et al. (2000) Girardi, L., Bressan, A., Bertelli, G., & Chiosi, C. 2000, A&AS, 141, 371
- Gies & Lambert (1992) Gies, D. R. & Lambert, D. L. 1992, ApJ, 387, 673
- Groenewegen (2000) Groenewegen M. A. T., 2000, A&A, 363, 901
- Heger, Langer, & Woosley (2000) Heger, A., Langer, N., & Woosley, S. E. 2000, ApJ, 528, 368
- Hertzsprung (1926) Hertzsprung, E. 1926, Bull. astronom. Inst. Netherl., 3, 115
- Hilditch et al. (2005) Hilditch, R. W., Howarth, I. D., & Harries, T. J. 2005, MNRAS, 357, 304
- Iglesias & Rogers (1996) Iglesias, C.A. & Rogers, F.J. 1996, ApJ, 464, 943
- Keller, Da Costa, & Bessell (2001) Keller, S. C., Da Costa, G. S., & Bessell, M. S. 2001, AJ, 121, 905
- Keller & Wood (2002) Keller, S. C., & Wood, P.R. 2002, ApJ, 578, 144
- Keller (2004) Keller, S. C. 2004, PASA, 21, 310
- Kolláth et al. (2002) Kolláth, Z., Buchler, J.R., Szabó, R. Csubry, Z. 2002, A&A, 385, 932
- Luck et al. (1998) Luck, R. E., Moffett, T. J., Barnes, T. G., & Gieren, W. P. 1998, AJ, 115, 605
- Marconi & Clementini (2005) Marconi, M. & Clementini, G. 2005, AJ, 129, 2257
- Mathis (1990) Mathis, J. S. 1990, ARA&A, 28, 37
- Mermilliod & Maeder (1986) Mermilliod, J.C. & Maeder, A. 1986, A&A, 158, 45
- Meynet & Maeder (2000) Meynet, G. & Maeder, A. 2000, A&A, 361, 101
- Moskalik, Buchler, & Marom (1992) Moskalik, P., Buchler, J. R., & Marom, A. 1992, ApJ, 385, 685
- Moskalik et al. (2000) Moskalik, P., Krzyt, T., Gorynya, N. A., Samus, M. N., 2000, in: Szabdos L., Kurtz D. (eds.), The Impact of Large-Scale Surveys on Pulsating Star Research, IAU Coll. 197, San Francisco: ASP.
- Pietrinferni et al. (2004) Pietrinferni, A., Cassisi, S., Salaris, M., & Castelli, F. 2004, ApJ, 612, 168
- Reimers (1975) Reimers, D. 1975, Memoires of the Societe Royale des Sciences de Liege, 8, 369
- Renzini & Fusi Pecci (1988) Renzini, A., & Fusi Pecci, F. 1988, ARA&A, 26, 199
- Rogers & Iglesias (1992) Rogers, F.J. & Iglesias, C.A. 1992, ApJS, 79, 507
- Romaniello et al. (2005) Romaniello, M., Primas, F., Mottini, M. Groenewegen, M. Bono, G.; Fran çois, P. 2005, A&A, 429, 37
- Schaller et al. (1992) Schaller, G., Schaerer, D., Meynet, G., & Maeder, A. 1992, A&AS, 96, 269
- Seaton et al. (1994) Seaton, M. J., Yu Yan, Mihilias, D., Phadhan A. K., 1994, MNRAS, 266, 805
- Stobie (1969) Stobie, R. S. 1969, MNRAS, 144, 511.
- Testa et al. (1999) Testa, V., Ferraro, F. R., Chieffi, A., Straniero, O., Limongi, M., & Fusi Pecci, F. 1999, AJ, 118, 2839
- Udalski et al. (1999) Udalski, A., Szymanski, M., Kubiak, M., Pietrzynski, G., Soszynski, I., Wozniak, P., & Zebrun, K. 1999, Acta Astronomica, 49, 201
- Venn (1999) Venn, K. A. 1999, ApJ, 518, 405
- Venn (1995) Venn, K. A. 1995, ApJ, 449, 839
- Vink & Cassisi (2002) Vink, J. S., & Cassisi, S. 2002, A&A, 392, 553
- Welch & Duric (1988) Welch, D. L., & Duric, N. 1988, AJ, 95, 1794
- Welch et al. (1997) Welch, D. L., Alcock, C., et al., 1997 in: Ferlet R., Maillard J.P., Raban B. (eds.), Variable Stars and the Astrophysical Returns of Microlensing Surveys (Editions Frontieres: Gif-sur-Yvette) p. 205
- Wood (1974) Wood, P. R. 1974, ApJ, 190, 609
- Wood, Arnold, & Sebo (1997) Wood, P. R., Arnold, A., & Sebo, K. M. 1997, ApJ, 485, L25 (Paper 1)
- Yong et al. (2000) Yong, H., Demarque, P., & Yi, S. 2000, ApJ, 539, 928
- Zahn (1991) Zahn, J.-P. 1991, A&A, 252, 179
- Zaritsky et al. (2002) Zaritsky, D., Harris, J., Thompson, I. B., Grebel, E. K., & Massey, P. 2002, AJ, 123, 855
- Zaritsky (1999) Zaritsky, D. 1999, AJ, 118, 2824
| MACHO star id | RA (J2000) | Dec (J2000) | - | [d] | Other ID | |
|---|---|---|---|---|---|---|
| 212.16079.23 | 00 51 50.4 | -73 02 30 | 14.53 | 0.54 | 9.7300 | |
| 206.17173.5 | 01 09 04.8 | -72 20 15 | 14.41 | 0.56 | 9.1585 | HV 2087 |
| 212.15697.3 | 00 45 43.8 | -73 23 54 | 14.63 | 0.66 | 8.8492 | |
| 207.16317.9 | 00 55 52.0 | -72 22 35 | 14.59 | 0.43 | 7.7715 | HV 1666 |
| 212.16193.25 | 00 53 57.4 | -73 01 15 | 14.72 | 0.47 | 7.4978 | HV 1599 |
| 212.16024.17 | 00 51 24.7 | -72 56 43 | 14.53 | 0.38 | 7.2283 | HV 1527 |
| 212.16079.42 | 00 51 38.1 | -73 01 43 | 14.99 | 0.46 | 6.6606 | |
| 212.16015.8 | 00 50 47.0 | -73 02 30 | 14.99 | 0.57 | 6.5466 | HV 1512 |
| 211.16704.8 | 01 01 38.9 | -73 10 23 | 15.18 | 0.46 | 6.4911 | |
| 79.4657.3939 | 05 08 49.4 | -68 59 59 | 14.23 | 0.43 | 13.8793 | |
| 9.4636.3 | 05 09 04.5 | -70 21 55 | 14.16 | 0.41 | 13.6315 | |
| 2.4661.3597 | 05 09 16.0 | -68 44 30 | 14.32 | 0.39 | 11.8591 | HV 905 |
| 1.3692.17 | 05 02 51.4 | -68 47 06 | 14.53 | 0.39 | 10.8552 | |
| 1.3441.15 | 05 01 52.0 | -69 23 23 | 14.45 | 0.37 | 10.4136 | HV 2277 |
| 1.3812.15 | 05 03 57.3 | -68 50 25 | 14.61 | 0.39 | 9.7118 | OGLE LMC-SC14 178619 |
| 18.2842.11 | 04 57 50.2 | -68 59 23 | 14.83 | 0.38 | 8.8311 | |
| 79.5139.13 | 05 11 53.1 | -69 06 49 | 14.59 | 0.38 | 8.7716 | |
| 19.4303.317 | 05 06 39.9 | -68 25 13 | 14.65 | 0.37 | 8.7133 | OGLE LMC-SC13 194103 |
| 79.5143.16 | 05 12 18.8 | -68 52 46 | 14.61 | 0.34 | 8.2105 | |
| 79.4778.9 | 05 09 56.3 | -68 59 41 | 14.56 | 0.33 | 8.1868 | |
| 77.7189.11 | 05 24 33.3 | -69 36 41 | 14.73 | 0.39 | 7.7712 | |
| 1.4048.6 | 05 05 08.8 | -69 15 12 | 14.77 | 0.36 | 7.7070 | |
| 77.7670.919 | 05 27 55 | -69 48 05 | 14.85 | 0.34 | 7.4423 | |
| 9.5240.10 | 05 13 10.1 | -70 26 47 | 15.11 | 0.38 | 7.3695 | HV 2386 |
| 9.5608.11 | 05 15 04.7 | -70 07 11 | 14.81 | 0.35 | 7.0693 | HV 919 |
| 78.6581.13 | 05 20 56.0 | -69 48 19 | 14.97 | 0.36 | 6.9306 | |
| 19.4792.10 | 05 09 36.9 | -68 02 44 | 14.96 | 0.36 | 6.8628 | HV 2337 |
| 6.6456.4346 | 05 20 23.1 | -70 02 33 | 15.16 | 0.36 | 6.4816 |
| MACHO star id | [d] | log() | E(-) | log(/L⊙) | /M⊙ | |||
|---|---|---|---|---|---|---|---|---|
| 212.16079.23 | 9.7300 | 1.980 | 3.763 | 0.138 | 18.940 | 3.61 | 5.57 | 0.005 |
| 206.17173.5 | 9.1585 | 1.985 | 3.765 | 0.112 | 18.895 | 3.58 | 5.15 | 0.004 |
| 212.15697.3 | 8.8492 | 1.970 | 3.760 | 0.155 | 18.893 | 3.52 | 5.08 | 0.006 |
| 207.16317.9 | 7.7715 | 1.930 | 3.763 | 0.077 | 19.088 | 3.48 | 4.89 | 0.004 |
| 212.16193.25 | 7.4978 | 1.950 | 3.765 | 0.127 | 18.873 | 3.46 | 4.79 | 0.004 |
| 212.16024.17 | 7.2283 | 1.945 | 3.767 | 0.104 | 18.989 | 3.68 | 5.44 | 0.008 |
| 212.16079.42 | 6.6606 | 1.945 | 3.772 | 0.120 | 18.901 | 3.33 | 4.42 | 0.006 |
| 212.16015.8 | 6.5466 | 1.920 | 3.768 | 0.131 | 18.849 | 3.40 | 4.71 | 0.004 |
| 211.16704.8 | 6.4911 | 1.940 | 3.767 | 0.123 | 18.933 | 3.34 | 4.11 | 0.004 |
| 79.4657.3939 | 13.8793 | 2.035 | 3.755 | 0.104 | 18.499 | 3.82 | 6.57 | 0.017 |
| 9.4636.3 | 13.6315 | 2.037 | 3.755 | 0.074 | 18.530 | 3.85 | 6.51 | 0.008 |
| 2.4661.3597 | 11.8591 | 2.022 | 3.760 | 0.061 | 18.544 | 3.66 | 5.66 | 0.008 |
| 1.3692.17 | 10.8552 | 1.980 | 3.767 | 0.068 | 18.515 | 3.66 | 5.86 | 0.006 |
| 1.3441.15 | 10.4136 | 1.980 | 3.767 | 0.073 | 18.555 | 3.64 | 5.69 | 0.004 |
| 1.3812.15 | 9.7118 | 1.968 | 3.766 | 0.079 | 18.478 | 3.64 | 5.79 | 0.015 |
| 18.2842.11 | 8.8311 | 1.954 | 3.767 | 0.049 | 18.407 | 3.57 | 5.32 | 0.006 |
| 79.5139.13 | 8.7716 | 1.948 | 3.768 | 0.072 | 18.495 | 3.57 | 5.42 | 0.006 |
| 19.4303.317 | 8.7133 | 1.950 | 3.765 | 0.047 | 18.396 | 3.60 | 5.66 | 0.009 |
| 79.5143.16 | 8.2105 | 1.952 | 3.763 | 0.119 | 18.546 | 3.55 | 5.46 | 0.010 |
| 79.4778.9 | 8.1868 | 1.951 | 3.762 | 0.072 | 18.601 | 3.51 | 5.36 | 0.008 |
| 77.7189.11 | 7.7712 | 1.940 | 3.763 | 0.092 | 18.613 | 3.51 | 5.36 | 0.010 |
| 1.4048.6 | 7.7070 | 1.935 | 3.767 | 0.064 | 18.604 | 3.44 | 5.09 | 0.008 |
| 77.7670.919 | 7.4423 | 1.932 | 3.767 | 0.073 | 18.584 | 3.50 | 5.24 | 0.008 |
| 9.5240.10 | 7.3695 | 1.956 | 3.767 | 0.088 | 18.673 | 3.31 | 4.75 | 0.010 |
| 9.5608.11 | 7.0693 | 1.935 | 3.760 | 0.117 | 18.655 | 3.46 | 5.24 | 0.015 |
| 78.6581.13 | 6.9306 | 1.938 | 3.762 | 0.088 | 18.587 | 3.40 | 4.93 | 0.009 |
| 19.4792.10 | 6.8628 | 1.905 | 3.772 | 0.051 | 18.423 | 3.43 | 4.89 | 0.006 |
| 6.6456.4346 | 6.4816 | 1.929 | 3.776 | 0.093 | 18.624 | 3.22 | 4.46 | 0.008 |