NLTE Strontium and Barium in metal poor red giant stars
Abstract
We present atmospheric models of red giant stars of various metallicities, including extremely metal poor (XMP, ) models, with many chemical species, including, significantly, the first two ionization stages of Strontium (Sr ) and Barium (Ba ), treated in Non-Local Thermodynamic Equilibrium (NLTE) with various degrees of realism. We conclude that 1) for all lines that are useful Sr and Ba abundance diagnostics the magnitude and sense of the computed NLTE effect on the predicted line strength is metallicity dependent, 2) the indirect NLTE effect of overlap between Ba and Sr transitions and transitions of other species that are also treated in NLTE non-negligibly enhances NLTE abundance corrections for some lines, 3) the indirect NLTE effect of NLTE opacity of other species on the equilibrium structure of the atmospheric model is not significant, 4) the computed NLTE line strengths differ negligibly if collisional and rates are an order of magnitude smaller or larger than those calculated with standard analytic formulae, and 5) the effect of NLTE upon the resonance line of Ba II at 4554.03 Å is independent of whether that line is treated with hyperfine splitting. As a result, the derivation of abundances of Ba and Sr for metal-poor red giant stars with LTE modeling that are in the literature should be treated with caution.
1 Introduction
Generally, the time development of the neutron capture (-capture) element () abundances over the galaxy’s history encodes information about the astrophysical sites of the various -capture processes, such as the “classical” rapid process (-process), and the weak and main slow processes (-processes), and their relation to the sites of light metal () nucleosynthesis (see Cowan & Thielemann (2004) for a general review). High quality spectroscopy of metal-poor and extremely metal-poor (XMP) red giants in the halo component of the Milky Way galaxy has allowed the determination of -capture element abundances at very early times in the formation of the galaxy (see James et al. (2004) (hereafter: JFBCGS04), for a recent example). In particular, the abundances of Sr and Ba are significant because, if their formation is understood correctly, they may indicate the relative rate of nucleosynthesis of light and heavy -capture elements, and, by extension, the relative importance of the weak and main -processes in the chemical evolution of the galaxy (see JFBCGS04 and references therein).
Almost all large scale abundance surveys of old red giants to date have been carried out with atmospheric models and synthetic spectra computed under the assumption of Local Thermodynamic Equilibrium (LTE), either with MARCS models (Edvardsson et al., 1993) or ATLAS9 models (Kurucz, 1994). Generally, previous investigation has indicated that the equilibrium state, and, thus, the line opacity, of many elements may deviate from LTE, particularly in giant atmospheres where gas densities, and, hence, thermalizing collision rates, are low (see Short & Hauschildt (2003) for example). Furthermore, it has been found that the extent of NLTE effects depends on the overall metallicity, of the atmosphere. Mashonkina et al. (1999), (hereafter: MGB99), carried out Non-LTE (NLTE) modeling of the Ba II lines for main sequence and turn-off stars using a complete linearization method to solve the NLTE statistical equilibrium (SE) rate equations given an LTE atmospheric model structure. The study of MGB99 is an important pioneering calculation, and concluded that NLTE effects affected the inferred abundance of Ba by as much as dex for stars of . However, there are three things about the study of MGB99 that we draw attention to: 1) it is not self-consistent in that the model structure adopted does not take into account NLTE effects on the many other species, such as Fe, whose opacities determines the radiative equilibrium structure, 2) it is not self-consistent in that other species that may have overlapping transitions with Ba are treated in LTE, 3) because of the inefficiency of the complete linearization method the Ba II atomic model is incomplete, having 35 levels and (judging by the Grotrian diagram in their Fig. 1) 28 bound-bound () transitions. It is not clear that these limitations affect the results significantly without performing numerical experiments with the same models. However, as described in Section 2, our NLTE modeling should be more realistic on all three of these points.
The atmospheric and spectrum modeling with the PHOENIX code for the mildly metal-poor red giant Arcturus ( Boo, HD124897, spectral type K2 III) presented by Short & Hauschildt (2003) included many thousands of lines of many species in NLTE, but did not include Sr or Ba . We have recently added to the NLTE atmospheric and spectrum synthesis code PHOENIX the ability to compute both of these species in NLTE. The purpose of the present investigation is to determine the effect on the computed Sr and Ba lines, and, hence, on the inferred abundances, of three types of NLTE consideration: 1) direct NLTE effects on the Sr and Ba equilibrium and line formation, 2) indirect NLTE effects on the atmospheric structure from NLTE effects on the opacity of many other chemical species, and 3) the indirect NLTE effect on the computed Sr or Ba state by overlap of Sr and Ba transitions with transitions of other species also in NLTE. Moreover, we investigate how the NLTE effects vary with overall value of , including XMP values. Here, the investigation is carried out for the most readily observable metal poor stars in the galactic halo: red giants. In Section 2 we describe the model calculations, in Section 3 we present our results, and we re-iterate our main conclusions in Section 4.
2 Modeling
2.1 Stellar parameters
To represent a typical XMP red giant of the type that has been observed in the galactic halo we adopt the following stellar parameters: a value of 4800 K, a value of , a value for the microturbulent velocity dispersion, , of 2.0 km s-1, and a convective mixing length parameter of 2 pressure scale heights. The models are computed with spherical geometry with a radius at the surface of cm ( 25 R⊙), where is the optical depth due to continuous opacity at a standard reference wavelength of 12000 Å. These parameters were chosen to be approximately representative of two XMP red giants recently described by Cayrel et al. (2004): CD -38:245 and CS 22949-037.
Abundances:
A set of models of these parameters was generated with a scaled solar abundance distribution spanning a range in value from -1 (mildly metal poor) to -5 (XMP), with an interval of -1. We adopt the solar abundances of Grevesse et al. (1992). In all cases the values of and equal the value of . The use of a scaled solar abundance distribution is known to be unrealistic for Pop II, and especially extreme Pop II, stars. However, there is a range of abundance distributions that has been found for XMP stars, so no one choice would represent all of them. Furthermore, the purpose of our study is to investigate differential effects of value on the NLTE spectrum formation of Sr and Ba , and, to begin with, we suppose that the abundance distribution will be unimportant to first order for such differential effects.
2.2 PHOENIX
PHOENIX makes use of a fast and accurate Operator Splitting/Accelerated Lambda Iteration (OS/ALI) scheme to solve self-consistently the radiative transfer equation and the NLTE statistical equilibrium (SE) rate equations for many species and overlapping transitions (Hauschildt & Baron, 1999). In our fully self-consistent models (NLTEFull models, described below) we include a total of 39 species in the set of multi-level NLTE SE equations, including the lowest one to three ionization stages of most light metals up to and including the Fe group, as well as the first two ionization stages of Sr and Ba . We have only included ionization stages that are significantly populated at some depth in the atmosphere of a late-type star, as computed in radiative-convective equilibrium (ie. no chromosphere or transition region). Therefore, no ionization stages higher than III are treated in NLTE for any species. Short & Hauschildt (2005) contains details of the number of ionization stages, levels, and and bound-free () transitions included in the NLTE PHOENIX SE calculation for late-type stars, as well as the sources of atomic data and the formulae for various atomic processes.
2.3 Degrees of realism
Table 1 shows the four degrees of realism in our modeling:
1) NLTEFull: the most self-consistent NLTE models with 35 other species in addition to Sr and Ba I and II included in NLTE in the calculation of both the atmospheric and structure and the equilibrium state of Sr and Ba . Included in NLTE SE are species such as Fe I and II that are known to have an important effect on the computed radiative equilibrium structure. These models account for the indirect effects of both the NLTE opacity of many species on the atmospheric and structure, and multi-level NLTE effects caused by transitions of other species in NLTE that overlap with Sr and Ba transitions, as well as the direct effects of NLTE on Sr and Ba themselves.
2) NLTESr+Ba: only Sr and Ba treated in NLTE SE with the NLTEFull structure of 1). These models account for the effects of NLTE opacity of other species on the atmospheric structure, and for NLTE effects on Sr and Ba , but not for the effects of NLTE on transitions of other species that overlap those of Sr and Ba .
3) NLTELTE: deliberately inconsistent models in which the state of Sr and Ba is computed in LTE (ie. no species in the NLTE SE), but with the NLTEFull atmospheric structure of 1). The purpose of these models is to distinguish between effects on the Sr and Ba lines that are caused by direct NLTE effects on the Sr and Ba equilibrium and those that are caused by the NLTE atmospheric structure.
4) LTE: fully LTE models with the atmospheric and structure and the state of all species, including Sr and Ba , computed in LTE. These are the simplest models and are equivalent to the MARCS and ATLAS9 models that are largely used in abundance analyses.
2.4 Sr and Ba I and II
Table 2 contains details of the numbers of levels and transitions of Sr and Ba I and II included in the NLTE SE rate equations. All levels not designated as ”Sum” are fine structure () levels, and were included separately in the NLTE SE rate equations. Energy level values, values, and damping parameters have been taken from Kurucz (1994). Because the purpose of our study is to investigate the differential effect of modeling treatments rather than to fit observed spectra, we have not performed a quality control investigation or fine-tuned the atomic data, except for the collisional cross-section perturbation analysis that follows. As a point of information, we note that many of the fine structure level designations for these species in the atomic data base of Kurucz (1994) are erroneous. Among the the levels included in our atomic models, all levels of Ba and select levels of Sr were fixed to agree with the designations given in the National Institute of Standards and Technology (NIST) Atomic Spectra Database (for Ba ) or Handbook of Basic Atomic Spectroscopic Data (for Sr ). Unfortunately, we were unable to find data for many of the Sr levels in any of the readily accessible databases, so were unable to check the designations for all the levels. As with all the species treated in NLTE, only levels of Sr and Ba connected by transitions of value greater than -3 (designated primary transitions) are included directly in the SE rate equations. All other transitions of that species (designated secondary transitions) are calculated with occupation numbers set equal to the Boltzmann distribution value with excitation temperature equal to the local kinetic temperature, multiplied by the ground state NLTE departure co-efficient for the next higher ionization stage.
3 Results and Discussion
3.1 NLTEFull vs LTE
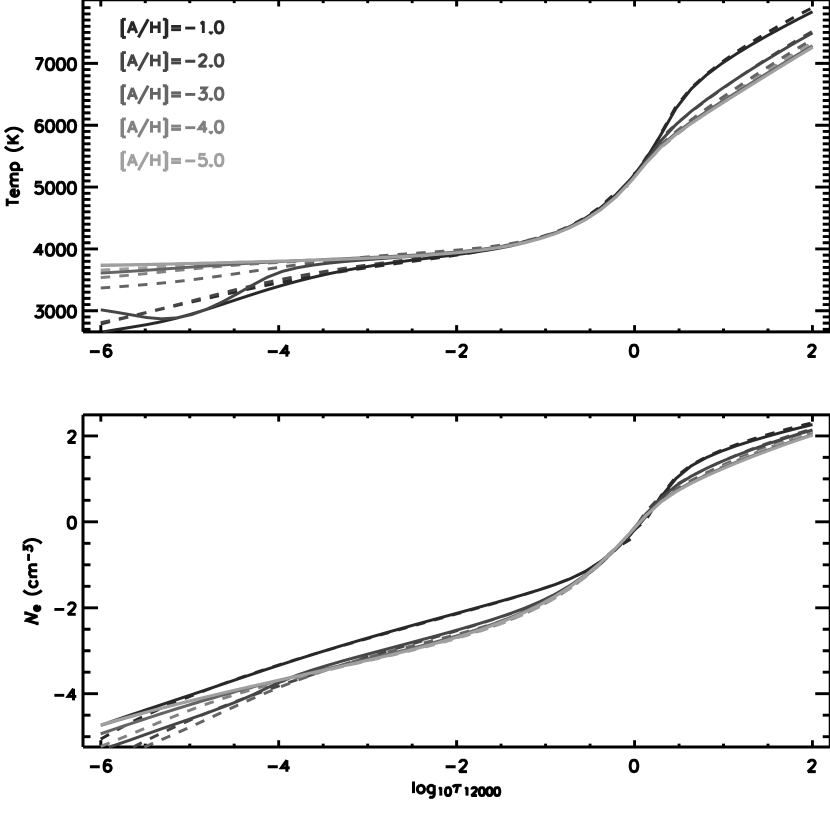
Fig. 1 shows the computed atmospheric and structures for the NLTEFull and LTE models for all values of . The NLTEFull models include much of the Fe group (the first two ionization stages of Ti , Mn , Fe , Co , and Ni ) in NLTE. These species, especially Fe , contribute much of the line opacity to the blue and UV bands and have a large effect on the computed radiative equilibrium of the atmosphere. Treating them in NLTE generally decreases near the bottom of the atmosphere and increases it near the top of the atmosphere, thereby exhibiting a reduction in the classical “back-warming” effect of line opacity. However, the difference in NLTE and LTE structures is negligible throughout much of the line forming region near . See Short & Hauschildt (2005) and Anderson (1989) for a detailed discussion of thermal equilibrium in late-type atmospheres with massive scale NLTE. There is a rapid increase in the boundary temperature at the top of the model between values of -1 and -3, and the model of shows complicated behavior between values of -4 and -6. However, the model has converged at all depths to a stable equilibrium, and its behavior is caused by being a critical value for the thermal equilibrium in the outer atmosphere.
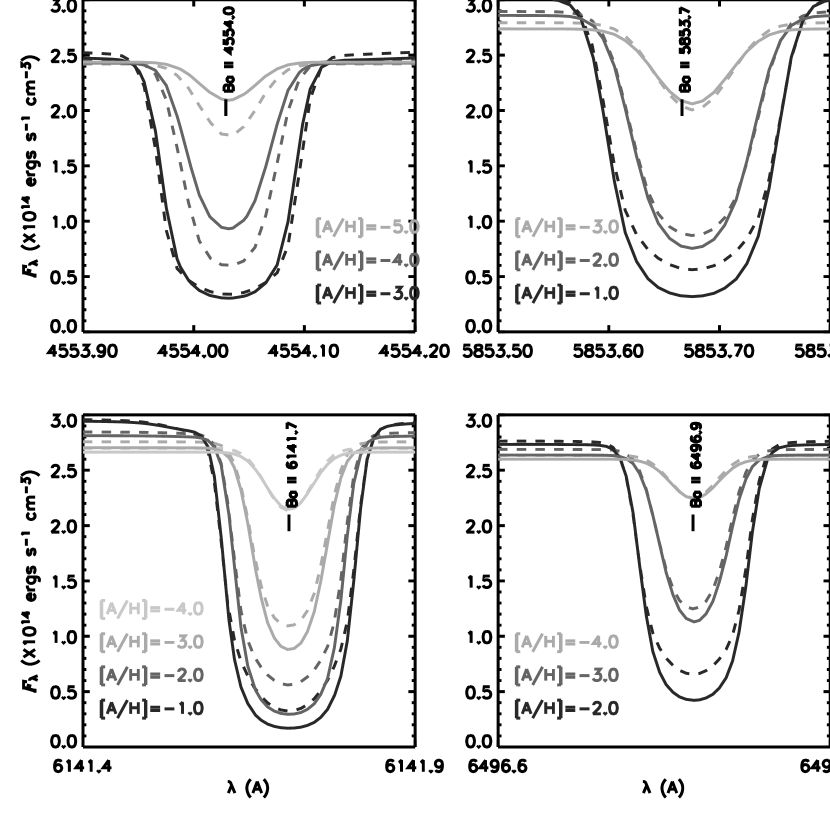
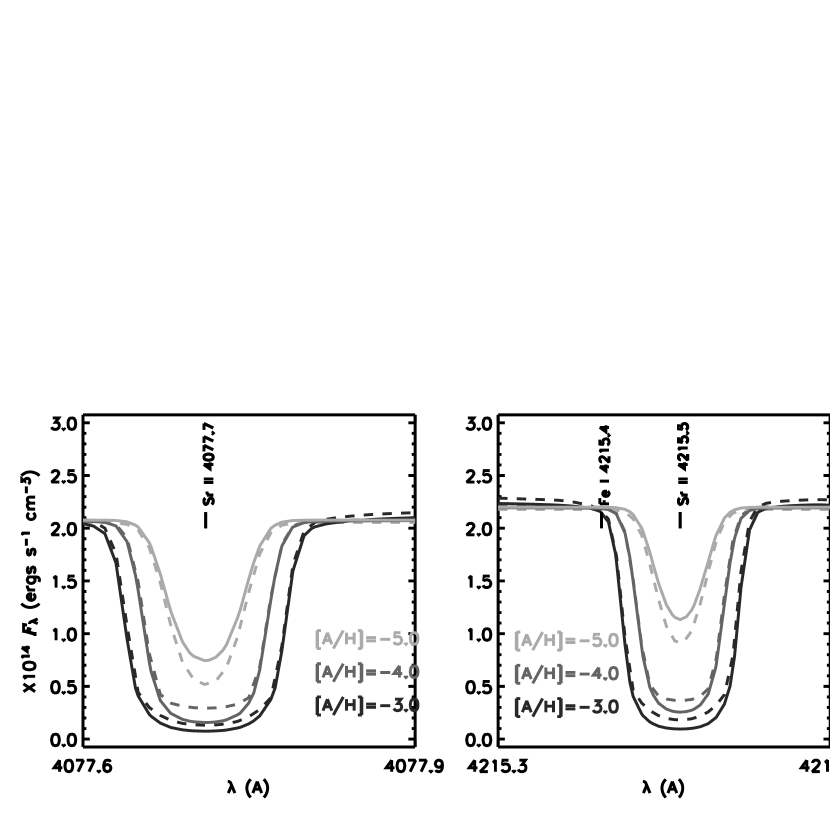
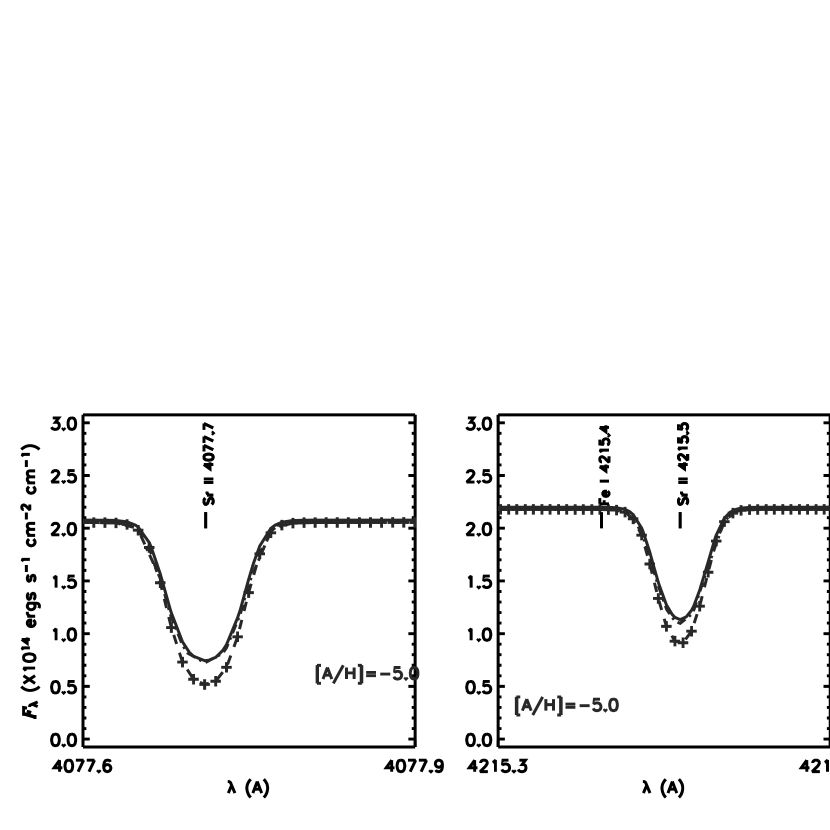
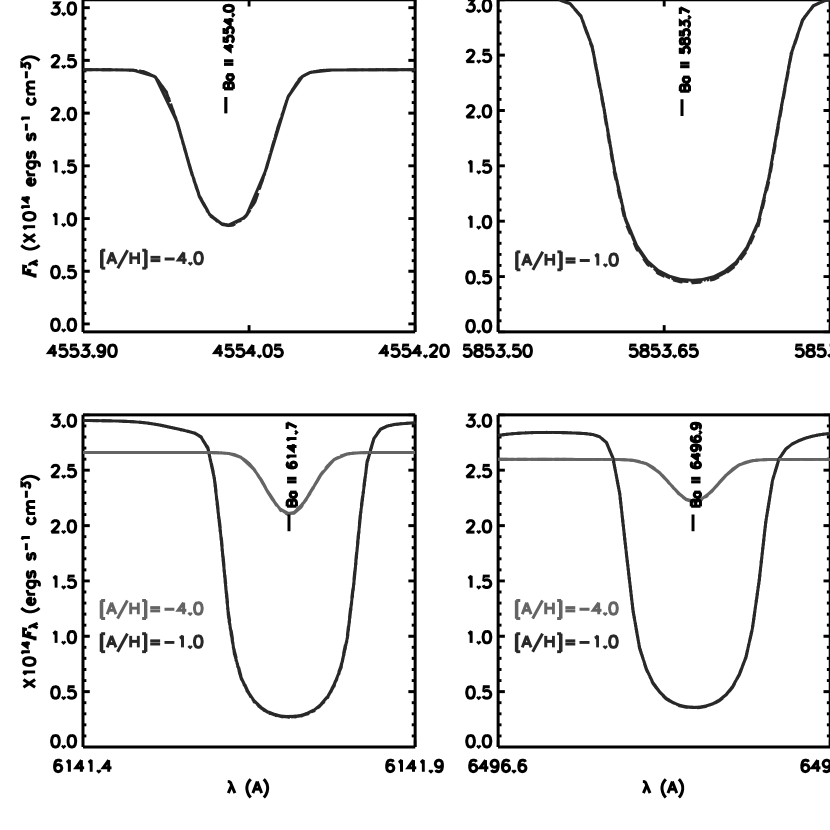
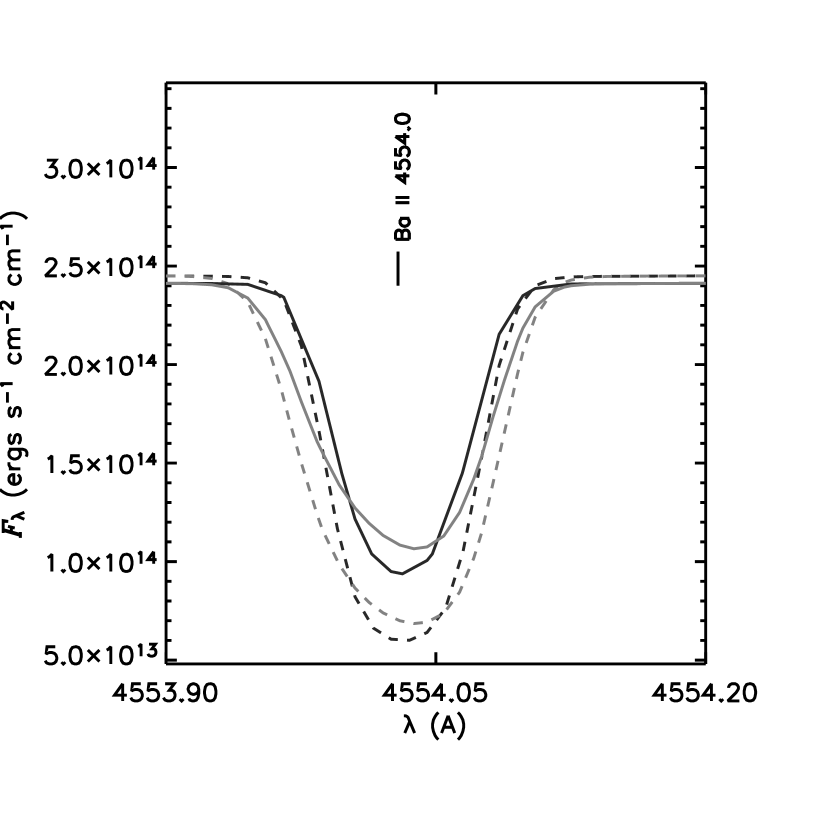
Figs. 2 and 3 show computed line profiles for the lines used as abundance diagnostics by JFBCGS04, with all wavelengths in air: Ba II 4554.03, 5853.69, 6141.73, and 6496.91, and Sr II 4077.71 and 4215.52 computed with the most and least realistic modeling, NLTEFull and LTE, respectively. Selected atomic data from Kurucz (1994) for these lines are presented in Table 3, with the designations of the atomic fine structure levels fixed to agree with the NIST Atomic Spectra Database or the Handbook of Basic Atomic Spectroscopic Data. For each line we show the profiles for those models of value for which that particular line is of detectable strength, yet on the linear part of the curve of growth (COG) (ie. unsaturated), or barely saturated, and thus maximally useful as an abundance diagnostic. These are also the lines for which NLTE effects, and the realism of their treatment, will make the greatest difference. Table 4 shows equivalent widths, , for these lines, computed with the various degrees of modeling realism. Again, for each line we only show values for models of value such that the line is detectably strong, yet unsaturated.
For both the Ba and Sr lines, the effect of NLTE as compared to LTE is to increase the predicted strength, , of the line for models of higher value and decreases it for models of lower value. We find that the critical value varies from line to line throughout almost the full range of values spanned by our models. Furthermore, for each line studied, the NLTE effect is significant at some value of . For unsaturated lines, NLTE corrections to and are proportional to in the sense that a model that predicts too large a value of because of inadequate physical treatment will cause the inferred value of or to be proportionally too small, and visa versa. We note that these results are qualitatively the same as those of MGB99 in their study of main sequence and turn-off stars.
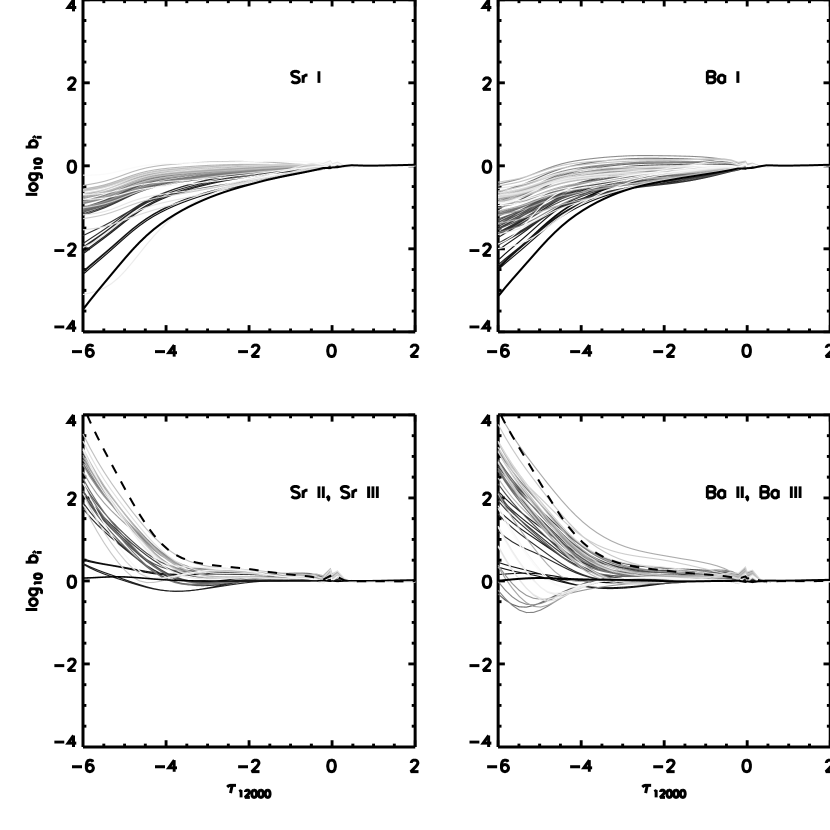
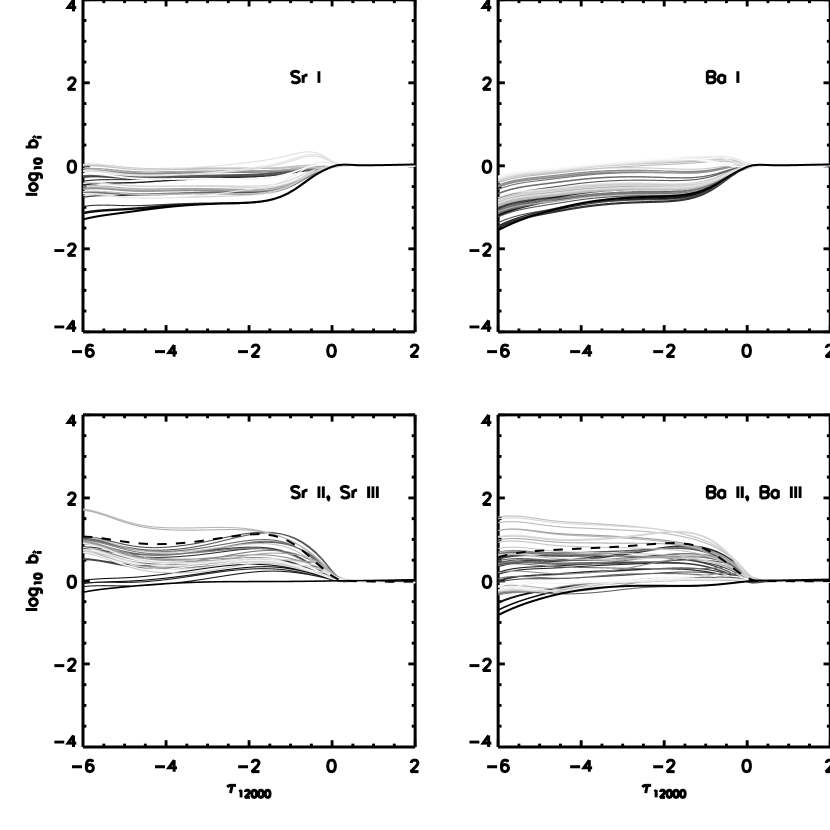
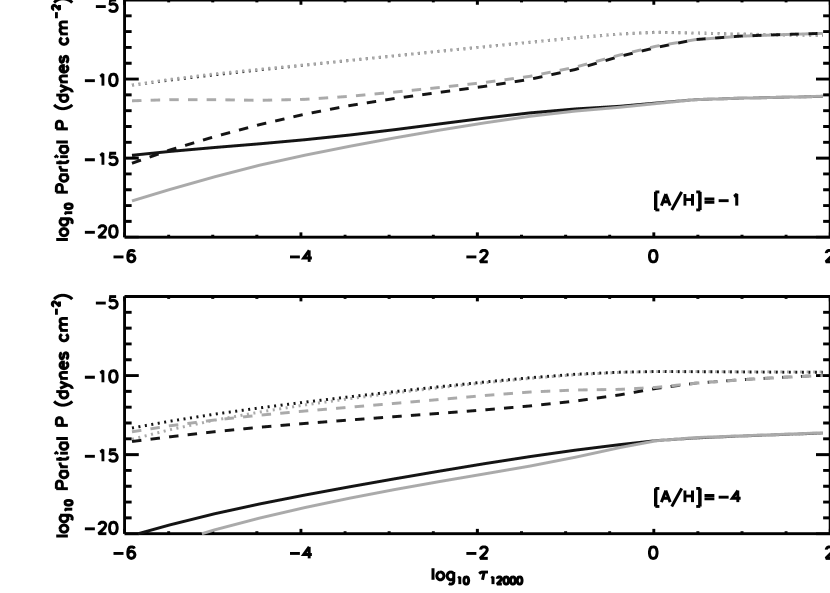
Figs. 4 and 5 show for the NLTEFull models of value equal to -1 and -4 the logarithm of the NLTE -level departure co-efficients, , for each -level, , of Sr and Ba stages I and II, and the ground state of stage III, where is the actual NLTE occupation number of level and is the occupation number of the level as computed with LTE equilibrium relations for all levels and stages with the local value of and the LTE . For the models of , the values for the ground level and the levels of lowest excitation energy of stage II remain close to unity throughout the atmosphere. This is expected because stage II is the dominant ionization state and so its total number density, most of which will be in the ground state, should be negligibly affected by departures from the LTE ionization equilibrium. However, for the model of , the ground state value for Ba II drops below unity for , and approaches 0.1 at the surface. The reason for the difference in the ground state behavior in the models of as compared to those of is that in the latter Ba II is no longer as dominant in the ionization equilibrium, but is rivaled by Ba III. For both values, many levels of higher excitation energy in stage II are overpopulated with respect to LTE () in the upper atmosphere due to the influence of collisional coupling to the ground level of stage III. The ground level of ionization stage III is overpopulated with respect to LTE in the outer atmosphere as a result of NLTE overionization of stage II (note that the ground level is the only level of stage III included in our SE equations). The ground state of stage I is underpopulated with respect to LTE in the upper atmosphere, again, as a result of NLTE over-ionization. In Fig. 8 we show the LTE and NLTE partial pressures of the three ionization stages of Ba for models of value equal to -1 and -4. We note that the results for the values are consistent with the partial pressure results.
From a comparison of Figs. 4 and 5 to Fig. 2 of MGB99 we note that for the models of the results for the ground levels of Ba II and III are qualitatively similar to theirs for the Sun, where their ground state value of for Ba II remains close to unity throughout the atmosphere. The results for the ground level of Ba II for our model are also qualitatively similar to those of MGB99 for their model of G84-29, which has . The latter also shows a drop below unity in the upper atmosphere. However, these comparisons are not expected to be exact because out models correspond to giant stars, whereas their correspond to main sequence stars.
3.2 NLTEFull vs NLTESr+Ba, NLTELTE and LTE
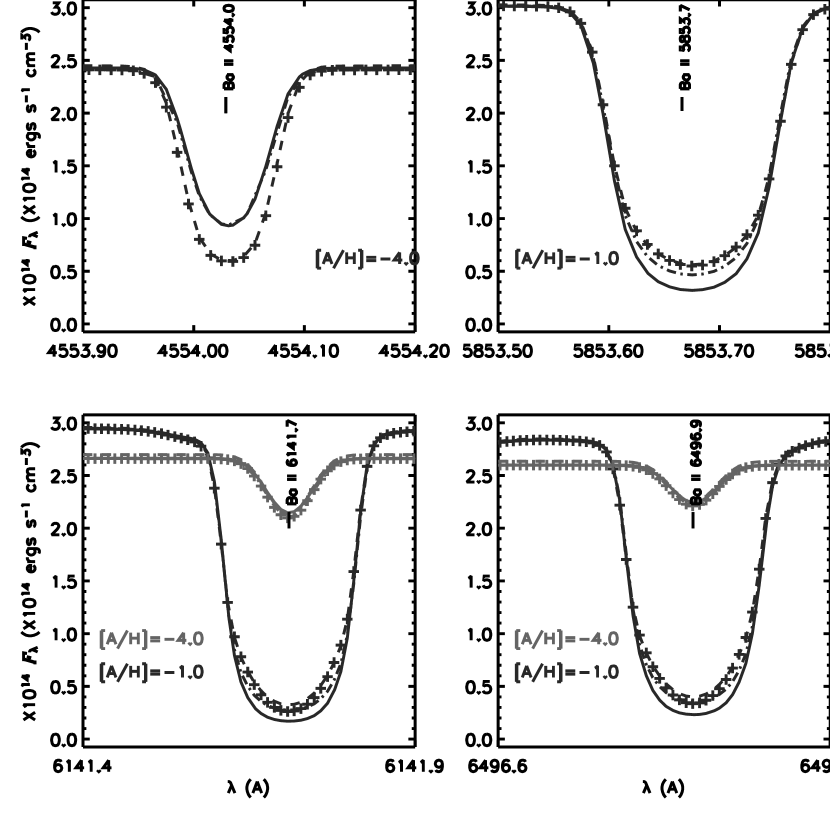
Figs. 6 to 7 demonstrate the sensitivity of the results to the degrees of realism and completeness in the treatment of the NLTE problem by comparing the NLTESr+Ba and NLTELTE results to those of the NLTEFull and LTE results. Note that we only carried out NLTESr+Ba and NLTELTE modeling for values of equal to -1, -4, and -5, and in Figs. 6 to 7 we only show profiles for those values for which that particular line is unsaturated.
We find that in some cases (Ba II 5853.69, 6141.73 and 6496.91 for ) the less realistic NLTESr+Ba models yield line profiles that differ significantly from those of the NLTEFull model and are closer to the LTE profiles than the NLTEFull profiles are. This indicates that these lines are indirectly affected by a significant amount by the non-local effect of overlapping transitions with other species that are also affected significantly by NLTE. In the case of these transitions of these species, the result of this “multi-species non-locality” is to enhance the deviation from the LTE results. Therefore, spectrum synthesis calculations in which only the species of immediate interest are treated in NLTE (Sr and Ba ) will underestimate NLTE corrections. This result points to the importance of a NLTE treatment for all species with significant line opacity for the correct NLTE solution for any one species. Particularly in late type stars where the spectrum is blanketed by lines, there may be any number of other species with transitions that overlap one or more of those of Sr or Ba whose equilibrium state thus determines the supply of photons that are available for absorption by the Sr or Ba transition that is so overlapped. (Moreover, the equilibrium state of those other species may in turn be affected by yet other species that deviate from LTE whose transitions overlap those of those species!) The significance of this result bears careful consideration given the number of NLTE abundance determinations in the literature that are based on LTE “background” line opacity for all species other than the one under investigation. (Indeed, a way of understanding this result is that from the perspective of NLTE SE, there is no such thing as “background” opacity; the set of NLTE SE equations non-locally couples the states of all species.)
However, we caution that the magnitude of this multi-species non-locality effect for a particular line, or particular species, depends sensitively on the degree of wavelength overlap between lines of the species of interest that are important for the excitation equilibrium, and strong lines of other species treated in NLTE. The degree of overlap and the magnitude of its influence, in turn, depends on the accuracy of the atomic level and oscillator strength () data that is used to calculate the wavelengths and strengths, respectively, of the lines of overlapping species. The atomic data of Kurucz (1994) has been produced originally for the purpose of computing the broad-band solar flux level in LTE, for which only statistically correct line opacity is important, and is known to contain erroneous level energies and values. Therefore, the degree of the effect predicted here may be subject to revision, either upward or downward, if more accurate atomic data were used for all species in the NLTE calculation. Due to the non-locality of this effect, an exploration of the sensitivity of the effect to the perturbation of various levels of various species is beyond the scope of the present investigation.
In all cases the profiles computed with NLTELTE modeling differ negligibly from those of LTE modeling. This indicates that the indirect effect of the NLTE opacity of other species on the atmospheric structure is much less important than the direct effect of NLTE SE on the Ba and Sr equilibrium and the less direct effect of overlapping transitions with other NLTE species. This result is consistent with the minor effect on the structure of NLTE seen in Fig. 1.
3.3 The role of collisional rates
The greater realism of NLTE modeling comes at the expense of reliance on a greater number of physical input data. Among those that are crucial to determining the NLTE SE equilibrium and that are among the least well determined are the collisional cross-sections, , for and processes. The first level above the ground state of Ba II has an excitation energy of 0.604 ergs, which corresponds to a of 4700 K for an ideal monatomic gas. Therefore, collisional transitions may be important for the excitation equilibrium of Ba II. In our modeling we use approximate values for collisions calculated with the formula reproduced in Lang (1999) for forbidden transitions for all transitions and of Drawin (1961) for transitions. Note that, for consistency of treatment among rates, and to reduce reliance of uncertain values, we do not use separate formulae for pairs of levels connected by permitted and forbidden transitions. Adding to the uncertainty in collisional rates is the possible role of collision partners other than electrons; MGB99 found that collisions with H atoms play a detectable role in the NLTE equilibrium state of Ba II in main sequence and turn-off stars.
To accommodate both of these considerations we perform a perturbation analysis by varying all the and values for Ba II by a factor of 0.1 and 10. According to Fig. 8, Ba I is at most times as abundant as Ba II and, thus, Ba I rates are not expected to affect the Ba II equilibrium. Moreover, there are no Ba I lines that are useful for abundance analysis. Therefore, we leave the Ba I rates unperturbed and vary separately both the and values for Ba II by a factor of 0.1 and 10. This approach assumes that any errors in values for either or processes are systematic among all transitions rather than random. However, a transition-by-transition perturbation analysis, even if limited to critical transitions, is beyond the scope of this investigation. The line opacity of Ba is not expected to affect the equilibrium atmospheric structure, so, with the values at their perturbed values, we re-converge the the Ba NLTE SE and recompute the spectrum using the NLTEFull model structure.
Fig. 9 shows the computed Ba II lines for the NLTEFull model with various values for the collisional cross-sections. We find that perturbation of both the and the rates by a factor of 100 produces both departure coefficients and line profiles that differ negligibly from the those calculated with the standard approximations. This indicates that the excitation and ionization equilibria populations of Ba II is robust. In the case of the ionization equilibrium, the result is expected given that Ba II is the dominantly populated ionization stage.
3.4 Hyperfine splitting of the Ba line
The importance of hyper-fine splitting (HFS) of the Ba lines, especially the line, has been well documented by McWilliam (1998), McWilliam et al. (1995), McWilliam & Rich (1994), and references therein, and these authors to various degrees present the formulae and data necessary for calculating the HFS components. HFS has the effect of de-saturating lines and thus significantly alters the inferred abundance from lines that are barely saturated and not yet heavily damped. For lines on the linear part of the COG, HFS changes the line profile, but not the value of . Because the hyper-fine sub-levels of a splitted level are relatively close to each other in , they are expected to be strongly coupled by collisional transitions, despite such transitions being forbidden. Therefore, all such sub-levels should have the same value as the unsplitted level, and we thus expect that the effect of HFS on the profile of a line computed in NLTE will be the same as that for a line computed in LTE. However, for the sake of completeness, and because the HFS line profile is of interest, we investigate the effect of HFS in NLTE.
We have modified our Ba II atomic model to account for HFS in the resonance line where the effect is known to be especially important. The structure of the PHOENIX code is such that it is more straightforward to represent the splitted sub-levels directly in the atomic model (the way nature does it) rather than by mimicing the effect of splitting by modifying the line profile function, , as is suggested by, for example, Gray (1992). We deduced the level splitting and the component values from the component and relative values given in Table 1 of McWilliam (1998). In stars, Ba may be significantly abundant over the range of atomic masses, , from 134 to 138. The component values are weighted by the relative abundance of the isotopes of odd value because only they have HFS. Because we are modeling metal-poor red giants, we follow McWilliam (1998) and Sneden et al. (1996), and adopt a pure -process isotopic mix of 0:40:0:32:28 for isotopes of A value of 134, 135, 136, 137, and 138, respectively, which amounts to an odd to even mix of 72:28.
Fig. 10 shows the line computed with the NLTEFull and LTE models with and without HFS in the treatment. We investigate the model of value equal to -4 for which the line is clearly on the linear part of the COG. As expected, the effect of HFS is to broaden the line while preserving its strength. We note that HFS also makes the line profile asymmetric as a result of the asymmetry of the HFS components. Also as expected, the effect of NLTE on the profile computed with HFS is the same as that for the profile computed without HFS; the extent of the NLTE weakening of the line is independent of the level splitting.
4 Conclusions
From comparison of LTE models with the most realistic NLTEFull models, we find that for all lines that are useful Sr and Ba abundance diagnostics the magnitude and sense of the computed NLTE effect on the predicted line strength is metallicity dependent, with stars of to showing NLTE strengthening of the lines and those of to showing NLTE weakening. These results are qualitatively similar to those of MGB99 for main sequence and turn-off stars and point to the need to account for NLTE effects when deriving spectroscopic Sr andBa abundances.
Ba :
From Table 4, we see that among the most affected lines is the Ba (resonance) for , for which (NLTEFull)-(LTE)=-0.14 (neglecting HFS), leading to a NLTE abundance correction of (because the line is on the linear part of the COG). For Ba in models of , (NLTEFull)-(LTE)=+0.04, leading to .
Sr :
Similar effects, though less pronounced, are found for the two Sr lines. We note that these lines are so strong that they are only on the linear part of the COG for the most metal poor of our models ( to ).
A less well studied NLTE effect is multi-species non-locality that arises from overlapping transitions that link the equilibrium state of one species with those of other species whose equilibrium also departs from LTE. By including most light metals up to and including much of the Fe group in NLTE (NLTEFull models), we find that for some lines such overlap enhances NLTE abundance corrections non-negligibly, and should, in principle, be accounted for for accurate abundance determination. From Table 4 the largest such effect is for Ba for for which (NLTEFull)-(Sr+Ba)=+0.03. However, we reiterate that the magnitude of this effect is dependent on the accuracy of the atomic data of the overlapping NLTE species. Given the notorious innacuracy of such data, caution is required on this point. Another indirect NLTE effect is that of the opacity of other species that depart from LTE that are important for radiative equilibrium of the atmosphere. We find that the NLTE structure is close enough to that of LTE in the line forming region that the effect on the computed Sr and Ba line profiles is negligible. We conclude that NLTE spectrum formation calculations with LTE atmospheric models will suffice for red giants. Freedom from the necessity to calculate large grids of NLTE atmospheric models for large NLTE abundance surveys will expedite such work.
We find that the computed NLTE line strengths differ negligibly if collisional and rates are an order of magnitude larger or smaller than those calculated with standard analytic formulae. Because collisional cross-sections are notoriously uncertain, the robustness against perturbation in this case provides some assurance that the results are not artifact of erroneous atomic data.
For completeness, we have also studies the effect of NLTE on the Ba resonance lines when HFS is taken into account. HFS for Ba has been extensively studied elsewhere and we reproduce the well-known result that HFS substantially widens the line and increases the residual flux at line center. Of note here is that, as expected from the close collisional coupling among the splitted sub-levels, the relative effect of NLTE is the same with and without HFS.
References
- Anderson (1989) Anderson, L.S., 1989, ApJ, 339, 558
- Cayrel et al. (2004) Cayrel, R., Depagne, E., Spite, M., Hill, V., Spite, F., Fran ois, P., Plez, B., Beers, T., Primas, F., Andersen, J., Barbuy, B., Bonifacio, P., Molaro, P., Nordstrom, B., 2004, A&A, 416, 1117
- Cowan & Thielemann (2004) Cowan, J.J. & Thielemann, F-K, 2004, Physics Today, 57, 10, 47
- Drawin (1961) Drawin, H. W., 1961, Z. Phys., 164, 513
- Edvardsson et al. (1993) Edvardsson, B., Andersen, J., Gustafsson, B., Lambert, D.L., Nissen, P.E., Tomkin, J., 1993, A&A, 275,101
- Gray (1992) Gray, D., 1992, The Observation and Analysis of Stellar Photospheres, 2nd ed., Cambridge University Press, p 231
- Grevesse et al. (1992) Grevesse, N., Noels, A., Sauval, A.J., 1992, In ESA, Proceedings of the First SOHO Workshop, p. 305
- Hauschildt & Baron (1999) Hauschildt, P.H. and Baron, E., 1999, J. Comp. App. Math., 109, 41
- James et al. (2004) James, G., Francois, P., Bonifacio, P., Carretta, E., Gratton, R.G., and Spite, F., 2004, A&A, 427, 825 JFBCGS04
- Kurucz (1994) Kurucz R.L., 1994, CD-ROM No 19
- Lang (1999) Lang, K.R., Astrophysical Formulae (3d ed.; Berlin: Springer-Verlag), p.107
- Mashonkina et al. (1999) Mashonkina, L., Gehren, T., and Bikmaev, I, 1999, A&A, 343, 519 MGB99
- McWilliam (1998) McWilliam, A., 1998, AJ, 115, 1640
- McWilliam et al. (1995) McWilliam, A., Preston, G., Sneden, C., Searle, L., 1995, AJ, 109, 2757
- McWilliam & Rich (1994) McWilliam, A. & Rich, R.M., 1994, ApJS, 91, 749
- Short & Hauschildt (2005) Short, C.I. & Hauschildt, P.H., 2005, ApJ, 618, 926
- Short & Hauschildt (2003) Short, C.I. & Hauschildt, P.H., 2003, ApJ, 596, 501
- Sneden et al. (1996) Sneden, C., McWilliam, A., Preston, G., Cowan, J., Burris, D., Armosky, B., 1996, ApJ, 467, 819
- Van Regemorter (1962) Van Regemorter, H., 1962, ApJ, 136, 906
| Model | Species in | Atmospheric |
|---|---|---|
| NLTE SE | structure | |
| NLTE | Full set | NLTE |
| NLTE | Sr , Ba | NLTE |
| NLTE | None | NLTE |
| LTE | None | LTE |
| Species | No. -levels | No. transitions | (eV) |
|---|---|---|---|
| Sr I | 52 | 74 | 5.70 |
| Sr II | 32 | 90 | 11.03 |
| Ba I | 76 | 114 | 5.21 |
| Ba II | 51 | 121 | 10.00 |
| Å (Air) | (s-1) | (cm-1) | Lower level | Upper level | |
| Ba II | |||||
| 4554.033 | 1.11e+08 | 0.000 | 21952.404 | [Xe ] | [Xe ] |
| 5853.675 | 6.00e+06 | 4873.850 | 21952.404 | [Xe ] | [Xe ] |
| 6141.713 | 4.12e+07 | 5674.824 | 21952.404 | [Xe ] | [Xe ] |
| 6496.898 | 3.10e+07 | 4873.852 | 20261.561 | [Xe ] | [Xe ] |
| Sr II | |||||
| 4077.71 | 1.42e+08 | 0.000 | 24516.650 | [Kr ] | [Kr ] |
| 4215.52 | 1.27e+08 | 0.000 | 23715.190 | [Kr ] | [Kr ] |
| (mÅ) | |||||
|---|---|---|---|---|---|
| Line | NLTEFull | NLTESr+Ba | NLTELTE | LTE | |
| Ba II | -4 | 48.4 | 49.2 | 66.6 | 66.3 |
| Ba II | -1 | 132.2 | 124.3 | 121.8 | 120.9 |
| Ba II | -1 | 182.7 | 177.5 | 172.7 | 170.9 |
| Ba II | -4 | 16.1 | 17.5 | 17.6 | 17.4 |
| Ba II | -1 | 179.3 | 171.3 | 167.7 | 165.9 |
| Ba II | -4 | 11.8 | 12.7 | 12.8 | 12.6 |
| Sr II | -5 | 47.2 | 49.0 | 55.0 | 55.0 |
| Sr II | -5 | 32.6 | 34.1 | 39.0 | 39.0 |