Observations of the Cosmic Microwave Background and Galactic Foregrounds at 12-17 GHz with the COSMOSOMAS Experiment
Abstract
We present the analysis of the first 18 months of data obtained with the COSMOSOMAS experiment at the Teide Observatory (Tenerife). Three maps have been obtained at 12.7, 14.7 and 16.3 GHz covering 9000 square degrees each with a resolution of degree and with sensitivities 49, 59 and 115 K per beam respectively. These data in conjuction with the WMAP first year maps have revealed that the Cosmic Microwave Background (CMB) is the dominant astronomical signal at high galatic latitude () in the three COSMOSOMAS channels with an average amplitude of K (68% c.l. not including calibration errors). This value is in agreement with the predicted CMB signal in the COSMOSOMAS maps using the best fit -CDM model to the WMAP power spectrum. Cross correlation analysis of the 408 MHz map and the COSMOSOMAS data at high galactic latitudes give values in the range K from 12.7 to 16.3 GHz. Removing detected point sources in this template, reduces the amplitude of the correlated signal to 8-9 K. The mean spectral index of the correlated signal between the 408 MHz desourced and the COSMOSOMAS maps is between -3.20 and -2.94 at 40∘ which indicates that this signal is due to synchrotron emission. Cross-correlation of COSMOSOMAS data with the DIRBE map at 100 m shows the existence of a common signal with amplitude , , and K in the 12.7, 14.7 and 16.3 GHz COSMOSOMAS maps at 30∘. Using the WMAP data we find this DIRBE correlated signal rises from high to low frequencies flattening below GHz. At higher galactic latitudes the average amplitude of the correlated signal with the DIRBE maps decreases slightly. The frequency behaviour of the COSMOSOMAS/WMAP correlated signal with DIRBE is not compatible with the expected tendency for thermal dust. A study of the H emission maps do not support free-free as a major contributor to that signal. Our results provide evidence of a new galactic foreground with properties compatible with those predicted by the spinning dust models.
keywords:
cosmology: observations – cosmic microwave background – galactic anomalous emission1 Introduction
In recent years many experiments have measured Cosmic Microwave Background (CMB) anisotropies at angular scales from several degrees to a few arcmin. The analysis of the resulting power spectra has tested the Lambda Cold Dark Matter (CDM) model and allowed an accurate determination of cosmological parameters ( Spergel et al. 2003; Rebolo et al. 2004). Detailed knowledge of the galactic foregrounds (synchrotron, free-free and vibrational thermal dust emission) is required to ensure the validity of the results. The joint analysis of different templates of galatic emission with WMAP observations (Bennett et al. 2003; Hinshaw et al. 2003) has allowed a better assesment of the properties of these galactic foregrounds at the frequencies where CMB searches are conducted (see also Banday et al. 2003). Apart from the three classical diffuse components (synchrotron, free-free and vibrational dust emission), there is increasing evidence of an additional dust correlated foreground (Casasus et al. 2004; de Oliveira-Costa et al. 1997, 1998, 1999, 2004; Finkbeiner et al. 2002; Kogut et al. 1996) which does not follow the expected thermal dust spectrum at frequencies below 40 GHz. The physical nature of such a component is intriguing (Lagache 2003; Leitch et al. 1997; Lim et al. 1996; Mukherjee et al. 2001; Banday et al. 2003). Although it was initially ascribed to free-free emission, the low level of related H emission makes unlikely this explanation. Alternatively, one of the most attractive scenarios to explain the origin of that emission is electric dipole radiation from spinning small dust particles as proposed by Draine & Lazarian (1998). The key observational prediction of such a model is a turn-over in the spectrum at frequencies 10-20 GHz which are not covered by COBE or WMAP.
The Tenerife experiment (Gutiérrez et al. 2000) has provided observations at 10 and 15 GHz able to test this prediction ( de Oliveira et al 2004). The COSMOSOMAS (COSMOlogical Structures On Medium Angular Scales) experiment represents a qualitative improvement in terms of angular resolution, sensitivity and sky coverage to study any possible new foreground in the frequency range 10-17 GHz. This experiment, designed and built at the Instituto de Astrofísica de Canarias, is located at an altitude of 2400 m in the Teide Observatory, Tenerife (Spain). It consists of two similar instruments working at frequencies centred at 11 and 15 GHz named COSMO 11 and COSMO 15 respectively. This paper is dedicated exclusively to the analysis of COSMO 15 data. The COSMO 11 results will be presented in a separate paper (Hildebrandt et al. 2005 in prep.). A detailed technical description of the COSMO 15 instrument has been presented in Gallegos et al. (2001) where we also reported the first results obtained with this experiment. Here, we present additional data taken up to January 2001 improving the sensitivity by a factor two. We use the COSMOSOMAS data in conjuction with the first year WMAP data and several Galactic templates to make a robust estimation of the CMB and the different components of the galactic diffuse emission in the frequency range 12-17 GHz.
2 Experimental setup, observations and data reduction
2.1 Instrument
COSMO 15 uses a flat rotating circular mirror (2.5 m of diameter) made of aluminum canted by 5 degrees with respect to its rotation axis. The sky radiation is reflected by that mirror and redirected to a 2.4 m off axis parabolic antenna where it is focused and detected by a cryo-cooled HEMT amplifier. The rotation of the mirror produces circular scans in the sky at 1 Hz. The data are sampled times per turn of the mirror. Earth rotation allows the daily observation of a sky strip complete in right ascension and 20 degrees width in declination. The instrument has three independent channels (hereafter called C1, C2 and C3) working at frequencies centred at 12.7, 14.7 and 16.3 GHz respectively with bandwidths GHz and angular resolution degree. The instrument is shielded to protect against spillover. To correct for changes in the gain of the instrument, every 30 s a constant signal at 2 K is injected. System temperatures are K with small differences between channels. Table 1 summarizes the main parameters including beam sizes estimated as explained in Section 3.2.
| Channel | Freq. | Bandwidth | Tsys | FWHMRA | FWHMDec. |
|---|---|---|---|---|---|
| (GHz) | (GHz) | (K) | (deg) | (deg) | |
| C1 | 12.7 | 1.17 | 38.5 | ||
| C2 | 14.7 | 0.94 | 33.5 | ||
| C3 | 16.3 | 1.18 | 37.9 |
2.2 Observations and data procesing
The data analysed here correspond to the period September 1999-January 2001. The experiment was running continuously except for periods of testing, maintenance and technical failures, or when the atmospheric conditions were extreme (strong winds or rain). After careful inspection of the data, we selected days of good-quality for the analyses of this paper. Table 2 presents a summary of the observations indicating the number of useful maps selected in each one of the five different instrumental settings of COSMO15 in this period.
| Epoch | Range in Decl. | C1 | C2 | C3 |
|---|---|---|---|---|
| (dd/mm/yy) | (deg) | (Number of days) | ||
| 27/09/99-08/11/99 | 16.7-36.7 | 3 | 4 | 5 |
| 01/12/00-15/02/00 | 23.7-43.7 | 13 | 10 | 7 |
| 20/02/00-15/03/00 | 27.4-47.4 | 10 | 9 | 7 |
| 22/03/00-18/09/00 | 24.8-44.8 | 56 | 56 | 45 |
| 06/11/00-16/01/00 | 26.4-46.4 | 36 | 27 | 20 |
The basic steps in data processing include filtering out data affected by technical failures or proximity of the Sun and Moon, removal of differential atmospheric emission, absolute calibration and construction of a daily map for each of the three channels. The first steps of data processing are done in the Fourier space as explained in Gallegos et al. The dominant component in each scan is a spin-synchronous signal due to a combination of differential atmospheric emission and ground pick-up. As shown in Gallegos et al. (2001), this component appears in the data as large scale modulations, so it can be accurately removed using a combination of low order sinusoidal functions. In particular, for the map-making procedure of this paper, we have subtracted harmonics. Further additional components due to changes in the atmospheric conditions during the day are also eliminated by a long period fit to each point of the scans over the day. These two processes completely eliminate the response of the experiment to temperature fluctuations on scales degrees.
We follow a numerical approach to evaluate the response of the experiment to different angular scales. This is done simulating the reponse to a point source after passing through the scanning strategy of the experiment. Given that the data have been obtained with five different instrumental settings (see Table 2), we have defined an effective window function as a weighted mean value of the window functions associated with each setting. For the different window functions the integral under the function is used and for different pointings the weight is proportional to the number of days observed. Figure 1 presents this effective window function of the experiment where we have taken into account that the final maps are convolved to a common resolution of 1.12 degrees (see next sections).

3 Maps
3.1 Daily maps and astronomical calibration
Using the strong astronomical radio sources Cyg A (RA=299.87∘, Dec.=40.73∘, Eq. 2000) and Tau A (RA=83.64∘, Dec.=22.01∘, Eq. 2000) we accurately obtain the optical configuration which in turn is used to determine the path swept out by the circular scanning. With this the celestial coordinates of data in each position of the scans can by calculated and used to project them into a grid with degrees in RA and Dec. This grid was choosen to adequately sample the beam. A daily map with full coverage in RA and 20 degrees width in declination is obtained for each channel.
The calibration process implies the determination of the angular response
and the conversion from counts to physical units of temperature. A complete
calibration of the experiment is performed on a daily basis using the same
standard astronomical sources used in the pointing determination; Cyg A and
Tau A. Both are stable and sufficiently strong to be used as absolute
calibrators of the daily maps. Their fluxes at the COSMOSOMAS frequencies
have been computed following the model by Baars et al. (1977). This model
has been checked against the fluxes measured for these sources by
WMAP111The WMAP analysed in this paper are the first year full sky
maps (see http://lambda.gsfc.nasa.gov/product/map/dr1/
imaps_frequency.cfm).
in the K, Ka, Q and V channels,
and with the direct measurement of Cyg A at 15 GHz by Baker et al. (1977).
We estimate the uncertainty in calibration of our data is %. The
FWHM of the beam is determined from the radial profile in Dec. and RA. of
these calibration sources. Average values of the FWHMs measured in all daily
maps and their errors are listed in Table 1. The conversion factor
is then established from source flux and beam FWHM and apparent amplitude in
counts. In the calibrated daily maps we find typical sensitivities are
0.5-1.0 mK per beam.
3.2 Noise analysis
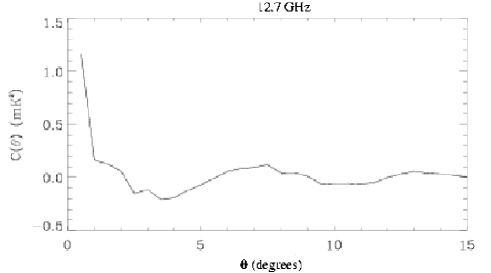
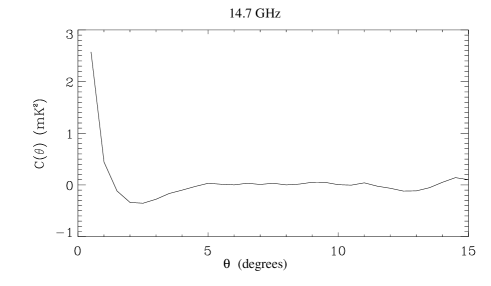
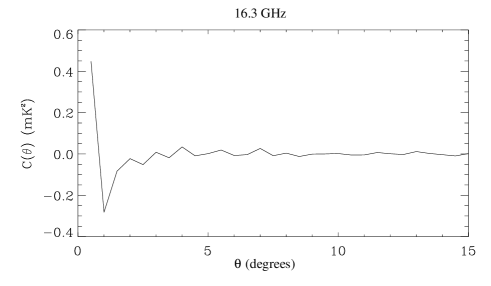
A robust estimation of the nature and amplitude of the astronomical signals present in the COSMOSOMAS maps require an accurate knowledge of the statistical properties of the noise. The noise in each daily map is characterised by the noise covariance matrix between each pair of pixels. A reasonable first approximation assumes that this only depends on angular distance. This is further simplified if the noise is white, in which case the covariance matrix is diagonal. In our case, the noise matrix can be estimated from the analysis of data at high galactic latitude in single day observations. In such daily maps the relative contribution of the astronomical signals is small compared to the dominant noise component. Figure 2 shows the correlation functions (assuming that the covariance between any pair of pixels is only a function of the distance) evaluated from one typical day of data in the three channels of COSMOSOMAS. For this analysis, we selected the region enclosed in a square RA=(115∘, 267∘) and Dec.=(25∘, 45∘), excluding also the pixels affected by the presence of radiosources according to the mask described in Section 4. The presence of non diagonal elements in the covariance matrix is revealed by non-zero values in the correlation function at angles different from zero. Whether this is due to the instrument or to the atmosphere is analysed below.
Because the observations are simultaneous in the three channels, some degree of correlated signal between them is expected due to common parts in the receiver system and contamination by atmospheric signals. We have estimated this by cross correlating the simultaneous observations in the three channels. Table 3 presents the average noise values (diagonal) and square root of the average covariances between daily maps in each channel over the whole period of observations. The listed values are derived by the following expression
where corresponds to the temperature of the band (= C1, C2, C3), in pixel and in map ( runs over all daily maps). This correlated signal between channels extends up to angular scales of 5 degrees. We attribute this daily correlation to the presence of atmospheric noise which still persists after the filtering of the low order harmonics.
| C1 | C2 | C3 | |
|---|---|---|---|
| (mK) | (mK) | (mK) | |
| C1 | 2.11 | ||
| C2 | - | 2.03 | |
| C3 | - | - | 3.30 |
We have checked for the presence of possible correlations between consecutive daily maps and conclude that the correlation is below 1 %. This is at the level expected from astronomical signals. We conclude that the atmospheric noise in the individual COSMOSOMAS maps is uncorrelated from day to day, and thus each daily map is considered as independent in the stacking of the data.
3.3 Stacked maps
For each channel, the daily maps are stacked together to get final maps with improved signal to noise ratio by a factor . These final maps are presented in Figure 3. They are complete in right ascension and cover from 16.7 to 47.4 degrees in declination. The conspicuous structures at RA degrees correspond to the main crossing of the galactic plane. The two strong sources Tau A and Cyg A are clearly visible. Other sources are also present in the maps and will be described below. The regions with higher sensitivity are concentrated in the band Dec. . At Dec. the number of observations is smaller and the noise is higher as is easily appreciated in Figure 3. The errors are calculated from the dispersion of all the measurements contributing to a given pixel of the map. The mean noise in a wide region (120 RA , 25 Dec. ) excluding the galactic plane, are in 173, 185 and 329 K per pixel for channels C1, C2 and C3 respectively; these are translated into 49, 59 and 115 K beam-1. The rms of the three maps computed in the same region are 90, 90 and 116 K beam-1. These larger values of the rms as compared with the noise indicates the presence at high galactic latitudes of clear statistical signals in each map. The evaluation and origin of these signals is considered in the following sections.

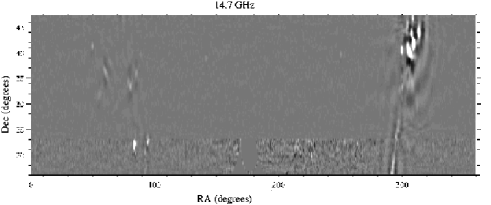
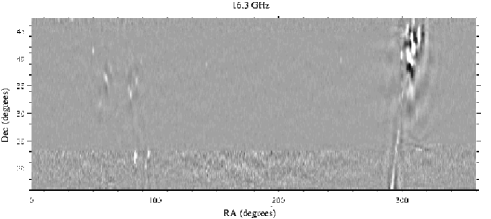
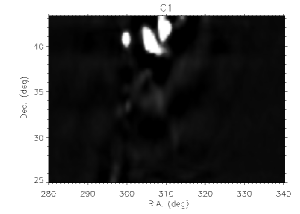

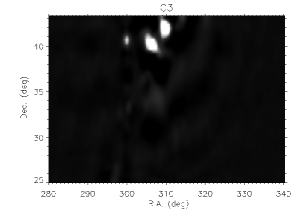
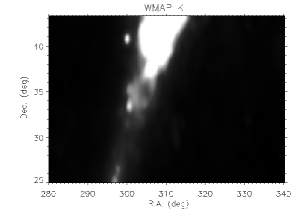

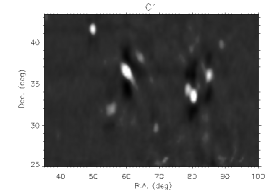

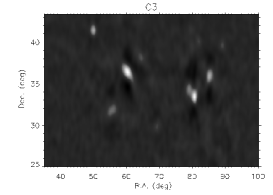
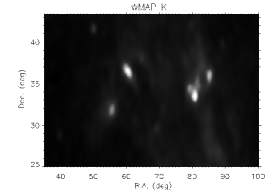
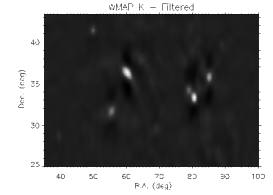
Figures 4 and 5 show a visual comparison between the COSMOSOMAS maps at the three observing frequencies, and the WMAP map at 23 GHz (all convolved to a common circular resolution of 1.12∘, which corresponds to the worse resolution of those presented in Table 1). The two regions displayed are located in the galactic plane, and the prominent structures are mainly due to diffuse emission from our galaxy. The remarkable agreement between the structures observed by COSMOSOMAS and WMAP supports the reliability of the former. Table 4 lists the observed fluxes of some of the strongest radio sources identified in the COSMOSOMAS maps. The fluxes are determined by the same method used in Watson et al (2005) where the best fitting amplitude for the expected modelled source profile to the data is found. For a comparison Table 4 presents also the fluxes measured for these sources in the two low frequency WMAP maps (Bennett et al. 2003). COSMOSOMAS and WMAP data are not coeval, and so this comparison is only indicative for variable sources (3C84, 4C39.25, 3C345, etc). As expected in the frequency range covered by COSMOSOMAS and WMAP most of the sources have a flat spectrum. The contributions of unresolved sources will be quantified in Section 4.
| COSMOSOMAS | WMAP | |||||
| ID | RA, Dec | FC1 | FC2 | FC3 | FK | FKa |
| (J2000) | (Jy) | (Jy) | (Jy) | (Jy) | (Jy) | |
| 0234+28 | (39.5∘, 28.8∘) | |||||
| 0316+41 (3C84) | (50.0∘, 41.5∘) | |||||
| 0433+29 | (69.3∘, 29.7∘) | |||||
| 0738+31 | (115.3∘, 31.2∘) | |||||
| 0923+39 (4C39.25) | (141.8∘, 39.0∘) | |||||
| 1328+30 (3C286) | (202.8∘, 30.5∘) | |||||
| 1640+33* | (250.0∘, 33.5∘) | |||||
| 1641+39 (3C345) | (250.7∘, 39.8∘) | |||||
| 1611+343* | (243.4∘, 34.2∘) | |||||
4 Cross correlation analysis
The limited frequency range spanned by the three COSMOSOMAS channels analysed here, do not allow an accurate direct separation of the various astronomical components present in the data, namely CMB and the different galactic foregrounds. To evaluate the presence of each astronomical signal we have applied cross-correlation techniques between the COSMOSOMAS maps and existing templates considered as good tracers of the different galactic foregrounds. These cross-correlation techniques allow an estimation of which fraction of the total signal contained in a given map is correlated with a reference template. The main assumption is that the spatial structure in the reference and the map under analysis is the same apart from a scaling factor in amplitude.
4.1 Templates
The maps used as templates are the 408 MHz (Haslam et al. 1982), 1420 MHz (Reich & Reich 1986), DIRBE222http://lambda.gsfc.nasa.gov/product/cobe/, and H (Finkbeiner 2003). At 408 MHz the dominant diffuse foreground is synchrotron, however the Haslam et al. map at this frequency is severely contaminated by the contribution of point sources, so as a best tracer of the synchrotron emission we have used the ’cleaned map’ (desourced) provided on the NASA LAMBDA site333http://lambda.gsfc.nasa.gov/product/foreground/haslam_408.cfm. The main properties of these templates are summarized in Table 5. The 1420 MHz has a contribution of both synchrotron and free-free emission. H emission is a tracer of the warm ionized medium which also radiates via free-free emission, although an accurate estimation of this foreground requires a correction for the extinction by dust and the electron temperature of the medium (Dickinson et al 2004). However, as we are interested in correlated signals at high galactic latitudes where the dust extinction is negligible, we have not attempted this correction. We only use the DIRBE maps at 100 and 240 m as good tracers of galactic dust. We include in the cross-correlation analysis also the first year WMAP maps, which are dominated by CMB signal, although depending on the frequency considered different degrees of galactic contamination exists.
Before the correlation analyses, the WMAP and galactic template maps have been filtered to the common COSMOSOMAS resolution (), and have been convolved with the simulated circular lock-in analysis and pixelated in the same grid used before. In the construction of these templates small differences will arise with respect to the COSMOSOMAS maps due the 3-sigma clipping algorithm implemented to reduce the effect of very strong radio sources in the observed scans. These differences will be larger as we get closer to the galactic plane so we will consider here only correlation results at high galactic latitudes . Due to the comparatively high amplitude of the galactic plane, we do not discard the possibility of some residual systematic effects in the band .
4.2 Method
The cross-correlation between two maps is derived as follows. Let be the data vector containing data points. We want to fit simultaneously “template maps”. Let be the templates (), and a vector with elements containing the cross-correlation variables in which we are interested. Then, the vector can be derived by minimizing
| (1) |
where is the covariance matrix including both the signal and the noise, and is a matrix built from the template maps, and whose elements are defined as , where and . Solving for we obtain:
| (2) |
and the corresponding covariance matrix of the parameters is
| (3) |
The variance for each parameter is given by the square-root of the corresponding element in the diagonal of the covariance matrix. Gorski et al. (1996) described this same method but in harmonic space. Note that for the case we recover the standard equations presented in, e.g. de Oliveira-Costa et al. (1999), for the case of a single template.
We have conducted several tests to study the correlated component of the noise and the CMB in the covariance matrix. Our conclusion is that both terms are small as compared with the white component of the noise and with the dominant foreground of each template, and so they can be ignored except when WMAP maps are considered as templates, in which case it is necessary to take into account the CMB component. The analysis has been performed in declination strip 25∘-44.7∘ for galactic latitude cuts 30, 40 and 50 degrees to study the dependence of the different contributors with galactic latitude.
We note that the harmonic supression procedure followed in our processing of the COSMOSOMAS data removed a large proportion of the correlations induced by the large scale structure of our galaxy (e.g. cosec law distribution).
| Map | Frequency | Component | Sky coverage |
|---|---|---|---|
| Haslam et al. (1982) | 408 MHz | 2 | Full sky |
| Reich & Reich (1986) | 1420 MHz | 2, 3 | |
| DIRBE | 100, 240 m | 4 | Full sky |
| Finkbeiner (2003) | Hα | 3 | Full sky |
| WMAP | GHz | 1, 2, 3, 4 | Full sky |
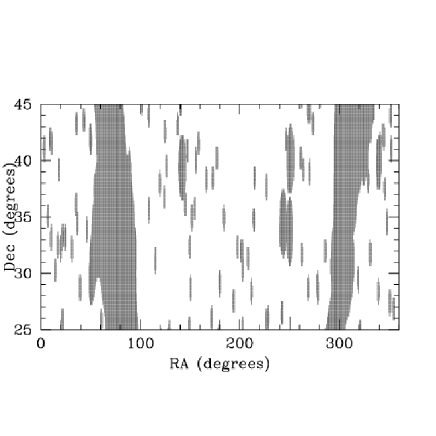
We assume a model in which each COSMOSOMAS and WMAP map contains a superposition of CMB, diffuse galactic fluctuations, and noise. Due to the high sensitivity of the WMAP maps, their structures are dominated largely by astronomical signal. The WMAP collaboration provides several masks which account for sky regions near the Galactic plane or intense radio-sources. We have used the so-called Kp0 mask (Bennett et al. 2003) which eliminates 21 % of the area of the sky, mostly situated in the galactic plane. This mask excludes also a region within 0.6∘ around the point sources contained in the catalogue by Stickel et al. (1994), and in catalogues of AGNs and X-ray sources (Bennett et al. 2003). We have also masked an additional source located at RA=250.33∘, Dec.=33.66∘ (see Table 4) which has and Jy in the C1 and in WMAP_K maps respectively. To account for the large beam of COSMOSOMAS as compared with WMAP, we have extended the Kp0 mask by 1 pixel () surrounding all of the masked sources. For the three most intense sources (3C45, 4C39.25 and DA406) the mask was extended to cover a radius of degres, in order to remove scanning artifacts larger than the noise. Figure 6 presents this mask.
| WMAP | COSMOSOMAS | |||
|---|---|---|---|---|
| Channel | C1 | C2 | C3 | |
| WMAP_K | 33.6 | |||
| WMAP_Ka | 30.1 | |||
| WMAP_Q | 30.0 | |||
| WMAP_V | 29.0 | |||
| WMAP_W | 28.6 | |||
| WMAP_K | 33.5 | |||
| WMAP_Ka | 30.0 | |||
| WMAP_Q | 30.0 | |||
| WMAP_V | 29.0 | |||
| WMAP_W | 28.7 | |||
| WMAP_K | 33.6 | |||
| WMAP_Ka | 30.3 | |||
| WMAP_Q | 30.6 | |||
| WMAP_V | 29.5 | |||
| WMAP_W | 29.0 | |||
4.3 Results
We have obtained all the correlations by fitting a single template, except for the case of cross-correlations with infrared and H maps where both maps have been fitted simultaneously since we expect a significant coupling between them. Indeed, for the case of , we find a coupling of 18 % for H-Dirbe , and 8 % for H-Dirbe .
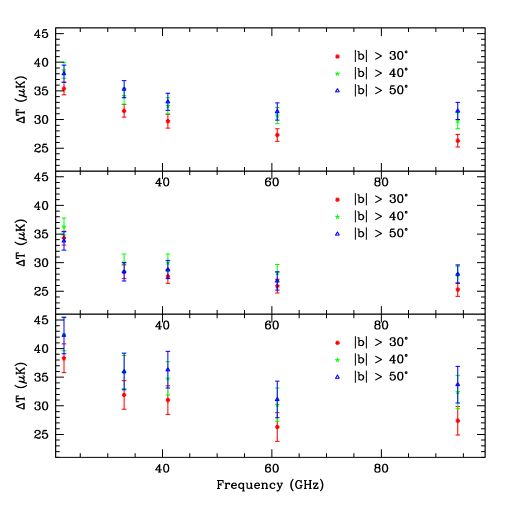
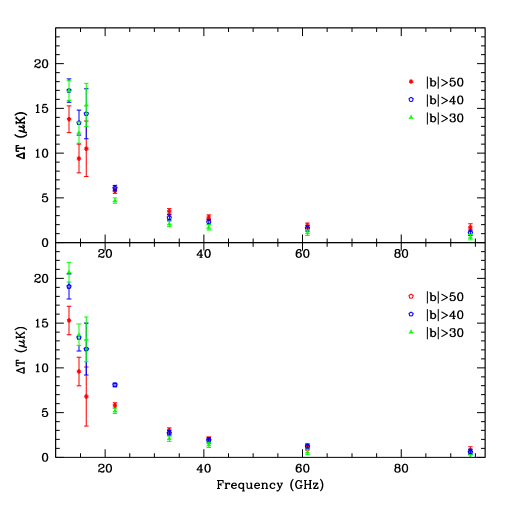
The cross-correlation results between WMAP and COSMOSOMAS are shown in Figure 7 and Table 6, while the results of the correlations with the MHz, MHz and H templates are summarized in Table 7 and Figure 8. The results of the cross-correlation analysis with the dust templates ( and ) are summarized in Table 8. There are significant correlations between the three channels of COSMOSOMAS and the two DIRBE frequencies. Figure 9 shows the signal correlated with the map at 100 m. The results quoted in the previous tables and figures include only the uncertainty due to statistical errors. As a realistic test on the significance of these errors, we performed correlations of the different templates with randomly ordered pixel values and maps rotated with respect the Galactic axis. While the random pixel ordenations basically confirm the statistical errors, the dispersion of the correlations of the rotated maps were typically 2 times larger. Thus, we will consider as significant those correlations with amplitude at least 2 times the statistical error.
| Template | C1 | C2 | C3 | WMAP_K | WMAP_Ka | WMAP_Q | WMAP_V | WMAP_W | |
|---|---|---|---|---|---|---|---|---|---|
| 408 MHz | |||||||||
| 408 MHz (Dss) | |||||||||
| 1420 MHz | |||||||||
| H | 0.07 R | ||||||||
| 408 MHz | |||||||||
| 408 MHz (Dss) | |||||||||
| 1420 MHz | |||||||||
| H | 0.06 R | ||||||||
| 408 MHz | |||||||||
| 408 MHz (Dss) | |||||||||
| 1420 MHz | |||||||||
| H | 0.05 R | ||||||||
| DIRBE | C1 | C2 | C3 | WMAP-K | WMAP-Ka | WMAP-Q | WMAP-V | WMAP-W | |
|---|---|---|---|---|---|---|---|---|---|
| 100m | 0.11 | ||||||||
| 240m | 0.27 | ||||||||
| 100 m | 0.07 | ||||||||
| 240m | 0.22 | ||||||||
| 100 m | 0.06 | ||||||||
| 240m | 0.21 | ||||||||

5 Discussion
We find a highly significant correlated signal between the COSMOSOMAS and WMAP maps in the three galactic cuts. The amplitude of the common signal ranges between and K depending of the pair of channels and the galactic cut considered. The amplitude of this signal decreases as we move from low to high frequency WMAP channels. This is a clear indication of the presence at some level of foreground signals with a negative spectral index.
The average values found in the correlation between the COSMOSOMAS maps and the WMAP channel is K, which corresponds to the weighted-mean of the values found between WMAP_V and the three frequencies of COSMOSOMAS for a galactic cut (the V band was choosen because it presents the lowest galactic contamination). This value is in good agreement with the amplitude of the signal in the filtered WMAP_V channel (29.0 K at ), and with the amplitude of the CMB signal expected in the COSMOSOMAS maps according to simulations using the best fit -CDM model to the WMAP power spectrum ( K). This result indicates the realibility of our data and the consistency of our technique to build the maps.
Diffuse galactic synchrotron is not expected to be significant over the angular scale to which COSMOSOMAS is sensitive due to the approximate power law for the galactic signal in spherical harmonics of . We can use the upper limit on galactic synchrotron at 10 GHz of K from the Tenerife results (Gutiérrez et al 2000) at high galactic latitudes to estimate the expected rms in the C2 map of , assuming a synchrotron spectral index of -3. This is in very good agreement with the common signal found with the 408 MHz ’cleaned map’ (see Tables 7 and 9). As we can see in Table 7, the typical amplitudes of the correlated signal with the uncleaned 408 MHz map are higher ( ). The excess of correlated signal with respect to the desourced map is mostly independent on galactic latitude, as it is expected for a random population of extragalactic radiosources.
Comparing the correlated signal of COSMOSOMAS with the WMAP_K and WMAP_V channels it is possible to estimate the amplitude of the foreground contamination in each COSMOSOMAS channel; for instance in the C2 channel this foreground signal is K at . Galactic synchrotron, free-free and DIRBE correlated emission can account for K. The most likely contributor to the remaining foreground signal ( K) is an extragalactic background of radiosources. In fact, although the contribution of the strong radio sources has been masked, a signal due to extragalactic unresolved radiosources is also expected. The amplitude of such contribution can be estimated from the work by Franceschini et al. (1989), Toffolatti et al. (1998) and, more recently, de Zotti et al. (2005). This requires the application of the instrument window function to the angular power spectrum of the radio sources. Due to the Poissonian distribution of sources the power spectrum is characterised by a constant . At 15 GHz for sources fainter than 0.7-0.9 Jy the value of is expected to be in the range 0.75 - 1.25 from the model of de Zotti et al. respectively (Toffolatti, private com.). Applying the COSMOSOMAS window function calculated in section 2.3, we find the range of expected rms in the COSMOSOMAS C2 map of 20 - 26 , in agreement with the excess signal found. We conclude that apart from CMB fluctuations, the signal due to unresolved radiosources is the main contributor to the common signal between COSMOSOMAS and the lowest frequency WMAP channels.
| Gal. cut | C1 | C2 | C3 |
|---|---|---|---|
We show in Table 7 that the correlation between H map and the COSMOSOMAS channels is below K. At 12.7GHz the expected free-free to H emission ratio is 40 K/R for an ionized medium with 8000 K (Dickinson et al 2004). To estimate the corresponding correlation signal for a particular region one multiples this ratio by the rms of the template map in that region. For the rms in the H map is 0.07 R, which leads to an estimated free-free contribution of K. This is comparable to the correlations measured at this galactic cut thus the amplitude of the COSMOSOMAS/WMAP correlated signals with H is compatible with a free-free spectral index.
We find clear correlated signals between the COSMOSOMAS channels and the DIRBE maps at m and m. At the weighted-average amplitudes are K and K, respectively. The amplitude of the common signal between COSMOSOMAS and DIRBE maps slightly decreases with galactic latitude. The cross-correlations of DIRBE with WMAP also shows a progressively increasing signal with decreasing frequency with some evidence for flattening below GHz (see Figure 9). In fact, for the signal correlated with DIRBE 100 m the spectral index between 33 GHz and 22 GHz is -4.3, increases to -2.7 between 22 and 16.3 GHz, and becomes nearly flat at the COSMOSOMAS frequencies. This spectral behaviour is not compatible with the properties expected for thermal dust, synchrotron or free-free galactic foregrounds. It is however compatible with predictions for anomalous microwave emission related to spinning dust (Draine & Lazarian 1998). In Watson et al 2005 we find that a signal with similar properties is located in a relatively small area () at located in the Perseus molecular cloud complex. To determine whether the DIRBE correlated signal at high galactic latitudes found in this paper is associated with similar sources or corresponds to a diffuse foreground will require better quality data and observations at lower frequencies.
6 Conclusions
The first instrument of the COSMOSOMAS experiment has provided temperature maps of the sky emission at frequencies 12.7, 14.7 and 16.3 GHz covering square degrees with sensitivities from 50 to 120K per beam. Known point-like radio sources with fluxes above Jy are detected in the three COSMOSOMAS maps. The main results obtained in the cross correlation analysis of these maps with templates of CMB and galactic foregrounds are:
-
•
The correlated signal between the COSMOSOMAS maps and the highest frequency WMAP_V map has an amplitude of 29.7 K (). This is in agreement with the expected amplitude of the CMB fluctuations observed through the COSMOSOMAS strategy, using the best fit -CDM model to the WMAP power spectrum.
-
•
The amplitude of the COSMOSOMAS-WMAP correlated signal increases as one goes to lower WMAP frequencies, indicating the presence of a foreground signal superimposed over the CMB fluctuations.
-
•
We find evidence for a contribution of unresolved radiosources to the COSMOSOMAS maps with an amplitude of K at 14.7 GHz which we interpret as the result of a randomly distributed population of unresolved radiosources.
-
•
At high galactic latitudes significant correlations for COSMOSOMAS and the 408 MHz and 1420 MHz galactic templates have been found. The values of the synchrotron spectral index are between -3.20 and -2.94 in the 408 MHz-16.3 GHz range.
-
•
The correlation analysis between the COSMOSOMAS/WMAP maps, and DIRBE channels at 100 and 240 m indicates also the presence of common signals at high galactic latitudes (). The amplitude of these signals rises with a very steep index from GHz up to GHz, flattening in the range 13-17 GHz with an amplitude of 5-7K. This behaviour is compatible with the predictions of spinning dust models. The small correlation ( K) between COSMOSOMAS and the H map rules out free-free emission as the emission mechanism responsible of the dust correlated signal detected in these regions.
ACKNOWLEDGEMENTS
We would like to thank L. Piccirillo for suggestions in the design of the experiment. We also thank to L. Toffolatti who kindly helped us with the estimations of the contribution due to unsolved radiosources and F. Atrio, F. Villa, J. Delabrouille, and G. Patanchon for valuable discussions on this experiment. We acknowledge the mechanical and electronic personnel of the IAC and Teide Observatory who have collaborated in the operation and maintenance of the experiment. Partial funding was provided by grant AYA2001-1657 of the Spanish Ministry of Science and Education. C. M. G. was supported by the Ramón y Cajal programme of the Spanish Science Ministry.
References
- (1) Baars, J. W. M., Genzel, R., Pauliny-Toth, I. I. K., Witzel, A. 1977, A&A, 161, 99
- (2) Banday, A. J., Dickinson, C., Davies, R. D., Davis, R. J., Gorski, K. M. 2003, MNRAS, 345, 897
- (3) Baker, J. R., Green, A. J., & Landecker, T. L. 1975, A&A, 44, 173
- Bennett et al. (2003) Bennett, C. L., et al. 2003, ApJS, 148, 1
- (5) Bennett, C. et al. 2003, ApJS, 148, 97
- (6) Casasus, S., Readhead, A. C. S., Pearson, T. J., Nyman, L.A., Shepherd, M. C., & Bronfman, L. 2004, ApJ, 603, 599
- (7) Davies, R. D., Watson, R. A., & Gutiérrez, C. M. 1996 MNRAS, 278, 925
- (8) de Oliveira-Costa, A., Kogut, A., Devlin, M.J., Netterfield, C. B., Page L. A., & Wollack, E. J. 1997, ApJ, 482, L17
- (9) de Oliveira-Costa, A., Tegmark, M., Page, L. A., & Boughn, S. P. 1998, ApJ, 509, L9
- (10) de Oliveira-Costa, A. et al. 1999, ApJ, 527, L9
- (11) de Oliveira-Costa, A., Tegmark, M., Davies, R. D., Gutiérrez, C. M., Lasenby, A. N., Rebolo, R., & Watson, R. A. 2004, ApJ, 606, L89
- (12) Dickinson, C., Davies, R. D., & Davis, R. J. 2004, MNRAS, 341, 369
- (13) Draine, B. T., & Lazarian, A. 1998a, ApJ, 494, L19
- (14) Draine, B. T., & Lazarian, A. 1998b, ApJ, 508, 157
- (15) Franceschini, A., Toffolatti, L., Danese, L., & De Zotti, G. 1989, ApJ, 344, 35
- (16) Finkbeiner, D. P. 2003, ApJSS, 146, 407
- (17) Finkbeiner, D. P., Schlegel, D. J., Frank, C, & Heiles, C. 2002, ApJ, 566, 989
- (18) Gallegos, J. E., Macías-Pérez, J. F., Gutiérrez, C. M., Rebolo, R., Watson, R. A., Hoyland, R. J., & Fernández-Cerezo, S. 2001, MNRAS, 327, 1178
- (19) Gorski, K. M., Banday, A. J., Bennett, C. L., Hinshaw, G., Kogut, A., Smoot, G. F., & Wright, E. L. 1996, ApJ, 464, L11
- (20) Gutiérrez, C. M., Rebolo, R., Watson, R. A., Davies, R. D., Jones, A. W., & Lasenby, A. N. 2000, ApJ, 529, 47
- (21) Haslam, C. G. T., Stoffel, H., Salter, C. J., & Wilson, W. E. 1982, A&ASS, 47, 1
- (22) Hinshaw, G. et al. 2003, ApJSS, 148, 135
- (23) Kogut, A., Banday, Bennett, C. L., Gorski, K. M., Hinshaw, G., & Reach, W. T., ApJ, 1996, 460, 1
- (24) Lagache, G. 2003, A&A, 405, 813
- (25) Leitch, E. M., Readhead, A. C. S., Pearson, T. J., & Myers, S. T. 1997, ApJ, 486, L23
- (26) Lim, M. A. et al. 1996, ApJ, 469, L69
- (27) Mukherjee, P., Jones, A. W., Kneissl, R., & Lasenby, A. N 2001, MNRAS, 320, 224
- (28) Rebolo, R. et al. 2004, MNRAS, 353, 747
- (29) Reich, P., & Reich, W. 1986, A&ASS 163, 205
- (30) Spergel, D. N. et al. 2003, ApJSS, 148, 175
- (31) Stickel, M., Meisenheimer, K., & Kühr, H. 1994, A&ASS, 105, 211
- (32) Toffolatti, L., Argueso Gomez, F., de Zotti, G., Mazzei, P., Franceschini, A., Danese, L., & Burigana, C. 1998, MNRAS, 297, 117
- (33) Watson, R. A. et al. 2005, ApJ, 624, L89