Are galaxy properties only determined by the dark matter halo mass?
Abstract
Conditional luminosity function (CLF) of dark matter halos supersedes simple models on the number of galaxies as a function of the halo mass, or the so-called halo occupation number, by assigning a luminosity distribution to those galaxies. Suggestions have now been made that both the clustering strength and properties of hosted galaxies of a given dark matter halo depends also on the age and the environment of that halo in addition to halo mass. Based on simple CLF models, we find that at least one suggestion that made use of central galaxy properties may be affected by uncertainties in the group catalog from which clustering properties were measured to address the age dependence. Establishing how galaxy properties of fixed mass halos change with the environment or the age is challenging, if not impossible, given uncertainties in group and cluster catalogs. It may be possible to address this issue through statistics based on a combined study of luminosity and color distributions, and luminosity- and color-dependent galaxy clustering, all of them as a function of the galaxy overdensity, though no single statistic is likely to provide the ultimate answer. The suggestion that the age dependence of the halo bias invalidates the analytical models of the galaxy distribution is premature given the improvements associated with modeling approaches based on conditional functions.
1. Introduction
Recently, several claims have been made that the galaxy properties of a given dark matter halo may depend on the environment in which the halo resides (Gao et al. 2005; Harker et al. 2005; Yang et al. 2005b). A connection is generally made to the age of the halo since age may be the primary factor that determines the environment in which the halo forms. Numerical simulations of the dark matter distribution suggests that older halos are more strongly clustered than younger halos of a given mass (Gao et al. 2005). Such an age dependence on the halo bias is not yet present within successful analytical descriptions of the halo distribution and clustering properties (e.g., Mo & White 1996; Sheth, Mo & Tormen 2001). These results invalidate analytical models of the galaxy distribution since these models assume that the galaxy properties are only determined by the halo mass (Kravtsov et al. 2004; Cooray & Sheth 2002 for a review).
Beyond simulations, whether galaxy properties of a given halo mass vary with the environment is yet to be established observationally. The galaxy morphology–density (Dressler 1980; Dressler et al. 1997) and the color–density (Blanton et al. 2004) relations do indicate that galaxy properties change with the environment: red, early-type, galaxies are usually found in denser environments than the environments where blue, late-type, galaxies are found. It could, however, be that the increasing fraction of early-type galaxies with increasing density is simply a reflection of a higher fraction of early-type galaxies in more massive halos (e.g., Cooray 2005a; Weinmann et al. 2005). Thus, interpretations of the density-morphology or density-color relations are generally inconclusive with some suggesting support for the halo model (Blanton et al. 2004) while others not (Goto et al. 2003; Balogh et al. 2004).
To study the difference between galaxy properties of same mass halos when either the environment or the age is varied one must find fixed mass halos while a second variable, such as the environment, is varied. The test related to the environment could be achieved with large catalogs of galaxy groups, but since one may not be able to reliably assign a mass to an individual group, it is unlikely that there is an easy way to uniquely identify whether one is comparing halos of similar mass. Since the expected differences are likely to be at the few to, at most, ten percent level (see e.g., discussion in Zheng & Weinberg 2005), the mass assignments must be accurate to the same precision. Statistics that measure properties after randomizing galaxies can partly address the question on the environmental dependence by testing whether the surrounding large-scale environment is responsible for properties within a halo. It could be that the internal structure of a halo, such as the dark matter concentration parameter, changes with the environment and galaxy properties reflect those changes.
The second approach to address this question involves statistical study of a large sample of galaxies, such as clustering, binned in terms of an estimator of age for galaxies. Using a catalog of galaxy groups and clusters from the 2-degree Field Galaxy Redshift Survey (2dFGRS; Colless et al. 2001), Yang et al. (2005b) recently considered the cross-correlation function between the central bright galaxies in galaxy groups and the general population of galaxies above a certain luminosity. For groups with halo masses above , they found the groups with a lower luminosity central galaxy to be more strongly clustered than the ones with a higher luminosity galaxy. Furthermore, galaxies that are more passive in a given mass bin were found to be more correlated. Thus, a claim was made that the cross-clustering measurement in Yang et al. (2005b) indicates age and environmental dependence of halo bias.
Using models of the conditional luminosity function (CLF; Yang et al. 2003, 2005a; Cooray & Milosavljević 2005b), we make a simple model of the cross-correlation between central galaxies of groups and the galaxy distribution and suggest that the measurement in Yang et al. (2005b) may be contaminated by uncertainties in their group catalog involving mass assignments. We find that, for example, if one selects roughly 10% to 20% fraction of satellite galaxies of larger mass halos mistakenly as the central galaxy in lower mass halos, then the bias factor for smaller halos with fainter luminosities is boosted. With a simple relation between the starformation rate and the galaxy luminosity, the clustering results binned in terms of starformation rate may also be explained without requiring a second parameter. It is unlikely that Yang et al. (2005b) measurements provide a definitive answer on the age dependence of galaxy properties of fixed halo mass with age captured by the either the star-formation rate or the luminosity of the central galaxy.
Here, we also consider if there is an appropriate statistical test on the density and age dependence of galaxy properties within a given halo that is affected less by systematics. While we have yet to come up with a simple test to provide the ultimate answer a combination of measurements on the luminosity and color distributions, combined with clustering, all as a function of galaxy density may be utilized to address this issue. Any single statistical measurement is affected by two potential variations: the mass function that varies the halo distribution with the environment and galaxy properties within a fixed halo mass that change with environment:
| (1) |
where both the mass function, , and the CLF, , varies as a function of the environment captured by , which is defined in terms of the density of galaxies in some fixed volume. To address the question whether observationally, the statistical methods must allow a separation of effects coming from with (see, e.g., Mo et al. 2004; Cooray 2005a). This degeneracy is also what affects interpretation of the density-morphology or density-color relations.
The Letter is organized as following: In the next section, we briefly summarize a model for the cross-clustering between central galaxies in galaxy groups and the general galaxy distribution. We compare our model predictions with those of Yang et al. (2005b) and suggest that their observations can be explained in terms of a small contamination in the group catalog. Furthermore, we comment on potential tests to address whether or not. Finally, as a side note, even if it turns out that the CLF has a second parameter, we will argue that this does not imply that the analytical halo model is wrong, but rather it can be easily improved by including the environmental dependence when describing galaxy properties through conditional functions.
2. Galaxy bias of Central Galaxies in Groups
In Yang et al. (2005b), the cross-correlation between luminous galaxies (presumed to be at halo centers) and a large sample of galaxies, above some luminosity, is studied as a function of the luminosity and star-formation rate of the central galaxy. In models based on the conditional luminosity function, the bias factor of galaxies above a minimum luminosity can be calculated as
| (2) | |||
where the galaxy LF is and is the halo bias. We make use of Sheth & Tormen (1999) description for the mass function and the halo bias, consistent with numerical simulations for both the halo mass (Jenkins et al. 2001) and average bias (Seljak & Warren 2004). This CLF can be divided to central and satellite galaxies following the approach advocated by Cooray & Milosavljević (2005b). The central galaxy luminosities are assigned to halo masses through the Cooray & Milosavljević (2005a) relation as appropriate for the 2dF band (Cooray 2005a; also, Vale & Ostriker 2004) including a scatter with a log-normal dispersion of 0.17 as measured from SDSS LF and clustering data (Cooray 2005b).
We write the central galaxy bias when divided to mass bins as a function of the central galaxy luminosity or star-formation rate as
| (3) | |||
where is a function such that when . While the group catalog is divided to bins in estimated halo masses, we allow for an uncertainty in both the minimum and maximum mass of each bin since it could be that halos with true masses below and above are assigned incorrect masses within the bin through statistical uncertainties. We achieve this with an analytical function that is essentially flat across the mass range with tails both above and below the mass cut-offs, and normalized to be unity. In addition to mass limits, we also allow for a slight variation in the luminosity cut-off. In Yang et al. (2005b), the galaxy sample used involve a volume limited sample with galaxies in the -band. In our CLF models, instead of a sharp cut-off at corresponding to this absolute magnitude cut, we allow for a slight scatter in this luminosity as well.
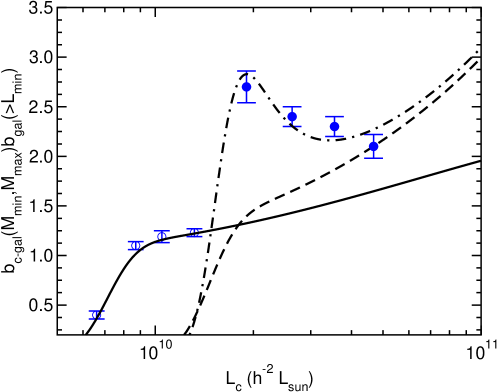
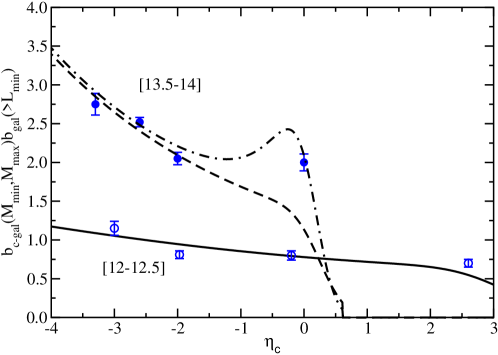
The predicted large-scale clustering is shown in Fig. 1. Here, we plot the product of as a function of , the luminosity of central galaxies, for mass bins defined by . Instead of all mass bins considered in Yang et al. (2005b), we consider two bins at the low and high mass end. The solid and long-dashed lines show the expected bias factor for two bins between 1012 to and to 1014 M☉. When compared to the measurements from Yang et al. (2005b), CLF models based on standard description for halo bias and mass function show a lower bias factor for low luminosity galaxies assigned to higher mass groups. Similarly, we also consider measurements divided based on star-formation rate (). Since our model is based on luminosities we need a mapping between and . We considered a simple one to relation of the form and found out that combinations of and describe the data best in the high- and low-mass bins respectively. The difference in the mapping between and for the two mass bins suggest that starformation rate of a central galaxy depends on the mass of the halo in which it resides.
To study the bias factor in the case of contaminations, we modify square brackets in Eq. 3 as , where is the unit step function such that either when or zero otherwise. The assumption here is that some fraction of central galaxies are satellites of larger mass halos (above the mass range corresponding to a given bin), but mistakenly taken to be central galaxies by the group finding algorithm, say, and assigned with a lower halo mass. With and , leads to the dot-dashed line shown in Figure 1(right panel), while a value of describes the dot-dashed line in Figure 1(left panel) and with to mapping described above. The difference in between the two plots may be suggestive of extra scatter in the mapping between and . Note that should not be interpreted simply as the number of central galaxies that may be contaminated in the group catalog since in our model description, a large difference exists between CLFs for central and satellite galaxies. Integrating over the LF, the difference in terms of a fraction of galaxies is at the level of 12% percent in the lowest luminosity end of the mass bin between 1013.5 M☉ to 1014 M☉ but drops to the level of a few percent and below as the luminosity is increased; this luminosity-dependent change in the contamination is not a reflection of a complex situation but rather the fact that in the mass bin 1013.5 M☉ to 1014 M☉ there are more “true” central galaxies at the high luminosity end.
It is unlikely that due to a few to ten percent uncertainties in any group catalog, based on statistical errors and systematics, one can use them directly to identify variations in clustering properties between groups of different ages or environments. It is unclear if the measurements in Yang et al. (2005b) can be interpreted as a conclusive test on the age dependence of the galaxy or halo bias. One can question why the same situation, or increase in bias, does not happen in the low mass bin, for e.g., between 1012 to M☉ as shown in Fig. 1. We find that if the contamination comes from adjacent mass bins, when , due to the fact that the halo bias is more or less constant at the low end (e.g., Mo & White 1996; Seljak & Warren 2004), there is no significant difference in bias from the contaminants. Small changes are more visible in the high mass end both due to small density of galaxies and the large changes to the halo bias factor with a small change in the halo mass. It will be interesting to see if these variations will also show up in similar tests with dark matter catalogs directly from numerical simulations whose measurements of dark matter properties will also be affected by small uncertainties.
3. Is there a more reliable test on the age dependence of galaxy properties?
Instead of addressing whether bias itself is age dependent in the observed data, perhaps, it may be easier to address if galaxy properties of a given dark matter halo are defined only by the halo mass regardless of the age or the environment of the halo. Analytically, the test is simple: Is , or is there a second parameter that determines galaxy properties of a halo in addition to the mass of that halo? This second parameter may be the environment, characterized by the overdensity , age at which the halo formed , or another parameter that may determine galaxy formation and evolution (such as heating associated with reionization). It is now well known that the satellite LF of groups and clusters are different at the faint-end; one finds a larger fraction of dwarf galaxies in clusters while the faint-end LF of groups is flat. Whether the LF is different in clusters and groups when the age or the environment of that group or cluster is varied may provide a useful test on the extent to which the assumption that the CLF depends only on mass is valid.
Similarly, it may be useful to study differences in properties of “fossil” systems relative to all other groups of the same mass. Fossil systems are expected to be older, isolated, and more biased relative to groups of the same mass. Perhaps the difference in properties between fossil and all other groups capture the extent to which depends on the age of the halo . Since the fraction of fossil systems at group mass scales are 10% (Milosavljević et al. 2005), one should only expect variations in the galaxy sample roughly around the same level.
One can easily address the issue on how large-scale environment affect galaxy properties by randomizing the galaxy distribution within halos and comparing statistics before and after the redistribution. This was considered by Yoo et al. (2005) using a simulation and a semi-analytical model and found % differences in clustering statistics involving the galaxy-galaxy and galaxy-mass cross-correlation functions. Whether these changes are a real reflection of galaxy properties and evidence for rather than or a reflection of uncertainties in simulations and semi-analytical models is yet to be seen. This and similar approaches only partly address the issue whether since when one redistributes galaxies to different halos one cannot study differences coming from the internal structure of that halo. For example, older halos may have a dark matter profile with a larger concentration parameter and galaxy properties may reflect that compared to a same mass halo but formed later. When one compares a redistributed sample to the real one, effects coming within halos will simply be averaged out. Addressing whether is challenging, but large catalogs of galaxies from surveys such as SDSS and 2dF provide the opportunity for a variety of studies. Though how these catalogs will provide the ultimate answer is yet to be seen.
One may be able to establish few percent differences with dependences in the environment through a combination of luminosity functions and clustering as a function of overdensity. These statistics depend on different combinations of and (see, Cooray 2005c for expressions), for example, and the combination of one-point (luminosity function) and two-point (clustering statistics) allows degeneracies to be broken. Still, the test is challenging. Based on a simple Fisher matrix test, using the concentration dependent bias and occupation properties of Wechsler et al. (2005) as the basis for variations with age, we find that one is required to have 1% accurate measurements in clustering statistics and luminosity functions divided to 10 bins of some parameter that is taken to be a direct estimator of age. The accuracy of establishing differences is limited because one must introduce variations in when describing clustering statistics, but not in the luminosity function.
Finally, to conclude, there is a strong possibility that one must account for small (at most ten percent) changes to galaxy properties with a second parameter in addition to the halo mass. This looks challenging when compared to the simple halo model that has a built-in assumption that the halo occupation distribution is defined only by the halo mass. If the second parameter that vary properties of the conditional functions can be established, this information can be easily included when interpreting data under an assumed cosmological model or when attempting to extract cosmology with galaxy clustering measurements. The conditional function approach, say compared to the halo occupation distribution, allows this to be easily achieved since one can easily condition in terms of the mass and the second parameter as well as accounting for any joint distribution between mass and that parameter. We think that the conclusion that recent results invalidate analytical attempts to understand the galaxy distribution and use it for cosmological parameter estimates is premature.
Acknowledgments: Authors acknowledges useful correspondences with Frank van den Bosch on results related to Yang et al. (2005b) and useful discussions with James Bullock and Risa Wechsler on Wechsler et al. (2005).
References
- Balogh et al. (2004) Balogh, M. et al. 2004, MNRAS, 348, 1355
- Blanton et al. (2004) Blanton, M. R., Eisenstein, D. J., Hogg, D. W. & Zehavi, I. 2004, astro-ph/0411037
- Colless et al. (2001) Colless, M. et al. 2001, MNRAS, 328, 1039
- Cooray & Sheth (2002) Cooray, A. & Sheth, R. 2002, Physics Reports, 372, 1 (astro-ph/0206508)
- Cooray & Milosavljević (2005a) Cooray, A., & Milosavljević, M. 2005a, ApJ, 627, L85 (astro-ph/0503596)
- Cooray & Milosavljević (2005b) Cooray, A., & Milosavljević, M. 2005b, ApJ, 627, L89 (astro-ph/0504580)
- Cooray (2005a) Cooray, A., 2005a, MNRAS, 363, 337 (astro-ph/0505421)
- Cooray (2005b) Cooray, A., 2005b, MNRAS, in press (astro-ph/0509033)
- Dressler (1980) Dressler, A. 1980, ApJ, 236, 351
- Dressler (1997) Dressler, A., Oemler, A. Jr., Couch, W. J., et al. 1997, ApJ, 490, 577
- Gao et al. (2005) Gao, L., Springel, V. & White, S. D. M. 2005, preprint (astro-ph/0506510)
- Goto et al. (2003) Goto, T. et al. 2003, MNRAS, 346, 601
- Harker et al. (2005) Harker, G., Cole, S., Helly, J., Frenk, C., & Jenskins, A. 2005, preprint (astro-ph/0510481)
- Jenskins et al. (2001) Jenkins, A. et al. 2001, MNRAS, 321, 372
- Kravtsov et al. (2004) Kravtsov, A. V. et al. 2004, ApJ, 609, 35
- Milosavljević et al. (2005) Milosavljević, M. et al. 2005, ApJL in press (astro-ph/0509647)
- Mo & White (1996) Mo, H. J., & White, S. D. M. 1996, MNRAS, 282, 347
- Mo et al. (2004) Mo, H. J. et al. 2004, MNRAS, 349, 205
- Navarro et al. (1997) Navarro, J. F., Frenk, C. S. & White, S. D. M. 1997, ApJ, 490, 493
- Seljak & Warren (2004) Seljak, U. & Warren, M. S. 2004, MNRAS, 355, 129
- Sheth & Tormen (1999) Sheth, R. K., & Tormen, G. 1999, MNRAS, 308, 119
- Sheth, Mo & Tormen (2001) Sheth, R. K., Mo, H. J., & Tormen, G. 2001, MNRAS, 323, 1
- Vale & Ostriker (2004) Vale, A. & Ostriker, J. P. 2004, MNRAS, 353, 189
- Wechsler et al. (2005) Wechsler, R. H. et al. 2005, preprint, astro-ph/0512xxx
- Weinmann et al. (2005) Weinmann, S. M., van den Bosch, F. C., Yang, X. & Mo, H. J. 2005, preprint (astro-ph/0509147)
- Yang et al. (2003) Yang, X., Mo, H. J., & van den Bosch, F. C. 2003, MNRAS, 339, 1057
- Yang et al. (2005a) Yang, X., Mo, H. J., Jing, Y. P., van den Bosch, F. C. 2005a, MNRAS, 358, 217
- Yang et al. (2005b) Yang, X., Mo, H. J., & van den Bosch, F. C. 2005b, preprint (astro-ph/0509626)
- Yoo et al. (2005) Yoo, J., et al., preprint, astro-ph/0511580
- Zheng & Weinberg (2005) Zheng, Z. & Weinberg, D. 2005, preprint, astro-ph/0512071