UV-optical colours as probes of early-type galaxy evolution
Abstract
We have studied 2100 early-type galaxies in the SDSS DR3 which have been detected by the GALEX Medium Imaging Survey (MIS), in the redshift range . Combining GALEX photometry with corollary optical data from the SDSS, we find that, at a 95 percent confidence level, at least 30 percent of galaxies in this sample have to optical colours consistent with some recent star formation within the last Gyr. In particular, galaxies with a colour less than 5.5 are very likely to have experienced such recent star formation, taking into account the possibility of a contribution to flux from the UV upturn phenomenon. We find quantitative agreement between the observations and the predictions of a semi-analytical CDM hierarchical merger model and deduce that early-type galaxies in the redshift range have 1 to 3 percent of their stellar mass in stars less than 1 Gyr old. The average age of this recently formed population is 300 to 500 Myrs. We also find that ‘monolithically’ evolving galaxies, where recent star formation can be driven solely by recycled gas from stellar mass loss, cannot exhibit the blue colours () seen in a significant fraction ( 30 percent) of our observed sample.
Subject headings:
galaxies: elliptical and lenticular, cD – galaxies: evolution – galaxies: formation – galaxies: fundamental parameters1. Introduction
One of the most important unresolved debates in contemporary astrophysics concerns the formation mechanism of early-type galaxies. In the classical ‘monolithic’ model (e.g. Larson, 1974; Chiosi and Carraro, 2002), early-type stellar populations form in a single, short, highly efficient burst of star formation at high redshift , which is followed by passive ageing to present day. Such a scenario can explain many of the observed properties of early-type galaxies, both at local and high redshift (Chiosi and Carraro, 2002), without invoking hierarchical merger-driven processes (e.g. Toomre and Toomre, 1972; Toomre, 1977; Kauffmann et al., 1993; Somerville and Primack, 1999; Benson et al., 2000; Cole et al., 2000; Hatton et al., 2003; Khochfar and Burkert, 2003). Observational evidence that might conclusively rule out either the monolithic or the merger-based scenario has remained elusive (see Peebles (2002) for a critical review of the two paradigms).
The properties of optical colour-magnitude relations (CMRs) of early-type galaxies have often been taken as evidence in favour of the monolithic scenario. The lack of redshift evolution of the slope and scatter in optical CMRs (e.g. Bower et al., 1992, 1998; Ellis et al., 1997; Stanford et al., 1998; Gladders et al., 1998; van Dokkum et al., 2000) is consistent with a high formation redshift (), as is the evolution in their zero-point. However, the predicted star formation histories (SFHs) of early-type galaxies in the merger paradigm make such a conclusion far less clear cut. For example, the predicted SFHs of (cluster) early-types in the merger scenario are quasi-monolithic, with an overwhelming majority of the stellar mass forming before a redshift of 1 (Kaviraj et al., 2005). A careful treatment in the merger framework suggests that, the observed optical CMR can also be reconciled comfortably with merger models. From a photometric point of view, optical colours are, at best, degenerate with respect to the competing theories of early-type galaxy formation and it is very difficult to discriminate between them using optical colours alone (Kaviraj et al., 2005).
Evidence does exist for morphological evolution in galaxies, suggesting that formation mechanisms of early-types are at least not uniquely monolithic. Although approximately 80 percent of galaxies in the cores of present day clusters have early-type morphologies (Dressler, 1980), a higher fraction of spiral galaxies have been reported in clusters at (e.g. Butcher and Oemler, 1984; Dressler et al., 1997; Couch et al., 1998; van Dokkum et al., 2000), along with increased rates of merger and interaction events (e.g. Couch et al., 1998; van Dokkum et al., 1999). This is supported by recent results which suggest that the mass density on the red sequence (which is dominated by early-type systems) has doubled since (Bell et al., 2004). The strengths of age-sensitive spectral indices observed in some early-type systems require luminosity-weighted ages which are consistent with the presence of at least some recent star formation (RSF) in these systems (e.g. Caldwell et al., 2003; Trager et al., 2000a, b; Proctor and Sansom, 2002). Furthermore, some nearby early-type galaxies, such as NGC 5128 (e.g. Rejkuba et al., 2001; Peng et al., 2003; Yi et al., 2004; Kaviraj et al., 2005; Rejkuba et al., 2004), NGC 205 (Hodge, 1973; Burstein et al., 1988), NGC 5102 (Pritchet, 1979; Burstein et al., 1988; Deharveng et al., 1997) and certain early-type systems recently mapped by the SDSS (Fukugita et al., 2004) exhibit unambiguous signs of significant ongoing or recent star formation. Others, such as NGC 2865 (Bica and Alloin, 1987), NGC 5128 (Schiminovich et al., 1994), NGC 3921 (Schweizer et al., 1996) provide direct residual evidence of the recent interactions that created them (see also papers by the SAURON collaboration e.g. Falcon-Barroso et al. 2005 and references therein). It is worth noting that, contrary to the traditional notion of early-type galaxies being (cold) gas-poor systems, observational evidence over the last thirty years (e.g. from ) have shown that this is not the case. Cold gas, which supplies the fuel for star formation, has been detected in significant numbers of nearby early-type systems (e.g. Knapp et al., 1989; Knapp and Rupen, 1996; Young, 2005, also see the review by Knapp (1999)). Thus it is perhaps correct to expect RSF in early-type galaxies, rather than consider them inert, passively evolving systems!
Given the apparently-evolving early-type fraction and accumulating spectro-photometric evidence for RSF in nearby early-type galaxies, it is vital to establish whether RSF may only be a sporadic feature of a few early-types or a more widespread phenomenon in the early-type population. The confirmation of low-level star formation in a significantly large sample of low-redshift early-type galaxies would put powerful constraints on models for their formation.
Spectroscopic indicators of RSF are already available, such as the commonly used index, higher order Balmer lines such as and and the D4000 break. From a photometric point of view, rest-frame ultraviolet flux is highly sensitive to RSF. Given the apparent degeneracy in optical colours, ultra-violet photometry offers the best route to finding tell-tale signatures of RSF in early-type systems at low redshift - if indeed such star formation is present in these systems!
In a recent work, Ferreras and Silk (2000a, hereafter FS2000) studied a sample of early-type galaxies in the cluster Abell 851 at . They used (rest-frame near-ultraviolet (), 2000 angstroms) and optical photometry to perform one of the first studies of the -optical CMR in a sample of early-type galaxies. They found that the slope and scatter of the -optical CMR was consistent with some early-types having 10 percent of their stellar mass in stars younger than 500 Myrs. Detailed modelling of this data (Ferreras et al., 2002) indicated that secondary bursts of star formation at low redshifts lead to a natural explanation of the large scatter in the -optical CMR.
More recently, Deharveng et al. (2002) studied the rest-frame flux around angstroms from a sample of 82 nearby early-types using data from the FOCA, SCAP and FAUST experiments. The focus of this study was primarily to investigate the far-ultraviolet () emission of early-type galaxies, thought to originate from old extreme horizontal branch (EHB) stars and their progeny (Yi et al., 1997). However, their analysis suggested that the colours in some early-type galaxies are significantly bluer than would be expected from old populations alone and cannot be explained without invoking some RSF.
Low redshift photometry in the far-ultraviolet (; 1530 angstroms) and near-ultraviolet (; 2310 angstroms) passbands from the GALEX mission (Martin et al. 2005), unprecedented both in terms of its quality and quantity, provides a unique opportunity to study the RSF-sensitive emission from a variety of nearby early-type galaxies across a range of luminosities and environments. In this paper we study 2100 early-type galaxies detected by GALEX, in the redshift range . We focus mainly on the passband, because the is sensitive not only to RSF but also to the upturn flux from EHB stars which could be expected in old early-type populations. The is less sensitive to upturn and therefore a better RSF indicator.
A preliminary study of the emission of early-types, based on GALEX detections of SDSS early-type galaxies listed in the catalog of Bernardi et al. (2003d, B2003 hereafter) was presented in Yi et al. (2005). Comparing the photometry of early-types in this sample to the spectral energy distribution (SED) of a strong nearby -upturn galaxy (NGC 4552), they did not find more than 2 galaxies (out of 162) which fit the typical UV-optical shape of a system with a significant amount of upturn flux. They concluded that the large scatter in the colours cannot be generated from a scatter in late-stage stellar evolution alone. We also direct readers to Boselli et al. (2005) who were the first to perform a detailed study of the CMR in the Virgo cluster. However, we note that our sample covers a wide variety of environments and we sample almost two magnitudes deeper (in -band) in dense environments (see Schawinski et al., 2005) compared to the Virgo sample of Boselli et al. (2005).
We begin this study by describing the construction of an early-type catalog, similar to that used in Yi et al. (2005), but in which the morphological classification of objects and removal of potentially -contaminating AGN are performed in a more robust manner. Using a simple parametrisation of the SFH, we identify galaxies which appear to have had some star formation within the last Gyr. We use a semi-analytical CDM model, calibrated to accurately reproduce the (cluster) optical CMR in the redshift range (see Kaviraj et al., 2005), to reproduce the observed CMR. Finally, we discuss the comparative roles of quiescent and merger-driven processes in driving the residual star formation found in some of our early-type sample and investigate whether an extreme monolithic scenario is capable of reproducing the colours of large (, blue () early-type galaxies in our sample.
2. Sample selection
2.1. Constructing an early-type catalog from the SDSS DR3
B2003 were the first to construct an SDSS catalogue of 9000 early-type galaxies, selected using a combination of SDSS pipeline parameters (see also Bernardi et al. (2003b,c,d) for a comprehensive study of the properties of galaxies in this catalogue). Their catalogue contains galaxies with high -band concentration indices (), spectral classifications typical of early-type galaxies, and where the deVaucouleurs fit to the surface brightness profile is more likely than the exponential fit. While such automated prescriptions are very efficient at selecting a reasonably robust early-type galaxy sample, it suffers from two shortcomings.
Firstly, it is apparent from visually inspecting a sample of Bernardi early-types that it contains late-type contaminants, such as sideways-on spirals, Sa-type galaxies and objects where a central dominant bulge is surrounded by faint spiral features. While clearly not early-type galaxies, these objects all pass the selection criteria. The emission from early-type galaxies is predicted to be weak in any galaxy formation scenario. The presence of late-type contaminants is therefore a particular problem, since such galaxies will be substantially bluer than true early-types and our conclusions regarding the presence of star formation in the early-type population could be severely affected 111We must note, however, that given the size of the B2003 sample, performing a visual inspection of all galaxies is clearly impractical!.
Secondly, spectral selection criteria, such as those used in B2003, immediately excludes any early-type galaxy which may contain star formation and therefore spectral lines, such as those reported by Fukugita et al. (2004). Since one of our main aims is to test galaxy formation models and attempt to discriminate between the monolithic and merger driven paradigms, we must take special care not to bias our sample towards one scenario at the outset! Clearly, removing early-type systems with signs of star formation will bias the sample towards the passive monolithic models and make any conclusions regarding the recent star formation activity in early-types less meaningful.
Since robust morphological classification inevitably requires visual confirmation of early-type candidates, our approach to constructing an early-type catalog relies more on visual inspection of each candidate than automatic extraction based on pipeline parameters. We make our initial selection of objects based on a single SDSS parameter - , which is the weight of the deVaucouleur’s fit in the best composite (deVaucouleur’s + exponential) fit to the galaxy’s image in a particular band. We extract all galaxies which have in and bands. The short wavelength -band traces disk or spiral arm structures, while and trace the central bulge. The robustness of this procedure has been checked by applying it to a sample of 200 randomly selected nearby early-type galaxies from the SDSS DR3. We find that 90 percent of the early-types in this sample (confirmed by visual inspection) have . This implies that, on average, this criterion would pick up 90 percent of the galaxies in a typical sample of SDSS galaxies. Reducing the value of would admit more early-types but also increase contamination, resulting in a larger sample of galaxies to be processed visually. A value of 0.95 gives the best trade-off between selecting a sample dominated by early-type objects and a sample with a significant amount of contamination. Note that we have chosen not to make a distinction between elliptical and S0 galaxies in this study since it is difficult to discriminate between them effectively using the SDSS images. It is worth noting, however, that these two populations could behave differently (e.g Boselli et al., 2005).
Having extracted our initial working sample of galaxies, we perform a visual inspection of each early-type candidate. However, our sample of galaxies spans a large range in luminosity and redshift. Our ability to accurately classify any galaxy depends on the clarity of its features on the SDSS image - this in turn depends on its redshift and apparent luminosity. Thus we must first determine the limiting redshift and luminosity at which we can trust our classifications.
The average SDSS exposure time is 50 seconds. To perform this check we use 24,000 second exposure COMBO-17 images of SDSS galaxies, at redshifts between 0.11 and 0.13 (kindly provided by Chris Wolf). The high exposure time of the COMBO-17 images allows us to resolve all features within the galaxies in question. We find that, for an apparent r-band magnitude of 16.8, our classification based on the SDSS images matches that based on the COMBO-17 images. We therefore apply a redshift cut of 0.11 and an apparent r-band magnitude cut of 16.8 to our sample, to extract a magnitude limited sample of 3500 SDSS early-type galaxies (see Schawinski et al. (2005) for more details).
2.2. Cross-matching with GALEX MIS detections
We direct readers to Martin and the GALEX Team (2005) and Morrissey and the GALEX Team (2005) for a description of the scope and performance of the GALEX satellite. The magnitude-limited SDSS early-type sample described in the previous section is now cross-matched with data from 595 GALEX fields, imaged in the medium depth (MIS) mode. GALEX has a fiducial angular resolution of 6 arcseconds. The positional matching is performed within a more conservative 4 arcseconds. We eliminate any GALEX objects that have multiple SDSS matches within 6 arcseconds because it is impossible to tell which companion dominates the flux detected by GALEX. We find that the fraction of galaxies in our magnitude limited sample (, ) detected by GALEX is around 90 to 95 percent (Figure 1). The detection rate drops sharply after .

2.3. AGN diagnostics: optical analysis
Since we are studying the (generally weak) rest-frame flux from early-type galaxies here, it is important to ascertain the level of possible contamination of the continuum due to non-thermal emission from AGN, which are common in early-type galaxies. Rich et al. (2005), who employed a similar method to B2003 to extract a sample of early-type galaxies from the SDSS and study their emission detected by GALEX, were the first to perform this additional check for AGN contamination, using emission lines measured by the SDSS. Following their study, we perform a similar analysis to gauge the contribution from AGN to the rest-frame in our galaxies, and eventually remove those which exhibit signs of hosting a strong AGN.
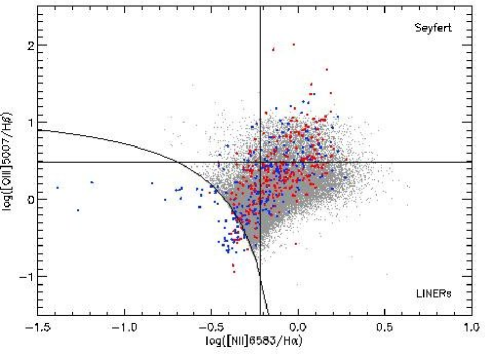
Type I (i.e. unobscured) AGN are largely removed by using the SDSS spectral classification algorithm (by setting the QSO flag) during our initial extraction of galaxies - any remaining Type Is are then removed completely through the optical and radio analyses we describe below. Type II (i.e. partly obscured) AGN can be distinguished from normal (star-forming) galaxies using the intensity ratios of pairs of strong emission lines (Baldwin et al., 1981, BPT hereafter). Using the emission line ratios [OIII/H] and [NII/H] Kauffmann et al. (2003, K2003 hereafter) have used a BPT type analysis to classify a large sample of SDSS galaxies into star-forming and Type II AGN (seyferts, LINERs and transition objects). We identify and remove potential AGN from our sample using the criteria derived by K2003.
Before calculating line ratios, we must correct for possible absorption in these line regions and extract the true emission strengths of each line index. We first construct a library of 10,000 star formation histories (SFHs) in which each SFH is modelled by an instantaneous starburst at followed by a second instantaneous starburst, which is allowed to vary in age and mass fraction. The choice of this model library is motivated by the fact that our galaxy sample contains only early-type objects and we find that such model SFHs give excellent fits to the stellar continua of galaxies in our sample. While studies such as K2003 have to deal with the full spectrum of morphological types, and thus require more elaborate model libraries, we tailor our model library to the narrow set of morphologies spanned by our sample.
The procedure for correcting for absorption proceeds in the standard way, by first comparing the spectrum of each observed galaxy (excluding major line regions) to the model library and finding the best-fit model. The absorption strengths of the OIII, H, NII and H lines in the best-fit model are then computed and subtracted from the measured line strengths in the observed spectrum. For each galaxy which exhibits all four emission lines with a signal-to-noise ratio (S/N) greater than 3, we construct the line ratios, place the galaxy on a plot of [OIII/H] vs. [NII/H] and classify it as either star-forming or a Type II AGN, based on the criteria derived by K2003.
In Figure 2 we plot [OIII/H] vs. [NII/H] used to find and remove AGN in our sample. The curved line represents the demarcation between star-forming systems and Type II AGN - galaxies are considered star-forming if they lie below this line. Red points represent galaxies identified as early-type after visual inspection. Blue points are galaxies identified as contaminants in our initial sample of galaxies. The small grey dots are K2003’s SDSS Type II AGN catalog. It is worth noting that the star-forming locus (see Figure 1 in K2003 for comparison) is almost completely empty, which is expected since our sample is composed exclusively of early-type galaxies. In addition, the majority of galaxies which do lie on the star-forming locus are contaminants. This optical analysis identifies 25 percent of our early-type sample as Type II AGN.
2.4. AGN diagnostics: radio analysis
Galaxies which either do not have the four required emission lines, or in which emission line detections have , cannot be treated using the optical analysis discussed above. In most studies these galaxies are assumed to have no contribution from AGN. However, we opt not to make this assumption and confirm the results of the optical analysis for galaxies which remain unclassified using their radio emission. There are two radio surveys which overlap with our early-type sample - the FIRST survey (Becker et al., 1995), which has an angular resolution of 5 arcseconds and a completeness limit of 1 mJy, and the NVSS survey, which has an angular resolution of 45 arsceconds and a completeness limit of 2.5 mJy.
In this study we use the FIRST survey due to its superior resolution and depth - we find that including NVSS in our analysis does not add to or alter our conclusions. The high resolution of FIRST poses a slight problem for sources where the radio emission is not very centralised. For example, galaxies with radio lobes have multiple, spatially resolved detections in FIRST. We therefore cross-match our early-type sample with FIRST detections using a large search radius of 30 arcseconds. If there are multiple detections within this search radius we add the fluxes of all the detections corresponding to the early-type object in question.
To identify a luminosity threshold above which radio activity could be attributed to AGN, we compare the radio luminosities of galaxies classified by the previous optical analysis as normal (i.e. star-forming) to the luminosities of those classified as Type II AGN. We show this comparison in Figure 3. Crosse show normal galaxies while other symbols correspond to various classes of Type II AGN. We find that Type II AGN tend to dominate this plot above a radio luminosity of , while most of the normal (i.e. star-forming) objects lie below this threshold. We use this threshold and remove any galaxy which remains unclassified in the optical analysis but shows a radio luminosity above . This removes 3 percent of the sample of galaxies which survive the optical analysis.

We must note, however, that galaxies with a high radio luminosity do not necessarily host AGN. There is a degeneracy between radio emission from AGN and from genuine star formation which is not quantified accurately by using a single threshold value. By applying this cut we might indeed exclude interesting early-types galaxies which are genuinely star-forming. However, since the radio analysis only affects a small fraction of our sample, we include it in our sample selection, as it would only make our sample slightly more conservative in terms of star-forming early-type galaxies.
2.5. The final catalog
Table 1 summarises all the criteria used in the construction of our final catalog of early-type galaxies - the final sample contains 2116 galaxies.
| Criterion | Reason |
|---|---|
| Robust morphology | |
| (from COMBO-17 comparison) | |
| Robust morphology, | |
| detection rate stable at 90 percent | |
| Emission line analysis | AGN removal for emission line |
| galaxies with | |
| L(radio) | Further removal of possible AGN |
| not classified by the emission | |
| line analysis |
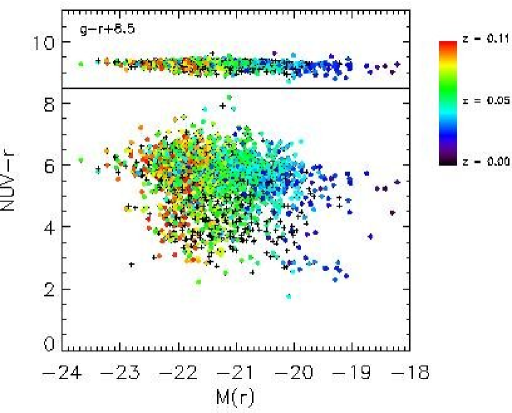
Figure 4 shows the optical (top panel) and the (bottom panel) colour-magnitude relations (CMRs) of our early-type galaxies. Galaxies are colour-coded according to their redshifts. The small grey crosses represent galaxies which are rejected based on the optical or radio analyses described in the previous sections. At first glance, the tight optical CMR typical of early-type populations is in stark contrast to the the large spread in colours evident in the CMR. While the scatter in the optical CMR is approximately 0.05 mag, the spread in the colours is almost 6 mags with a (bi-weight) scatter of approximately 1 mag. The properties of the CMR immediately lead to two conclusions.
Firstly, it seems inconsistent with a ‘monolithic’ evolution scenario for all galaxies in our sample. If all early-types were dustless simple stellar populations (as is frequently assumed from their tight optical CMRs in the context of the monolithic picture), we might expect the CMR to be just as tight as its optical counterparts. In reality, any age dispersion, coupled with the presence of varying amounts of upturn, might be expected to induce some scatter in the CMR. A lower limit to the colour in such a hypothetical monolithic CMR can be estimated by looking at the colour of the nearby strong -upturn galaxy, NGC 4552. We use a composite spectrum of NGC 4552, in which the spectral ranges are constructed from and data (see caption of Figure 1 in Yi et al. (1998) for more details on sources in the construction of this composite SED), to estimate this lower limit. This composite SED yields a colour of 5.4. We should note, however, that the component, derived from and data, samples the bright core of NGC 4552, so the value of 5.4 is likely to be bluer than the colour averaged over the entire galaxy. This makes an optimistic estimate for the blue end of a monolithic CMR. However, in a monolithic scenario all the galaxies would have , which is clearly not the case for the galaxies in our sample. We can therefore assume that the excess scatter in the CMR is due, at least in part, to some recent star formation.
Secondly, it is apparent that the red envelope is not very well-defined i.e. we do not see a sharp red edge to the CMR as is frequently seen in optical CMRs. This is likely to be caused by varying levels of dust (and therefore gas) in these galaxies which smear out the tightness in the red sequence.
Note that colours are a factor of 4 more sensitive to dust than optical colours such as , so the presence of a small amount of dust can have a proportionately larger effect in the than in the optical spectral ranges.
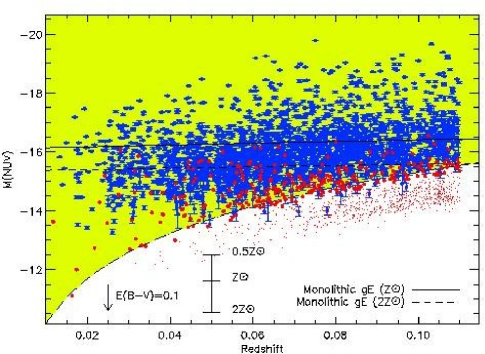
In Figure 5 we compare the BPT rejected galaxies to galaxies in our final catalog. The BPT rejected galaxies prefer bluer colours, which is not unexpected since the continuum AGN contribution makes the colour bluer. There appears to be no bias with redshift which fits our expectation that the fraction of AGN hosting galaxies will not change significantly over such a small redshift range. In Figure 6 we show the luminosities of early-types in our sample as a function of redshift. The yellow region shows the detectable space, assuming the fiducial detection limit of the MIS fields (, dashed line). The absolute magnitude of the detected early-types and their errors are shown by the blue points. Also shown is the expected absolute magnitude of a passively evolving giant early-type galaxy () which forms at , assuming solar (solid line) and twice solar (dashed line) metallicities. Since the monolithic evolution shown is for an extremely bright early-type galaxy, detections above this line immediately imply that, for at least some early-types, a monolithic SFH is not consistent with their detected flux.
As shown in Figure 1, approximately 10 percent of the SDSS early-types in the GALEX field-of-view remain undetected. To explore the properties of these undetected galaxies, we construct, for each non-detection, a synthetic absolute magnitude, based on the assumption that the galaxy is dustless, has solar metallicity and is formed at . We plot these synthetic magnitudes as red points in Figure 6. The filled red circles correspond to undetected galaxies with and the small red points are non-detections with . We find that, while some non-detections are close to the detection limit, a significant number of these galaxies should be detected, under the assumptions used to construct their synthetic magnitude. However, both a super-solar metallicity and/or a small dust content can be sufficient to push these galaxies below the detection limit - we indicate this, in Figure 6, by showing the predicted deviation of the luminosity from the synthetic magnitude assumptions for a small dust content, e.g. , and non solar metallicities.
3. Quantifying the RSF in the GALEX early-types
The aim of this section is to quantify the RSF in our early-type sample. In particular, we would like to establish how many of our galaxies have photometry consistent with any star formation within the last Gyr, at the 95 percent confidence level.
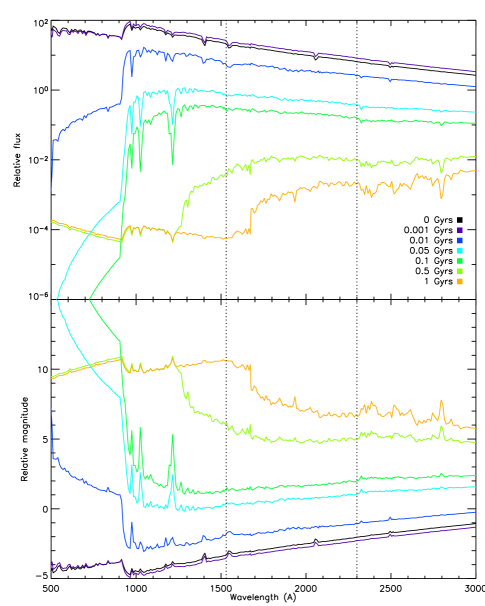
Before we begin, it is instructive to consider the scope of the in computing age determinations. Figure 7 shows the intrinsic colour of a simple stellar population (SSP) as a function of age and metallicity (solar: dotted line, half-solar: solid line and twice-solar: dashed line). The evolution in the colour slows considerably after 1-2 Gyrs, as the flux from a recent starburst decays significantly in this timescale - the is therefore an effective age indicator for only 1 Gyr after the starburst in question. In other words, we can expect the (+ optical) photometry of our galaxies to be able to distinguish only between galaxies which have had a very recent starburst, within the last 1 Gyr and galaxies that havent. The , however, is blind to any star formation which is much older than 1 Gyr old.
We fit the observed colours of the GALEX early-types across the and optical spectral ranges to colours predicted by a library of model SFHs, in which an initial starburst at high redshift () is followed by a second starburst which is allowed to vary in mass fraction and age between and present day. Both starbursts are assumed to be instantaneous. Each model in the library has two main parameters: , the age of the second starburst, in the range to Gyrs and , the mass fraction of stars formed in the second starburst, in the range to (‘YC’ stands for Young Component). We explore models with metallicities in the range to and intrinsic values in the range to . We use the standard dust prescription given in Calzetti et al. (2000) to compute the reddening for a given value of . The stellar models used to compute the model library in this study (Yi et al., 1997; Yi, 2003) adopt the universal Salpeter IMF. For galaxies without detection, we use a four colour (, , and ) comparison, while for those with detection we use five colours (, , , and ). We perform a test with the appropriate degrees of freedom by minimising the sum of the normalised residuals
| (1) |
where and are the model and observed colours respectively and is the uncertainty in the residual . The average errors in the SDSS optical magnitudes are approximately 0.01 mag. The average uncertainty in the GALEX and magnitudes are mag and mag respectively. The uncertainties in stellar models are taken to be approximately 0.05 mag for optical passbands and 0.1 mag for the UV passbands (see Yi, 2003). Since, our observed sample contains galaxies at various redshifts, models are redshifted to for each comparison, thus avoiding uncertainties due to K-corrections. The derived model fits are therefore in the rest-frame of each observed early-type galaxy.
We use this procedure to derive best-fit values of and likelihoods in space for each galaxy. Our entire sample can be broadly divided into three categories - we illustrate this by showing the contour maps of four example galaxies in Figure 8. The minimum is marked with x and we indicate the 68 percent and 95 percent confidence contours. Galaxies 1 and 2 (top row) have clear signatures of RSF, since their 95 percent contours are contained completely within 1 Gyr. Galaxy 3 shows a large age-mass degeneracy which appears in most cases because the flux from a small young starburst can be indistinguishable from that due to a larger but older starburst. Degenerate contours can also be the result of large errors in the observed photometry which allow many models to fit the data with values of (reduced) . Therefore, even though Galaxy 3 has a best-fit around 1 Gyr, we cannot rule out the possibility of younger or older populations being present, purely from its UV and optical photometry. Finally, Galaxy 4 is likely to have old or intermediate age populations, since its 95 percent confidence contour lies exclusively at ages above 2 Gyrs.
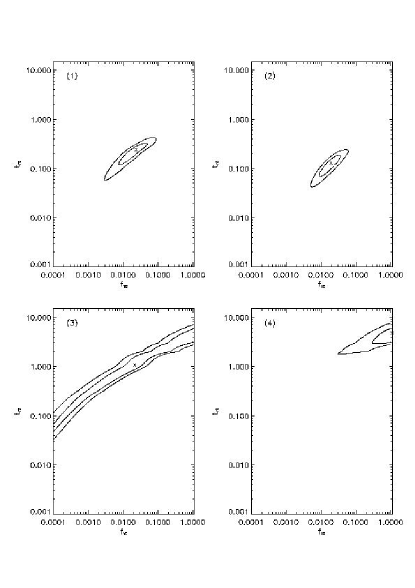
We note that, although they used a similar model for their analysis, the age-mass degeneracies in fits to our sample of galaxies are smaller than those studied by FS2000. This is partly due to the fact that optical uncertainties in SDSS measurements are ten times smaller than those used by FS2000. Together with the additional constraint (FS2000 only used rest-frame ), this allows a much smaller part of the space to fit the colours of the observed early-types.
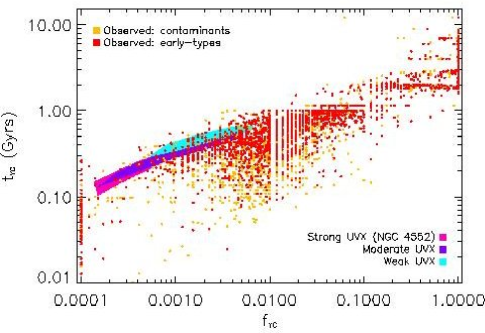
In Figure 9 we summarise the best-fit values of for our entire sample of galaxies. Red points indicate the best-fit values for early-type galaxies in our sample while orange points indicate best-fit positions of contaminants (galaxies which are rejected by the visual inspection or rejected by the AGN diagnostics). We find an increased scatter of contaminants towards lower values of (i.e. younger ages). We also show the 95 percent confidence contours of a galaxy with strong, moderate and weak UV upturn (UVX) flux. We generate the strong UVX contour using the observed SED of NGC 4552. The moderate and weak UVX contours are computed by reducing the UV flux ( angstroms) in the NGC 4552 SED by a factor of 2 and 6 respectively. In Figure 10 we show the distribution of best-fit values in our sample of galaxies - the inset shows the distribution of values restricted to the range Gyrs. Figures 9 and 10 suggest that the UV + optical photometric properties of the majority of early-type galaxies in our sample are not compatible with a single rapid burst at high redshift followed by passive evolution. Such a conclusion is difficult to achieve with optical CMRs studied in the past (e.g. Bower et al., 1992, 1998; Ellis et al., 1997; Stanford et al., 1998; Gladders et al., 1998; van Dokkum et al., 2000), which are all consistent with purely passive monolithic scenarios.

.
We now classify our galaxies using their contours, as follows: if the 95 percent confidence contour lies exclusively below a of 1 Gyr then we label the galaxy as young (e.g. galaxies 1 and 2 in Figure 8). If the 95 percent contour spans ages above and below 1 Gyrs, the galaxy is classified as degenerate (e.g. galaxy 3 in Figure 8). Finally, if the 95 percent contour lies exclusively above an age of 1 Gyr then the galaxy is classified as old (e.g. galaxy 4 in Figure 8). As indicated in Figure 9, some galaxies have best-fit values which fall within the UVX contours defined by the observed SED of NGC 4552. These galaxies clearly have SEDs which resemble that of typical UV upturn galaxies but they may be initially labelled as young. However, since it is impossible to determine whether the shape of their SED is a result of RSF or UVX or a combination of both, we re-label these galaxies as degenerate.
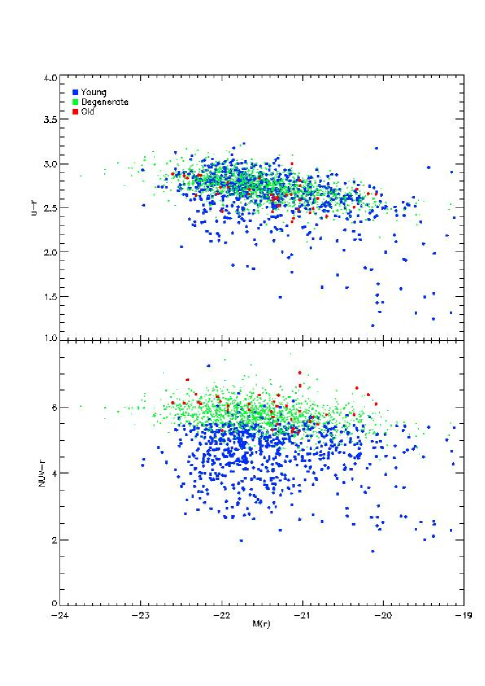
In Figure 11, we plot the and CMRs for the GALEX early-types and colour-code each galaxy using this classification scheme. We find that the optical CMR is unable to distinguish between different levels of RSF, since the various classifications cannot be distinguished in the optical CM space. However, the CMR shows a clear layered structure. The galaxies classified as young (blue symbols) are bluest in the colours and clearly separated from the old locus (red symbols) and degenerate class of galaxies (green symbols) forming an intermediate layer. Blue galaxies reside almost exclusively below (for comparison, the colour of NGC 4552 is 5.4). Degenerate and old galaxies lie almost exclusively above .
We note that this method indicates the presence of RSF in a very general sense. Two instantaneous starbursts are clearly an oversimplification of the true SFH of early-type galaxies. The position of a galaxy in space is a function of the shape of its SED and our efforts in this section have centred on approximating the shape of the true SED of each galaxy (using a library of and ) through colour fitting. Although the quantities and do not have a direct physical meaning, the two-starburst method probes whether there has been any star formation in these systems within the last Gyr. Since our classifications take account of the 95 percent confidence contours, i.e. the part of parameter which enclose 95 percent of the probability, we are able to derive conclusions about the presence of such RSF at the 95 percent confidence level. Having identified the signature of RSF in an object, we must then appeal to the various formation paradigms (see Sections 5 and 6 below) to motivate the star formation that generates the observed RSF.
4. The blue fraction
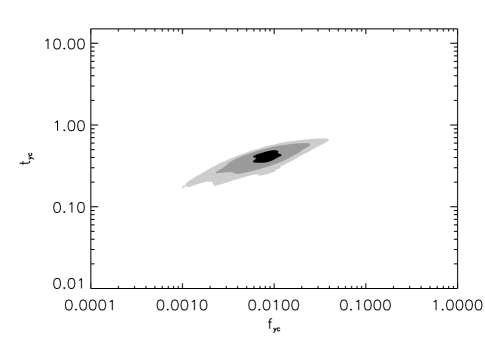
Galaxies classified as young and shown in blue in Figure 11 are systems with a clear signature of RSF. In Figure 12 we show a stacked likelihood map of all blue galaxies, constructed by adding the likelihood maps of individual blue galaxies (c.f. top row of Figure 8) together. The black region indicates the part of parameter space where the average likelihood is higher than 95 percent. The dark and light grey regions correspond to regions where the probability is between 70 and 95 percent and 30 and 70 percent respectively. Thus, the black region represents the values of and which are, on average, most likely for the blue population. The most likely value of is 1 percent and is 0.5 Gyrs.
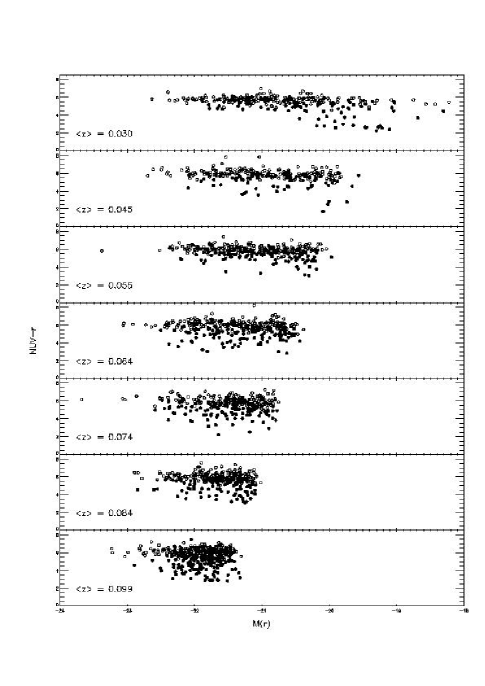
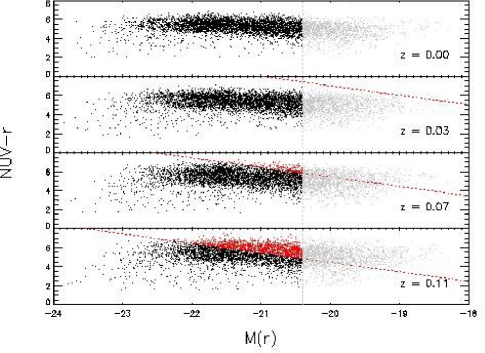
In Figure 13, we split the NUV CMR into narrow redshift bins and indicate the blue population in each bin. It is apparent from Figure 13 that, as a result of constructing a (apparent) magnitude limited sample, we are not sampling identical parts of the luminosity function at different redshifts. Comparison of the blue fraction across our redshift range is therefore meaningful only for the part of the luminosity function which is sampled completely at all redshifts - looking at the highest redshift bin this appears to be for galaxies with .
In Figure 14, we plot the evolution of the blue fraction with redshift. Recall that percent of early-type galaxies in the SDSS sample remain undetected by GALEX (Figure 6). The true value of the blue fraction should take these galaxies into account. We therefore assume that none of the non-detections are blue and adjust the blue fraction accordingly. This is a fairly strong assumption because the undetectability of these galaxies is a function of both their dust content and metallicity. It is possible that some of these galaxies do have star formation but are heavily dust-reddened and/or metal-rich. Nevertheless, without their UV photometry this is a question we cannot answer.
The solid curve in Figure 14 takes into account all galaxies in each redshift bin, while the dotted curve considers only galaxies with . Note also that at very low redshifts (), SDSS has a bright detection limit - spectroscopy is not possible for bright galaxies () which are extremely close (). Hence we do not properly sample the luminosity function in the first two redshift bins, although the blue fraction should remain unchanged due to this undersampling. The red curve in Figure 14 indicates that the fraction of blue systems for bright galaxies () varies between 27 and 34 percent with an average value of 30 percent. Within the errors there is negligible evolution in the blue fraction within the redshift range . Nevertheless, both these points make our blue fraction a conservative estimate.
It is worth noting that the blue fraction computed in this study is a lower limit on the fraction of early-type galaxies which contain RSF. It is possible that some of the galaxies classified as degenerate also contain a certain level of RSF, but this is impossible to verify given their photometry and/or observational uncertainties. In addition, we have assumed that undetected ellipticals are not blue although it is clearly possible that they have some star formation but are heavily dust-reddened or very metal-rich. This is, however, unquantifiable and any correction to the blue fraction could be expected to be negligible within errors.

5. Comparison to the merger paradigm
Since we have established that RSF does exist in a significant fraction of the early-type population, it is natural to ask whether the properties of our local early-type sample can be reproduced in the currently popular hierarchical merger paradigm. We therefore explore the predicted CMR in the semi-analytical framework using the GALICS model, which combines large scale N-body simulations with analytical recipes for the dynamical evolution of baryons within dark matter haloes. We direct readers to Hatton et al. (2003, H2003 hereafter) for specifics regarding the fiducial model. Kaviraj et al. (2005) have used this model to accurately reproduce the the observed optical CMR in cluster early-type galaxies in the redshift range (see their Section 2). We use the blind UV predictions from this optically-calibrated model to study the colours of the GALEX early-type sample. Note that galaxy morphologies in the model are defined by the ratio of -band luminosities of the disc and bulge components, which correlates well with Hubble type (Simien and de Vaucouleurs, 1986). A morphology index is defined as
| (2) |
so that pure discs have and pure bulges have . Following Baugh et al. (1996), early-type galaxies have 222In this scheme ellipticals have , S0s have and spirals have ..
We approach the problem from the point of view of reproducing the colour distribution using an ensemble of model galaxies in the redshift range spanned by the observed sample. In traditional (optical) CMR studies, the colour distribution is often parametrised by the slope and scatter of the correlation. This is useful because the optical correlations are typically tight i.e. have small scatter. But since the CMR has more structure than can be expressed through the slope and scatter alone, matching only the slope and scatter within errors (which are large due to the significant dispersion in colours) is no longer sufficient.
5.1. Treatment of very young stars
Since we are modelling the spectrum in this study, we must address some additional issues regarding the flux from (very) young stars in the model. The evolution of flux with the age of the -emitting young stars is highly non-linear. Figure 15 shows the evolution of the spectrum with age, on both flux and magnitude scales for a solar metallicity stellar model from the public Bruzual and Charlot (2003) distribution. It is apparent that the flux of a 1 Myr population is 4-5 orders of magnitude greater than that of a 1 Gyr population. Like other models of galaxy formation, star formation in GALICS is essentially proportional to the cold gas available in the galaxy - stars are therefore produced continuously. In addition, the GALICS model provides high age resolution (1 Myr) for very young stars. Therefore in a significant number of galaxies, a residual fraction of very young stars ( Myrs old) is present.
There are two main issues regarding such young stars. Very young stars are typically embedded in birth clouds (BCs). During this embedded phase the attenuation due to dust in the ambient ISM is compounded by the dust present in the outer HI envelopes of the BCs. Thus for embedded stars, the combined optical depth due to the birth cloud (BC) and the inter-stellar medium (ISM) can be several times larger than due to the ISM alone (e.g. Charlot and Fall, 2000). While most studies suggest that birth clouds are transient features with lifetimes of a few tens of Myrs (e.g. Blitz and Shu, 1980; Hartmann et al., 2001), a recent work (Scoville and Wilson, 2004) suggests that the low efficiency of star formation in these clouds implies significantly longer lifetimes ( Myrs). Recently formed stars may still migrate early from such long-lived BCs, since the BCs feel hydro-dynamic forces while the stars do not. However, the low gas density in early-type galaxies imply lower hydro-dynamical forces, which could mean that migration timescales are longer (Nick Scoville, private communication).
In this study we apply a differential extinction scheme, in which the extinction applied to flux from embedded stars is a factor greater than the extinction felt by stars which are not embedded - calculated from the mean H column density (see H2003, Section 6.2). The key ingredients in this scheme are the factor and the age limit of stars which are considered to be embedded. Following the studies mentioned above, we experiment with various values of in the range 10-100 Myrs and a range of values of between 3 and 10. We note that Charlot and Fall (2000) suggest , albeit with a large scatter at lower and higher values - however this is mainly for starbursting galaxies which have significantly different star formation histories than the early-type galaxies in our sample (see also Kong et al., 2004).
A second issue regards the modelling of star formation itself. Star formation is modelled as a continuous process proportional to the mass of cold gas in the system - as long as there is gas to fuel star formation, there are always some newborn i.e. zero-age stars predicted in the model at any epoch. However, the question is whether, when galaxies are observed, true zero-age stars or indeed very young stars are actually seen. In reality, star formation is unlikely to be an idealised continuous process but probably occurs in random bursts of varying strengths and durations. Galaxies are therefore observed sometime in between two starbursts i.e. there is a small time delay between a galaxy’s most recent starburst and the point at which it is observed. For example, NGC 205, an ‘actively’ star-forming dwarf elliptical (e.g. Burstein et al., 1988; Wilcots et al., 1990; Dorman et al., 1995; Bertola et al., 1995) in which the two most recent starbursts occurred 20 Myrs and 500 Myrs ago (Wilcots et al., 1990), is noticeably bluer in UV-optical colours than other elliptical galaxies (Burstein et al., 1988). This suggests that it may not be correct to model all early-type galaxies with very young stars ( Myrs old).
If we assume that starbursts in real galaxies are randomly, i.e. Poisson distributed, in time, then the distribution of time delays between starbursts is exponential333This is a general property of Poisson distributions. The shape of the exponential is determined by the number of starbursts per Gyr (). In addition, the time lag distribution must be truncated at some value , since the time lag should generally be small and could have a minimum value (e.g. Myrs and Myrs, from the NGC 205 arguments above). In this study we explore the (,,) parameter space for values of in the range 0-0.05 Gyrs and in the range 0.2-0.5 Gyrs. We assume that i.e. that a starburst has, on average, a timescale of 0.1 Gyrs, so that galaxies tend to have 10 bursts per Gyr.
5.2. Reproducing the NUV CMR in the merger paradigm
A one-to-one comparison between the model and observed photometry requires that the two samples are consistent in terms of the magnitude and redshift ranges covered by each. We therefore take the following points into account while performing our comparisons:
-
•
From Figure 14 we see that, due to the magnitude limit of our observed sample, luminosity function coverage is complete only for galaxies brighter than . We therefore restrict our comparison only to model galaxies with .
-
•
As mentioned before, the SDSS spectroscopic sample has a bright limit - bright galaxies which are very close do not have spectroscopy and therefore do not appear in our observed sample. A large sample of galaxies drawn from the SDSS DR3 indicates that this bright limit lies around for . We therefore remove such galaxies from the model sample.
-
•
The GALEX detection limit () implies that some galaxies predicted in the model will not be ‘GALEX-detectable’. The comparison must therefore include only model galaxies which are GALEX-detectable.
-
•
A fourth point which does not particularly affect our comparison but is worth noting is that the model itself has a completeness limit (H2003, Section 8.2 and Table 3), because small haloes are not fully resolved in the simulation due to the mass resolution of GALICS444In GALICS the merging history is driven by the N-body backbone on which galaxies are ‘painted’. The mass resolution is therefore determined by the mass of the dark matter particles (). Other models, (e.g. Benson et al., 2000; Khochfar and Burkert, 2003), use the Press-Schechter formalism (Press and Schechter, 1974), with theoretically infinite resolution, so that the merging history of even the smallest objects is fully resolved. The completeness limit for GALICS in r-band is around -20.4. While the effects of such a lack of resolution may propagate over the formal completeness limit of -20.4, this does not affect our comparison if we restrict ourselves to , since this is well within the completeness threshold.
-
•
Finally, all model SEDs are redshifted to present day before the comparison, to avoid uncertainties due to K-corrections. This is important, because without robust low redshift templates for the spectra of early-type galaxies, we cannot reliably estimate K-corrections - we have already established that a purely passively evolving template does not match at least 30 percent of the early-type galaxies at low redshifts. Later in this section we present UV K-corrections based on the photometry of our best-fit models.
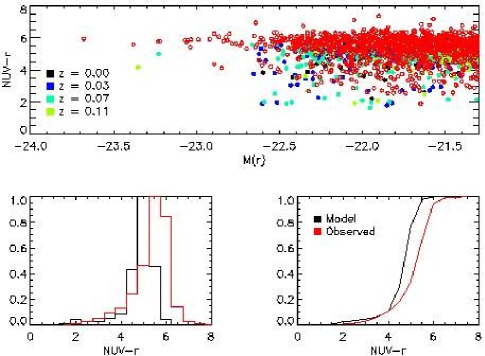
We generally find that reproducing the observed photometry without invoking timelags is difficult. The assumption of moderate BC survival spans (10-50 Myrs) leaves the model photometry with roughly correct scatter but with a zero-point which is consistently too blue, regardless of how heavily attenuated the flux from young stars is. To illustrate this point we show, in Figure 16, the case where and Myrs, i.e. the BC + ISM extinction is ten times that of the ISM alone and BCs survive for 50 Myrs. Note that, for clarity, in this and other similar figures that follow, we draw a random sample of model galaxies which has the same size as the observed sample. While the top panel of Figure 16 indicates that the scatter is reasonably reproduced the colour distributions in the bottom panels clearly show that the zero-point of model photometry is clearly too blue by 0.5 mag in such a scenario.

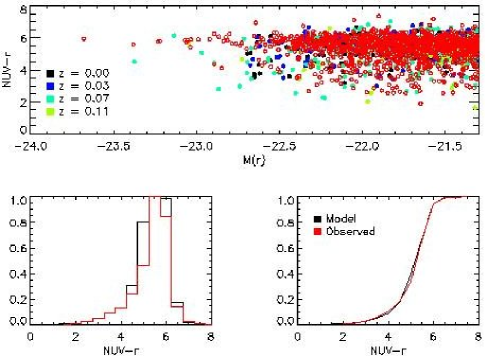
The situation can be significantly improved by invoking longer BC lifetimes close to 100 Myrs - Figure 18 shows the comparison between the model and observed results when an exponential BC lifetime distribution, highly skewed towards an upper limit of 100 Myrs is used, along with a BC extinction of 5 times that due to the ISM alone. We find that this comparison gives a reasonable fit to the photometry, although as mentioned before, it is unclear whether recently formed stars within BCs linger within them for the lifetime of the cloud itself.
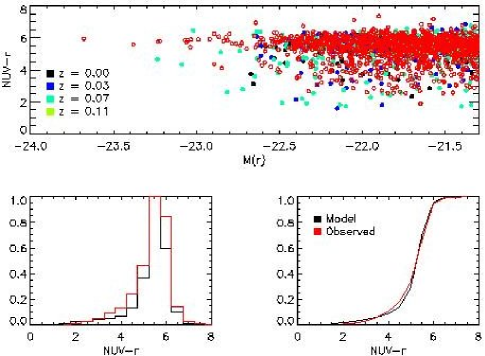
Invoking small timelags into the model photometry, while keeping BC lifetimes short, produces similar results. The observed photometry can be reproduced best if we assume a minimum timelag of 20 Myrs (c.f. NGC 205 arguments given above), a maximum timelag of 200-300 Myrs and an exponential timelag distribution constructed on the assumption that galaxies have, on average, 10 starbursts per Gyr. We also assume that stars less than 30 Myrs old reside in BCs and experience three times the extinction due to the ISM alone (c.f. Charlot and Fall (2000). Using the terminology of the previous section this translates to: , Myrs, , Myrs and Myrs. Note that the BC + ISM extinction only affects stars which are between 20 and 30 Myrs old since, by construction, there are no stars younger than 20 Myrs in this model (since Myrs). This comparison is shown in Figure 19. Henceforth, we refer to this scenario as the ‘best-fit model’. As might be expected, the goodness of fit is more sensitive to the minimum timelag - scenarios where Myrs make both the zero-point too blue and the scatter too large to fit the observations. The fit is less sensitive to the maximum timelag but we use Myrs, the lowest value of which gives a good fit.
As the bottom panels of Figure 19 indicate, the best-fit scenario reproduces the colour distribution of the observed sample well. The evolution of the (complete) CMR in this scenario is shown in Figure 20. Note that the number of galaxies in each redshift bin is around 6000. The red dots indicate galaxies which are below the detection limit of GALEX i.e. they are not GALEX-detectable. The grey dots lie in the region below the completeness limit of the GALICS model. The detection limit encroaches severely on the model sample at the upper end of our redshift range ().
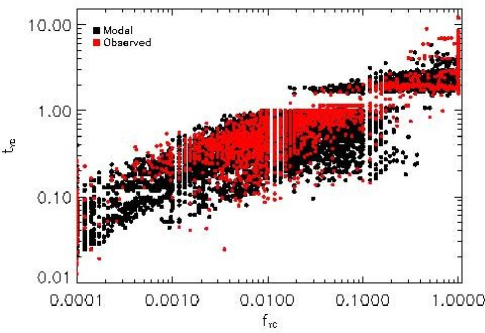
While it is apparent that the best-fit model reproduces the photometry of the observed sample, we now apply the two-component analysis used in Section 3 to the predicted photometry from the best-fit model. The position of an object in space is a direct function of the shape of its SED, which in turn drives its photometric properties both in the and the optical spectral ranges. A comparison, in this parameter space, between the positions of the model galaxies and the observed population indicates the overall robustness of the fit, not only in terms of the colour but in terms of the shape of the complete SED. The derivation of for model galaxies uses the same process as that used for the observed sample. We show this comparison in Figure 21. Note that we show all available galaxies in the observed sample and similarly all model galaxies above the GALICS completeness limit - we do not restrict the analysis to galaxies with . We find that there are no systematic differences between the positions of model and observed galaxies in this parameter space, which implies that the observed photometry across the and optical spectral ranges is reproduced reasonably well by the best-fit model. Table 2 summarises the properties of the recent star formation in the galaxies in the best-fit model. On average, low-redshift early-type galaxies are predicted to have 1.5-2.5 percent of their stellar mass formed within the last Gyr. The mass-weighted age of this star formation is between 0.4 and 0.6 Gyrs and its luminosity-weighted average age is around 0.5 Gyrs.
| z | ||||
|---|---|---|---|---|
| 0.03 | 0.014 | 0.61 | 0.55 | 0.55 |
| 0.07 | 0.021 | 0.62 | 0.55 | 0.57 |
| 0.11 | 0.025 | 0.50 | 0.37 | 0.38 |
Note. — is the average ‘RSF’ mass fraction i.e. the stellar mass fraction within the last Gyr. is the average age of this RSF fraction, in Gyrs, weighted by the quantity indicated in the subscript . Subscript indicates mass, indicates -band luminosity and indicates r-band luminosity.
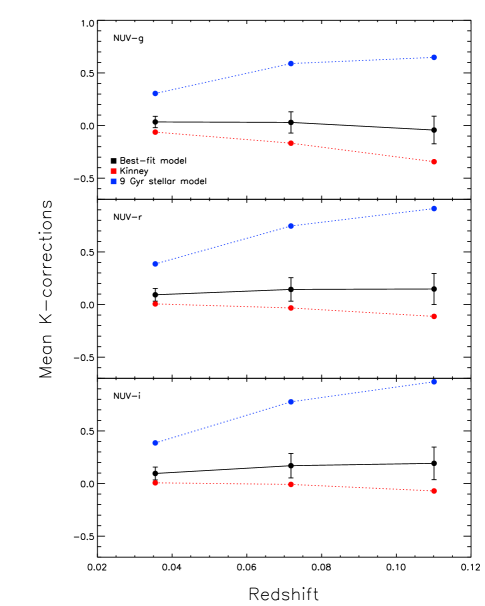
We end this section by computing K-corrections (Hogg et al., 2002) from our best-fit models. As suggested by our previous analysis, purely old, passively evolving populations are clearly not adequately good templates for the spectra of early-type galaxies, even though the emission in these galaxies is weak. In Figure 22, we show K-corrections for colours from our best-fit model in the redshift range spanned by our observed sample (black dots with error bars). We also compare these K-corrections to those obtained from a passively evolving 9 Gyrs old SSP (blue) and the elliptical template from the Kinney spectral atlas of galaxies (red, Kinney et al., 1996). The use of a 9 Gyr SSP is motivated by the fact that Bernardi et al. (2003d) find that their early-type sample can be best-fit by a 9 Gyr passively evolving SSP, formed at high redshift.
5.3. The role of mergers and progenitor bias
Star formation in the merger paradigm proceeds through one of two channels - quiescent star formation governed by the mass of available cold gas and the dynamical timescale of the galaxy (H2003, Section 4.1) or merger driven star formation as a result of dynamical interactions between galaxies (H2003, Section 5). As Figure 23 indicates, it is possible for galaxies to have experienced very recent mergers, within the last Gyr of look-back time. The top panel in Figure 23 shows the redshifts of the most recent mergers experienced by early-type galaxies at . These are essentially the dynamical ages of these galaxies i.e. the epoch at which the galaxy in its present (morphological) form was created. The bottom panel shows the average trend in dynamical ages as a function of luminosity (size). In a hierarchical picture of galaxy formation larger early-types are assembled later, i.e. have smaller dynamical ages, although the ages of their stellar populations are, on average, older (Kaviraj et al., 2005).
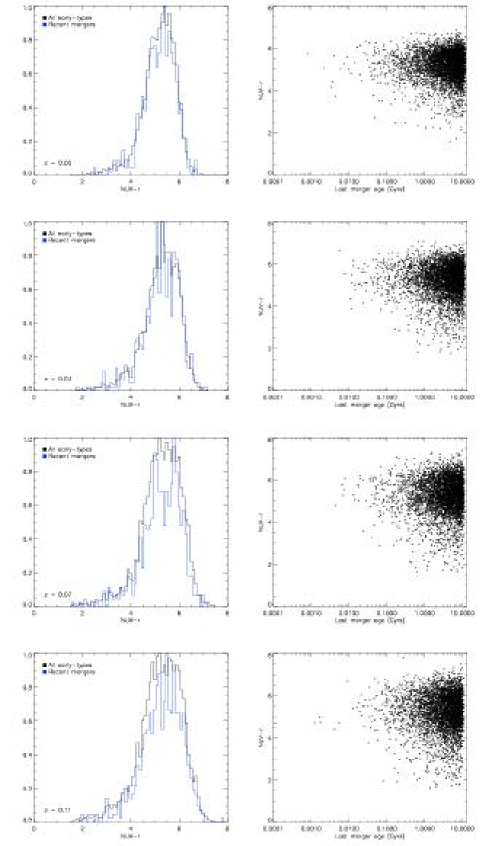
We investigate the impact such recent mergers may have on the colour of the early-type remnants, and the extent to which they may affect the blue colours exhibited by some early-type galaxies. In Figure 24, we compare the colour distribution of galaxies which have experienced recent mergers (within the last Gyr), with the global colour distribution of all early-type galaxies. We find that recent mergers do not have a preponderance of blue galaxies, suggesting that mergers at low redshift are predominantly dry and not the cause for the blue scatter in the colours of early-type galaxies - star formation from the quiescent mode is at least as important as that due to mergers.
We finish this section by briefly mentioning the issue of progenitor bias, which affects all studies of early-type galaxies at , in the framework of the merger paradigm. Fundamental to merger-driven morphological transformations is the implication that, at higher redshifts, a progressively larger fraction of mass that eventually resides in present-day early-types is potentially locked up in late-type systems (van Dokkum and Franx, 2001). Like all other early-type studies, this investigation has attempted to trace the evolution of the local early-type population by looking only at their early-type progenitors in the redshift range - any non early-type progenitors have been excluded, for the simple reason that it is not possible to easily identify them! Although we expect progenitor bias to be smallest at low redshifts (indeed this is the big advantage of studying nearby early-type galaxies!), it is instructive to quantify this effect and gauge its possible impact on the blue fraction derived in Section 4.
The top panel in Figure 25 indicates the extent of progenitor bias by plotting the fraction of the early-type galaxies which have already undergone their last merger and assumed their final early-type morphology as a function of redshift. At , roughly 10 percent of present-day early-type galaxies are still ‘in pieces’. If, for example, these ‘pieces’ were blue late type systems, then we could have underestimated the blue fraction in Section 4. However, we have already shown (Figure 24) that recent mergers in this redshift range have a similar UV colour distribution to the rest of the population i.e. that recent mergers are not preferentially bluer. Indeed, mergers at low redshift have a high probability of involving at least one early-type progenitor (bottom panel of Figure 25). Note that our results are consistent with Khochfar and Burkert (2003) who were the first to present a detailed analysis of the progenitor morphologies of early-type galaxies. Thus, since progenitor bias is small within our redshift range and mergers tend to be dry, neglecting non-early-type progenitors will not affect the blue fraction derived in this study.
6. Revisiting the monolithic hypothesis
The monolithic hypothesis remains the simplest and perhaps most elegant explanation for a remarkably wide range of properties of large early-type galaxies (e.g. Peebles, 2002). Indeed, a careful treatment using N-body/SPH simulations (Chiosi and Carraro, 2002; Tantalo and Chiosi, 2002) suggests that monolithic formation can reproduce a wide spectrum of chemo-photometric properties of large early-types. Until now these properties have been restricted to the optical spectrum - the photometry presented in this paper provides, for the first time, a new constraint on the formation of such large early-type systems. While it is apparent that a merger-based treatment is able to reproduce the + optical photometry of local early-types fairly accurately, the RSF mass fractions ( 1 to 3 percent) involved are small. The presence of young stars in these galaxies indicates that there is fuel, i.e. cold gas, available for star formation at low redshift. It is, therefore, natural to ask whether the required level of fuel could be supplied in a traditional monolithic scheme.
Monolithic models propose a high star formation efficiency at high redshift, which drives a violent episode of star formation resulting in the bulk of the galaxy forming within a short timescale at high redshift (e.g. ). However, stars created in the primordial burst would recycle a fraction of their mass back into the ISM through stellar winds and supernova ejecta. A fraction or all of this internally recycled gas could fuel further star formation, without invoking any external gas accretion or interactions. The aim of this section is to investigate whether, given reasonable assumptions for the evolution and chemical enrichment of such a monolithic system, we can reproduce the RSF and the observed photometry of large early-type systems that form part of the blue fraction 555While we could simply explore the amount of recycled material expected in a typical monolithic simulation, it is necessary to simulate the accompanying chemical enrichment because the NUV-r colour is a function of both the total amount and the metallicity of the recycled gas. The reason for restricting ourselves to large blue galaxies is because, as mentioned before, red galaxies can be reconciled with a monolithic scenario, especially if we assume that part of the scatter in the red sequence is determined by varying levels of intrinsic dust in these galaxies. This monolithic analysis is useful because, if low level star formation seen in the observed blue population can be produced simply by returned material from stars formed in the primordial burst, then there would, in principle, be no need to invoke a merger based scenario to produce early-type galaxies!
6.1. Simulating ‘monolithic collapse’
The model used here (see Ferreras and Silk, 2000b) follows the standard chemical enrichment equations (e.g. Tinsley, 1980). Stellar yields are taken from Thielemann et al. (1996) for stellar masses and from van den Hoek and Groenewegen (1997) for lower mass stars. We use a standard Salpeter IMF and note that assume instantaneous recycling but not instantaneous mass loss, so that the lifetime of stars of various masses is taken into account.
We simulate a scenario where (gaussian) gas infall, with a short timescale ( 1 Gyr), occurs at ‘high’ redshift. Most studies which support the monolithic hypothesis agree on a formation epoch somewhere before - it is difficult to pinpoint it any further using the available data. Our conclusions are not sensitive to the exact redshift of formation so we use a fiducial value of . The ‘formation redshift’ is taken as the epoch at which the gas infall peaks. The star formation rate is governed by the generally accepted Schmidt law (Schmidt, 1959):
| (3) |
where is the star formation rate, is the star formation efficiency, is the gas mass and .
We explore the behaviour of the system using two free parameters. The first and most significant free parameter is the star formation efficiency in Equation 3. Low values of result in more extended star formation, while high values of result in faster consumption of gas and a shorter episode of star formation - note that is not numerically restricted to a value between 0 and 1. As expected, increasing to arbitrarily high values does not result in the star formation increasing without limit, simply because the system cannot consume gas faster than it is being put in! We explore the behaviour of the system in this ‘limiting’ high regime, where star formation essentially tracks the gas infall very closely i.e. as soon as gas becomes available, it is almost instantly converted to stars. As a result, the overwhelming bulk of the galaxy is already constructed by the time gas infall ends at high redshift - mimicking the fundamental feature of a ‘monolithic collapse’. However, star formation does not stop when gas infall ceases. Gaseous ejecta returned from dying stars is gradually released back into the ISM over a Hubble time, providing potential fuel for further star formation. It is the quantity of this recycled gas that we investigate here - in particular, we explore whether there is enough gas in this recycled material to fuel late stage star formation and reproduce the RSF mass fractions seen in large blue early-types in our observed sample.
The second free parameter is a simple prescription for galactic winds, which is parametrised by assuming that a certain fraction () of gaseous ejecta is permanently lost from the system. varies between 0 and 1. We are primarily interested in scenarios where is small, since we are exploring large early-type galaxies which should have potential wells deep enough to retain most of the ejected gas. corresponds to essentially closed-box evolution after the initial gas infall stage.
6.2. RSF in ‘monolithic’ early-type galaxies
We begin by looking at the simplest scenario, where , i.e. all ejecta are retained by the system - this is also, of course, the scenario which maximises the late stage returned gas fraction. The scenario is summarised in Figure 26. The left-hand column shows the star formation rate (top row), gas infall (middle row) and the evolution of stars and gas (bottom row) for various values of (see legend in the top row), with fixed at 0. We note that the ‘limiting’ high regime, which mimics monolithic collapse, is achieved for values of above 100. Above this value, increasing does not affect the SFR (top row), because the SFR is effectively limited by the rate of gas infall, since stars cannot be produced faster than gas is being deposited in the system. As mentioned before, increasing allows the SFR to track the gas infall function more closely, as can be seen in Figure 26 - the yellow SFR curve, which represents a system with high , peaks almost coevally with the gas infall, whereas the black SFR curve, which represents the lower regime, produces more extended star formation and has its peak significantly displaced from the peak of the gas infall. Our focus in this section will be exclusively on the high regime (), in which star formation after the initial gas infall stage is fuelled only by recycled gas.
The right-hand column in Figure 26 shows average quantities produced by such a scenario. The rows from top to bottom show the average age, average metallicity, average alpha-enhancement, fraction of stars formed within the last Gyr (the ‘RSF’ fraction), colour and colour respectively, as a function of (with fixed at 0). We also indicate, in the relevant rows, the average values (and their formal errors) of [m/H] and [Mg/Fe] computed by Trager et al. (2000a) for local early-type galaxies 666Note that Trager et al. (2000a) find milder values of [m/H] and [Mg/Fe] than in previous studies (e.g. Weiss et al., 1995; Trager et al., 1997; Greggio, 1997). Figure 26 indicates that, in the scenario, ‘monolithic’ values of () predict present-day RSF fractions of . In comparison, we find that large (, blue () galaxies in the merger models have present-day RSF fractions of . The monolithic RSF fraction, driven purely by the recycled material from stars, is generally a factor 5-6 lower than what is required, in a merger framework, to reproduce the colours of large, blue early-type galaxies in the observed sample.
It is instructive to explore the full range of values for , although our exclusive interest in large galaxies implies that values of should be low. As we show below, very high values of result in excessive metal loss producing galaxies which are too metal-poor to fit the observed metallicities of local early-types. To illustrate the trend in we show, in Figure 27, the case where i.e. 30 percent of stellar ejecta are permanently lost from the galaxy. We find, in this case, that galaxies are generally more metal-poor than the mean relations derived by Trager et al. (2000a) - increasing simply exacerbates this situation.

We summarise our investigation of monolithic models in Figure 28, which plots the colour (top left), RSF fraction (bottom left), mean metallicity (top right) and mean [Mg/Fe] (bottom right) as a function of and . We find that, in the high regime (), which we take to be the traditional definition of monolithic collapse (see arguments above), models which fit the metallicity and alpha-enhancement expected in local early-type galaxies generally do not produce the blue colours of large blue early-types. Models with reproduce the full spectrum of average metallicities and alpha-enhancements observed in large early-type galaxies. However, the colour predicted by these models is typically above , because RSF fractions contributed by stars within the last Gyr (which dominate the flux) are too low (), compared with blue galaxies predicted in merger models (). To illustrate this, we compare, in Figure 29, a ‘monolithic’ SFH (, ) to the average SFH of large (, blue () early-type galaxies predicted in the merger model. The top panel shows the non-cumulative SFH, while the bottom panel compares the cumulative SFH. Due to the inadequate RSF fractions, blue colours can only be produced in a traditional monolithic scheme by invoking high values of which leads to high metal loss and a metal-poor galaxy. However, such metal-poor models do not fit the observed metallicities of large early-type galaxies in the nearby universe.
It is, of course, conceivable that the expelled gas, parametrised by , does not escape the galaxy potential well completely but is re-accreted by the galaxy over the dynamical timescale of the galaxy. However, recalling that stellar mass which dominates the rest-frame flux is created within the last Gyr of lookback time, we find that for reasonable dynamical timescales, expelled gas falling back into the galaxy will have a negligible effect. We illustrate this using a simple analytical argument. Assuming that the entire expelled fraction () falls back into the galaxy and that this ‘reservoir’ of initially expelled gas empties ‘exponentially’ we have
| (4) |
where is the expelled gas contained in the reservoir and is the dynamical timescale of the galaxy. Therefore, between times and the amount of gas falling into the galaxy is given by
| (5) |
To make a significant impact on the colour of the galaxy, this infalling material must contribute percent of the stellar mass of the galaxy. Assuming that the infall of expelled gas starts promptly after the main mass of the galaxy is in place, i.e. Gyrs after the beginning of star formation (see Figure 26), the gas which produces the emitting stars falls in between and ; assuming the Universe is Gyrs old. Hence, emitting stars less than 1 Gyr old will form a stellar mass fraction approximately equal to
| (6) |
which is required to be , to produce the blue observed colours. However, it is difficult to achieve such mass fractions - reasonable dynamical timescales close to what is expected for large early-type galaxies ( Gyr) provide stellar fractions which are two orders of magnitude lower than the required percent. The stellar fraction is maximum ( percent) for Gyrs which is unrealistic for large early-type galaxies. Robust observational constraints on the amounts of recycled gas will aid the type of analysis presented in this section. Although recent studies (e.g. Young, 2005), which compare the distribution of specific angular momenta of gas and stars, do indicate that at least some of the gas in early-type galaxies is created from stellar mass loss, it is still unclear what fraction of the detected gas may have an external origin. In particular, the gas fractions must eventually be correlated with the intergrated fluxes from these systems, to determine the contribution of internally sourced gas to the luminosity of the early-type galaxy in question - such a study is currently in progess using GALEX and SAURON data and results may become available in the near future (Martin Bureau, private communication).
However, based on the analysis presented in this section we conclude that monolithic evolution, where RSF is driven solely by recycled gas from stellar mass loss, is not a viable channel for the production of large blue early-type galaxies.
7. Conclusions
We have studied 2100 early-type galaxies in the SDSS DR3 which have been detected by the GALEX medium depth (MIS) survey, in the redshift range . The early-type sample has been selected through careful morphological inspection, with potentially -contaminating AGN removed through the use of both optical spectral data (from the SDSS) and radio data (from the VLA FIRST survey). At a 95 percent confidence level, at least 30 percent of early-type galaxies in this sample have optical and photometry consistent with some recent star formation within the last Gyr.
Our analysis indicates that, while optical CMRs cannot distinguish between early-type galaxies which have had star formation within the last Gyr and those which havent, the CMR is an excellent diagnostic of RSF - any galaxy with has a high likelihood of containing recent star formation (RSF), even after taking into account the possibility of a contribution to the spectrum from upturn flux.
Comparison of the observations to predictions of a semi-analytical CDM hierarchical merger model yields good quantitative agreement (across the and optical spectrum), if we assume that (a) very young stars ( Myrs old) are contained in birth clouds which increase dust extinction by a factor of compared to the ISM alone and (b) that star formation is driven by random (pseudo-instantaneous) starbursts which are Poisson distributed in time, so that there is a small timelag between the last starburst and the observation of the galaxy - the timelags are distributed exponentially in time, with maximum and minimum values of 200 and 20 Myrs respectively.
Combining our parametric analysis of the + optical photometry of the observed early-types, with the properties of the predicted population in the semi-analytical model, we conclude that early-type galaxies in the redshift range are likely to have 1 to 3 percent of their stellar mass in stars less than 1 Gyr old. The (-band luminosity weighted age) of this recent star formation is 300 to 500 Myrs.
Finally, we find that monolithically evolving galaxies, where RSF can be produced solely from recycled gas due to stellar mass loss, do not exhibit the blue colours () seen in some large early-type galaxies in our observed sample. While the degeneracy between the monolithic and merger paradigms cannot be broken for red early-types even with photometry, a monolithic scenario is a very unlikely channel for the evolution of large blue early-type systems. Such blue galaxies require additional fuel for star formation which must necessarily have an external origin.
8. Acknowledgements
We are indebted to Ignacio Ferreras for providing the chemical enrichment code which forms the basis of Section 6 and for numerous stimulating discussions during the course of this study. We warmly thank Chris Wolf for providing high-resolution COMBO-17 images which formed an integral part of our morphological classification process. We also thank Mariangela Bernardi for her generous help in the initial stages of this project, for providing the DR2 versions of her SDSS early-type catalog prior to publication, and many interesting discussions. We are grateful to Jeremy Blaizot for his extensive help with the GALICS model and to Andrés Jordán, Joseph Silk, Roger Davies and Andrew Benson for many useful comments regarding this work. SK acknowledges PPARC graduate DPhil scholarship PPA/S/S/2002/03532.
References
- Baldwin et al. (1981) Baldwin, J. A., M. M. Phillips, and R. Terlevich (1981). PASP 93, 5–19.
- Baugh et al. (1996) Baugh, C. M., S. Cole, and C. S. Frenk (1996). MNRAS 283, 1361–1378.
- Becker et al. (1995) Becker, R. H., R. L. White, and D. J. Helfand (1995). ApJ 450, 559–+.
- Bell et al. (2004) Bell, E. F., C. Wolf, K. Meisenheimer, H.-W. Rix, A. Borch, S. Dye, M. Kleinheinrich, L. Wisotzki, and D. H. McIntosh (2004). ApJ 608, 752–767.
- Benson et al. (2000) Benson, A. J., S. Cole, C. S. Frenk, C. M. Baugh, and C. G. Lacey (2000). MNRAS 311, 793–808.
- Bernardi and the SDSS collaboration (2003a) Bernardi, M. and the SDSS collaboration (2003a). AJ 125, 1817–1848.
- Bernardi and the SDSS collaboration (2003b) Bernardi, M. and the SDSS collaboration (2003b). AJ 125, 1849–1865.
- Bernardi and the SDSS collaboration (2003c) Bernardi, M. and the SDSS collaboration (2003c). AJ 125, 1866–1881.
- Bernardi and the SDSS collaboration (2003d) Bernardi, M. and the SDSS collaboration (2003d). AJ 125, 1882–1896.
- Bertola et al. (1995) Bertola, F., A. Bressan, D. Burstein, L. M. Buson, C. Chiosi, and S. di Serego Alighieri (1995). ApJ 438, 680–694.
- Bica and Alloin (1987) Bica, E. and D. Alloin (1987). A&AS 70.
- Blitz and Shu (1980) Blitz, L. and F. H. Shu (1980). ApJ 238, 148–157.
- Boselli et al. (2005) Boselli, A., L. Cortese, J. M. Deharveng, G. Gavazzi, K. S. Yi, A. G. de Paz, M. Seibert, S. Boissier, J. Donas, Y.-W. Lee, B. F. Madore, D. C. Martin, R. M. Rich, and Y.-J. Sohn (2005). ApJ 629, L29–L32.
- Bower et al. (1998) Bower, R. G., T. Kodama, and A. Terlevich (1998). MNRAS 299, 1193–1208.
- Bower et al. (1992) Bower, R. G., J. R. Lucey, and R. Ellis (1992). MNRAS 254, 589.
- Bruzual and Charlot (2003) Bruzual, G. and S. Charlot (2003). MNRAS 344, 1000–1028.
- Burstein et al. (1988) Burstein, D., F. Bertola, L. M. Buson, S. M. Faber, and T. R. Lauer (1988). ApJ 328, 440–462.
- Butcher and Oemler (1984) Butcher, H. and A. Oemler (1984). ApJ 285, 426–438.
- Caldwell et al. (2003) Caldwell, N., J. A. Rose, and K. D. Concannon (2003, June). AJ 125, 2891–2926.
- Calzetti et al. (2000) Calzetti, D., L. Armus, R. C. Bohlin, A. L. Kinney, J. Koornneef, and T. Storchi-Bergmann (2000). ApJ 533, 682–695.
- Charlot and Fall (2000) Charlot, S. and S. M. Fall (2000). ApJ 539, 718–731.
- Chiosi and Carraro (2002) Chiosi, C. and G. Carraro (2002). MNRAS 335, 335.
- Cole et al. (2000) Cole, S., C. G. Lacey, C. M. Baugh, and C. S. Frenk (2000). MNRAS 319, 168–204.
- Couch et al. (1998) Couch, W. J., A. J. Barger, I. Smail, R. S. Ellis, and R. M. Sharples (1998). ApJ 497, 188–+.
- Deharveng et al. (2002) Deharveng, J.-M., A. Boselli, and J. Donas (2002). A&A 393, 843–854.
- Deharveng et al. (1997) Deharveng, J.-M., R. Jedrzejewski, P. Crane, M. J. Disney, and B. Rocca-Volmerange (1997). A&A 326, 528–536.
- Dorman et al. (1995) Dorman, B., R. W. O’Connell, and R. T. Rood (1995). ApJ 442, 105–141.
- Dressler (1980) Dressler, A. (1980). ApJ 236, 351–365.
- Dressler et al. (1997) Dressler, A., A. J. Oemler, W. J. Couch, I. Smail, R. S. Ellis, A. Barger, H. Butcher, B. M. Poggianti, and R. M. Sharples (1997). ApJ 490, 577.
- Ellis et al. (1997) Ellis, R. S., I. Smail, A. Dressler, W. J. Couche, A. J. Oemler, H. Butcher, and R. M. Sharples (1997). ApJ 483, 582.
- Falcon-Barroso and the SAURON collaboration (2005) Falcon-Barroso, J. and the SAURON collaboration (2005). astro-ph/0508199.
- Ferreras et al. (2002) Ferreras, I., E. Scannapieco, and J. Silk (2002). ApJ 579, 247–260.
- Ferreras and Silk (2000a) Ferreras, I. and J. Silk (2000a). ApJL 541, L37–L40.
- Ferreras and Silk (2000b) Ferreras, I. and J. Silk (2000b). ApJ 532, 193–205.
- Fukugita et al. (2004) Fukugita, M., O. Nakamura, E. L. Turner, J. Helmboldt, and R. C. Nichol (2004). ApJL 601, L127–L130.
- Gladders et al. (1998) Gladders, M. D., O. Lopez-Cruz, H. K. C. Yee, and T. Kodama (1998). ApJ 501, 571.
- Greggio (1997) Greggio, L. (1997). MNRAS 285, 151–166.
- Hartmann et al. (2001) Hartmann, L., J. Ballesteros-Paredes, and E. A. Bergin (2001, December). ApJ, 852–868.
- Hatton et al. (2003) Hatton, S., J. E. G. Devriendt, S. Ninin, and F. R. Bouchet (2003). MNRAS 343, 75–106.
- Hodge (1973) Hodge, P. W. (1973). ApJ 182, 671–696.
- Hogg et al. (2002) Hogg, D. W., B. I. K., M. R. Blanton, and D. J. Eisenstein (2002). astro-ph/0210394.
- Kauffmann et al. (2003) Kauffmann, G., T. M. Heckman, S. D. M. White, S. Charlot, C. Tremonti, J. Brinchmann, G. Bruzual, E. W. Peng, M. Seibert, M. Bernardi, M. Blanton, J. Brinkmann, F. Castander, I. Csábai, M. Fukugita, Z. Ivezic, J. A. Munn, R. C. Nichol, N. Padmanabhan, A. R. Thakar, D. H. Weinberg, and D. York (2003). MNRAS 341, 33–53.
- Kauffmann et al. (1993) Kauffmann, G., S. D. M. White, and B. Guiderdoni (1993). MNRAS 264, 201.
- Kaviraj et al. (2005) Kaviraj, S., J. E. G. Devriendt, I. Ferreras, and S. K. Yi (2005). MNRAS 360, 60–68.
- Kaviraj et al. (2005) Kaviraj, S., I. Ferreras, S.-J. Yoon, and S. K. Yi (2005). A&A 439, 913–919.
- Khochfar and Burkert (2003) Khochfar, S. and A. Burkert (2003). ApJL 597, L117–L120.
- Kinney et al. (1996) Kinney, A. L., D. Calzetti, R. C. Bohlin, K. McQuade, T. Storchi-Bergmann, and H. R. Schmitt (1996). ApJ 467, 38–+.
- Knapp (1999) Knapp, G. R. (1999). In ASP Conf. Ser. 163: Star Formation in Early Type Galaxies, pp. 119–+.
- Knapp et al. (1989) Knapp, G. R., P. Guhathakurta, D.-W. Kim, and M. A. Jura (1989). ApJS 70, 329–387.
- Knapp and Rupen (1996) Knapp, G. R. and M. P. Rupen (1996). ApJ 460, 271–+.
- Kong et al. (2004) Kong, X., S. Charlot, J. Brinchmann, and S. M. Fall (2004). MNRAS 349, 769–778.
- Larson (1974) Larson, R. B. (1974). MNRAS 166, 385.
- Martin and the GALEX Team (2005) Martin, D. C. and the GALEX Team (2005). ApJ 619, L1–L6.
- Morrissey and the GALEX Team (2005) Morrissey, P. and the GALEX Team (2005). ApJ 619, L7–L10.
- Peebles (2002) Peebles, P. J. E. (2002). In ASP Conf. Ser. 283: A New Era in Cosmology, pp. 351–+.
- Peng et al. (2003) Peng, E. W., H. C. Ford, and K. C. Freeman (2003). ArXiv Astrophysics e-prints.
- Press and Schechter (1974) Press, W. H. and P. Schechter (1974). ApJ 187, 425–438.
- Pritchet (1979) Pritchet, C. (1979). ApJ 231, 354–363.
- Proctor and Sansom (2002) Proctor, R. N. and A. E. Sansom (2002). MNRAS 333, 517–543.
- Rejkuba et al. (2004) Rejkuba, M., L. Greggio, and M. Zoccali (2004). A&A 415, 915–929.
- Rejkuba et al. (2001) Rejkuba, M., D. Minniti, D. R. Silva, and T. R. Bedding (2001). A&A 379, 781–797.
- Rich et al. (2005) Rich, R. M., S. Salim, J. Brinchmann, S. Charlot, and the GALEX collaboration (2005). ApJ 619, L107–L110.
- Schawinski et al. (2005) Schawinski, K., S. Khochfar, S. Kaviraj, S. J. Yoon, S. K. Yi, and the GALEX Team (2005). MNRAS, in preparation.
- Schiminovich et al. (1994) Schiminovich, D., J. H. van Gorkom, J. M. van der Hulst, and S. Kasow (1994). ApJL 423, L101+.
- Schmidt (1959) Schmidt, M. (1959). ApJ 129, 243–+.
- Schweizer et al. (1996) Schweizer, F., B. W. Miller, B. C. Whitmore, and S. M. Fall (1996). AJ 112, 1839–+.
- Scoville and Wilson (2004) Scoville, N. Z. and C. D. Wilson (2004). Molecular Gas forming Massive Star Clusters and Starbursts. In ASP Conf. Ser. 322: The Formation and Evolution of Massive Young Star Clusters, pp. 245–+.
- Simien and de Vaucouleurs (1986) Simien, F. and G. de Vaucouleurs (1986). ApJ 302, 564–578.
- Somerville and Primack (1999) Somerville, R. S. and J. R. Primack (1999). MNRAS 310, 1087–1110.
- Stanford et al. (1998) Stanford, S. A., P. R. M. Eisenhardt, and M. Dickinson (1998). ApJ 492, 461.
- Tantalo and Chiosi (2002) Tantalo, R. and C. Chiosi (2002). A&A 388, 396–406.
- Thielemann et al. (1996) Thielemann, F.-K., K. Nomoto, and M.-A. Hashimoto (1996). ApJ 460, 408–+.
- Tinsley (1980) Tinsley, B. M. (1980). Fundamentals of Cosmic Physics 5, 287–388.
- Toomre (1977) Toomre, A. (1977). Mergers and Some Consequences. In Evolution of Galaxies and Stellar Populations, pp. 401–+.
- Toomre and Toomre (1972) Toomre, A. and J. Toomre (1972). ApJ 178, 623–666.
- Trager et al. (1997) Trager, S. C., S. M. Faber, A. Dressler, and A. J. Oemler (1997). ApJ 485, 92–+.
- Trager et al. (2000a) Trager, S. C., S. M. Faber, G. Worthey, and J. J. González (2000a). AJ 119, 1645–1676.
- Trager et al. (2000b) Trager, S. C., S. M. Faber, G. Worthey, and J. J. González (2000b). AJ 120, 165–188.
- van den Hoek and Groenewegen (1997) van den Hoek, L. B. and M. A. T. Groenewegen (1997). ApJS 123, 305–328.
- van Dokkum and Franx (2001) van Dokkum, P. G. and M. Franx (2001). ApJ 553, 90–102.
- van Dokkum et al. (2000) van Dokkum, P. G., M. Franx, D. Fabricant, G. D. Illingworth, and D. D. Kelson (2000). ApJ 541, 95–111.
- van Dokkum et al. (1999) van Dokkum, P. G., M. Franx, D. Fabricant, D. D. Kelson, and G. D. Illingworth (1999). ApJ 520, L95.
- Weiss et al. (1995) Weiss, A., R. F. Peletier, and F. Matteucci (1995). A&A 296, 73–+.
- Wilcots et al. (1990) Wilcots, E. M., P. Hodge, P. B. Eskridge, F. Bertola, and L. Buson (1990). ApJ 364, 87–93.
- Yi et al. (1997) Yi, S., P. Demarque, and A. J. Oemler (1997). ApJ 486, 201–+.
- Yi et al. (1998) Yi, S., P. Demarque, and A. J. Oemler (1998). ApJ 492, 480–+.
- Yi (2003) Yi, S. K. (2003). ApJ 582, 202–214.
- Yi et al. (2004) Yi, S. K., E. Peng, H. Ford, S. Kaviraj, and S.-J. Yoon (2004). MNRAS 349, 1493–1499.
- Yi et al. (2005) Yi, S. K., S.-J. Yoon, S. Kaviraj, J.-M. Deharveng, and the GALEX Science Team (2005). ApJ 619, L111–L114.
- Young (2005) Young, L. M. (2005). astro-ph/0508330.