G359.95-0.04: An Energetic Pulsar Candidate Near Sgr A∗
Abstract
We report the discovery of a prominent nonthermal X-ray feature located near the Galactic center that we identify as an energetic pulsar wind nebula. This feature, G359.95-0.04, lies 1 lyr north of Sgr A∗ (in projection), is comet-like in shape, and has a power law spectrum that steepens with increasing distance from the putative pulsar. The distinct spectral and spatial X-ray characteristics of the feature are similar to those belonging the rare class of ram-pressure confined pulsar wind nebulae. The luminosity of the nebula at the distance of Sgr A∗, consistent with the inferred X-ray absorptions, is in the 2–10 keV energy band. The cometary tail extends back to a region centered at the massive stellar complex IRS 13 and surrounded by enhanced diffuse X-ray emission, which may represent an associated supernova remnant. Furthermore, the inverse Compton scattering of the strong ambient radiation by the nebula consistently explains the observed TeV emission from the Galactic center. We also briefly discuss plausible connections of G359.95-0.04 to other high-energy sources in the region, such as the young stellar complex IRS 13 and SNR Sgr A East.
1 Introduction
The Galactic center (GC) provides a unique laboratory for a detailed study of the interplay between massive star formation and galactic nuclear environment. Particularly interesting is the presence of a young massive stellar cluster around Sgr A∗ — the super-massive black hole (SMBH) of the Galaxy (e.g., Genzel et al. (2003)). This cluster, with an integrated mass of , has an age of yrs and a flat initial mass function; therefore a considerable number of supernovae (SNe) should have occurred in this region. The presence of their stellar end-products (e.g., pulsars) and supernova remnants (SNRs) could be responsible for various high-energy phenomena observed in the GC region and could also have strong impacts on the environment, and hence on accretion onto the SMBH (e.g., Aharonian et al. (2004); Belanger et al. (2005); for a review, see Melia & Falcke (2001)).
However, no pulsar has yet been found within of the Galactic center. Traditional radio searches at GHz are insensitive to pulsars in this region because interstellar scattering causes severe pulse broadening (Cordes & Lazio, 1997). At high frequencies ( GHz), where pulse broadening () is not as important, blind pulsar searches are difficult because radio telescope beams are small and because pulsar spectra are typically steep, with correspondingly less flux available. More productive are searches in the hard ( keV) X-ray band, where young pulsars, their wind nebulae (PWNe), and/or SNRs can be identified by X-ray imaging. Indeed, strong X-ray emission from SNR Sgr A East, near Sgr A∗, has long been known. In particular, (Park et al., 2005) have suggested that a point-like hard X-ray source CXOGC J174545.5–285829, or “cannonball”, is a candidate of a young pulsar, which may have been ejected from the SNR.
Recently, from the larger GC region (Wang, Gotthelf, & Lang, 2002), Wang, Lu, & Lang (2002) and Lu, Wang, & Lang (2003) have detected three X-ray threads associated with nonthermal radio filaments or radio “wisps”. These highly polarized radio features, observed only in the GC, are due to synchrotron radiation from relativistic particles (electrons and/or positrons). The detection of the X-ray counterparts to these filaments provides strong constraints on the particle acceleration mechanism. The X-ray emission, if also due to the synchrotron process, must arise from particles accelerated nearly in situ. A possible origin of these particles is PWNe, perhaps shaped by the strong magnetic field and/or ram-pressure of the GC (Wang, Lu, & Lang, 2002). Alternatively, some of the X-ray threads may represent shocks of young SNRs (Ho et al., 1985; Sakano et al., 2003).
Here we report on our study of a prominent nonthermal X-ray feature which probably represents the most convincing case for the presence of a young pulsar in the GC. This pulsar is separated from Sgr A∗ by only 87 at its distance of kpc, corresponding to a projected separation of 0.32 pc. In the following, all error bars of our X-ray measurements are presented at the 90% confidence level.
2 Data Calibration
This work takes advantage of a large number of Chandra observations aimed at Sgr A∗. We utilize the archival data available by September 2005, including the twelve observations taken before May 3, 2002, as listed by Park et al. (2005), and three more recent ones (Obs. # 3549, 4683, and 4684) taken on June 19, 2003 and July 5-6, 2004. The total resultant exposure of the included observations is 710 ks. We first process individual observations, following standard CIAO (version 3.2.2) event reprocessing procedures, including the correction for charge transfer inefficiency, bad-pixel-removing, and light-curve cleaning. We corrected the absolute astrometry of each observation by matching the centroid of the X-ray source CXOGC J174540.03–290028.2 with its counterpart (Sgr A∗) position [R.A., Dec. (J2000) ; Reid et al. (1999)] obtained in the high resolution (75 mas) near-IR (SINFONI) image (Eisenhauer et al., 2005). While CXOGC J174540.03–290028.2 is clearly resolved, we use the radial surface intensity of the source CXOGC J174540.0–290031, a low-mass X-ray binary (LMXB) with an eight hour orbital period (Muno et al., 2005), to characterize the point spread function, which is compared to other nearby sources to look for possible deviations from point-like emission. The astrometry uncertainty and spatial resolution of the final, merged data set are and 09 (FWHM), respectively, for the region of interested here (Fig. 1). Part of the PSF broadening is due to the dust scattering along the sight line to the GC (Tan & Draine, 2004).
We construct event images with a bin size of 00984 in the 1–2.5, 2.5–4, 4–6, 6–9 keV bands. The corresponding exposure-corrected (flat-fielded) images are constructed with using a weighted spectrum assuming an absorbed power law model with a photon index 1.7 and foreground cool gas column of N cm-2. The flat-field correction is small () over our region of interest.
3 Analysis and Results
Fig. 1 shows the field around Sgr A∗in radio, near-IR, and X-ray. There is little general correlation among features in these wavelength bands. The obvious exceptions are Sgr A∗, showing strong emission in both radio and X-ray, and IRS 13 in all three bands. Fig. 1a shows the large-scale environment of the central concentration of X-ray sources and diffuse features in the close vicinity of Sgr A∗. There is an apparent (though relatively low surface brightness) patchy shell-like structure, on scales of , especially to the northwest of Sgr A∗. Here we focus on the central concentration, particularly the outstanding comet-shaped X-ray feature, referred to herein as G359.95-0.04, or G359 for short. This feature is substantially more elongated and brighter than the other X-ray-emitting PWN candidate, “cannonball”, 23 northeast of Sgr A∗ (Park et al., 2005). The X-ray emission from this latter source shows only a tiny tail and has a luminosity of in the 2–10 keV band. The front end of G359 was detected previously as CXOGC J174539.7–290020 (Baganoff et al., 2003) and is located at coordinates in our constructed image (Fig. 1). This position is 87 from Sgr A∗, corresponding to a projected separation of 0.32 pc. The tail of G359 extends to a region even closer to Sgr A∗ ( away). Part of the tail was detected as CXOGC J174539.7–290022 (Baganoff et al., 2003). The combined extent of this source was mentioned by Baganoff et al. (2003), although no further analysis or discussion of its nature was given. Figs. 1-2 clearly show that G359 represents a coherent structure, ′′ wide and ′′ long. The front end appears to be point-like, with a full intrinsic extent . A comparison of the count rates in individual observations shows no evidence for significant variability, although we cannot rule out flux changes at the level. The mean count rate of this point-like source is , or of the rate from the entire G359 feature.
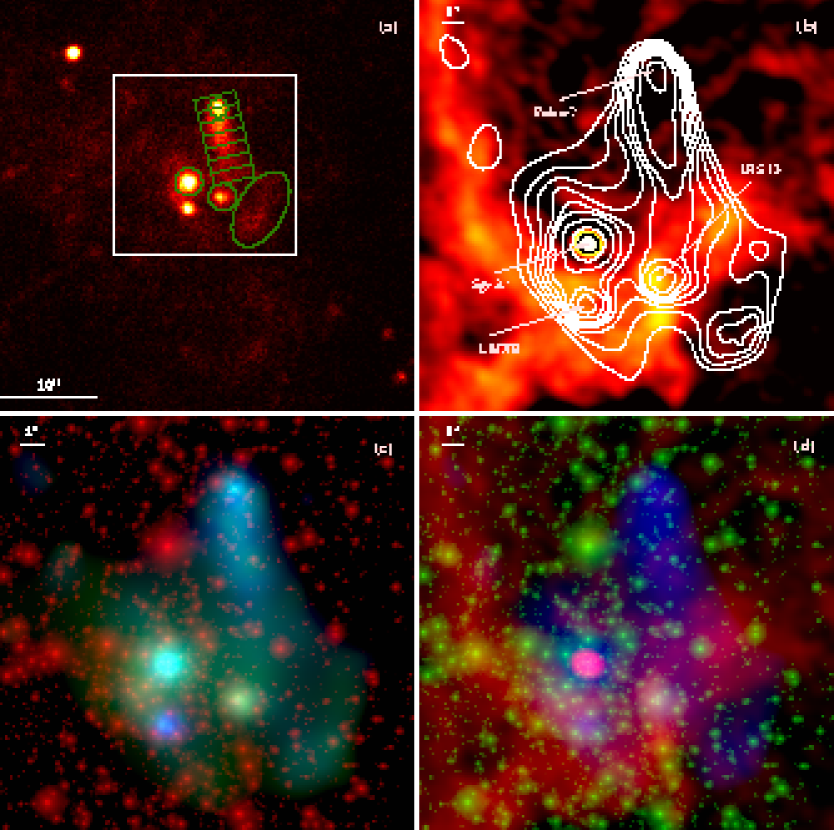

Fig. 3 presents ACIS-I spectral data and model fits of G359 and three relevant X-ray features in the region. These features are characterized mainly to facilitate X-ray spectral comparison and discussion on their potential links to G359 (§ 6). The results of the fits are summarized in Table 1. G359 shows a hard and featureless X-ray spectrum (Fig. 3a). We extract the ACIS-I spectra of the point-like source and the entire feature, using a 1′′ radius aperture and a rectangular box, as outlined in Fig. 1a. We further estimate the local background from a field north of G359; alternative background fields are used to test the effect of the background choice on our spectral results. The overall energy spectrum of the entire G359 can be well characterized by a power law, , which is the photon energy in units of keV. Residuals to this spectral fit (the lower panel of Fig. 3a), however, shows an apparent dip, which can be characterized by a negative Gaussian with a centroid of keV and an equivalent width of eV. This dip, if real, is difficult to explain. The energy centroid roughly corresponds to the H-like Fe K line. But there is no evidence at keV for a He-like Fe K absorption line, which should be stronger.

To examine the spectral change along the major axis of G359, we divide the rectangular box into seven sections (Fig. 1) and conduct a joint power law fit to their spectra with a shared absorption column density . This gives a satisfactory fit () for , with the photon index ranging from at the point-like source position to towards the other end of comet-like structure (Fig. 2b). Note that the fitted NH does depend on the assumed spectral shape; the systematic uncertainty in NH is probably up to . Fig. 2b clearly shows a systematic trend, with spectral steepening that clearly increases with distance away from the point-like source centroid, although the last data point is sensitive to the background choice.
| Source | Model | |||||||
|---|---|---|---|---|---|---|---|---|
| G359 | PW | 1.43(1.34, 1.53) | 1.94(1.80, 2.11) | — | — | 274/269 | 5.9 | 10 |
| SWXE | GNEI | 1.03(0.94, 1.12) | — | 2.5(2.1, 3.0) | 2.9(2.0, 4.0) | 120/114 | 1.2 | 2.7 |
| IRS 13 | GNEI | 1.06(0.98, 1.20) | — | 2.0(1.7, 2.3) | 3.7(1.9, 4.4) | 83/77 | 0.73 | 2.0 |
| Sgr A∗ | GNEI+PW | 1.10(1.01, 1.20) | -1.4(0.4) | 2.6(1.6, 3.4) | 3.0(2.3, 3.9) | 211/209 | 2.5 | 4.8 |
Note. — The included spectral models are power law (PW) and non-equlibrium ionization plasma (GNEI). The key model parameters given are the absorption column density in units of cm-2, the power law photon index , the plasma temperature in keV, and the ionization parameter in cm. Also included are the observed flux (2-10 keV) in and the absorption-corrected luminosity (2-10 keV) in (a distance of kpc is assumed). Uncertainty intervals of the parameters are all statistical at the 90% confidence.
G359 seems to emerge from a region near IRS 13, which is surrounded by enhanced diffuse X-ray emission (Fig. 1). Part of this emission from the southwest of CXOGC J174540.0–290031, however, is due to scattered flux from CXOGC J174540.0–290031 (Muno et al., 2005). We extract a spectrum from the southwestern X-ray enhancement (SWXE; the region enclosed by the ellipse in Fig.1a), which is least confused with discrete sources. A local background is obtained from a field further southwest. The background-subtracted diffuse X-ray spectrum (Fig. 3b) shows two distinct line features at keV and 6.55 keV, which are at the intermediate energies between the neutral and He-like K transitions of S and Fe, respectively. A natural explanation of these line signatures is then that the diffuse X-ray emission arises from an optically-thin thermal plasma in a non-equilibrium ionization (NEI) state. Indeed, the spectrum is reasonably well characterized by the XSPEC model gnei with the abundance set to Solar (Table 1; Fig. 3b). The ionization timescale averaged plasma temperature is not constrained. We find that similar models (e.g., nei, npshock) give essentially the same results.
The young stellar complex IRS 13 nearly coincides with the centroid of an apparently resolved X-ray source (CXOGC J174539.7–290029; Fig. 1; Baganoff et al. (2003) and references therein). The slight offset ( to the west) of this X-ray source from IRS 13 is only marginally significant. Surprisingly, the ACIS-I spectrum of the source (Fig. 3c) shows the same line signature for an NEI plasma as in the spectrum of the SWXE (Fig. 3b). Similar signature is also indicated in a spectrum of Sgr A∗ from a 51 ks ACIS-I observation (Baganoff et al., 2003). For comparison, we extract a spectrum for Sgr A∗ (Fig. 3d) from the present multiple ACIS-I observations (Fig. 1a). This spectrum is remarkably similar to that of IRS 13, clearly exhibiting the NEI line signature (Fig. 3c and d). Both spectra can be well fitted with the gnei model. The Sgr A∗ spectrum does show a significant excess above the model at high energies ( keV); a combination of the model with a power law further improves the fit (Fig. 3d; Table 1). Although such a spectral decomposition or even the choice of the gnei model may be far from being physical, the similar NEI nature of these X-ray-emitting objects is apparent. The absorption column densities toward these sources or features are comparable, except perhaps for G359 (Table 1). As shown above, the higher value obtained in the spectral fit to G359 is at least partly due to the over-simplified power law description of this complex feature. Indeed, the 90% lower limit from the above joint power law fit to the divided spectra of the feature is consistent with the values for the other sources. If the excess absorption is real, however, then G359 may be embedded in a dense cloud and/or may be significantly beyond Sgr A∗ in location.
4 G359.95-0.04 as a Ram-pressure-confined PWN
Any interpretation of G359 needs to account for its distinct X-ray characteristics: the cometary shape, the hard and apparently nonthermal spectrum, the systematic spectral steepening with distance from the front end, and the relatively high X-ray flux in contrast to little emission in both radio and infrared. We find that a ram-pressure confined PWN (e.g., Wang et al. (1993); van der Swaluw, Downes, & Keegan (2004)) provides a natural explanation of these X-ray characteristics. The term “ram-pressure confinement” is loosely defined here to mean that a large pressure gradient is responsible for producing the compact head and the one-side outflow morphology of G359. The region around Sgr A∗ may be largely occupied by low-density hot gas (e.g., reverse shock heated SN ejecta), in which a weak bow shock or a pressure gradient confinement is likely formed upstream (van der Swaluw, Downes, & Keegan, 2004). But the region also contains considerable amounts of H II and possibly molecular gases (e.g., Shukla, Yun, & Scoville (2004)), in which one expect a strong upstream bow shock. We assume that G359 is located in the vicinity of Sgr A∗. The absorption-corrected luminosity of G359 is then erg s-1 in the 2–10 keV band, well within the luminosity range of similar PWNe such as B1929+10 (Wang et al., 1993; Becker et al., 2005), N157B (Wang et al., 2001), and several more recently discovered nebulae (Gaensler et al. (2004) and references therein). In particular, the Mouse nebula (powered by PSR J1747–2958; Gaensler et al. (2004)) is very similar to G359 in their X-ray morphologies, spectral steepening behaviors, and luminosities.
We can estimate the spin-down power of the putative pulsar in G359 from the empirical relationship of Gotthelf (2003). This applies to all rotation-powered known pulsars with observed bright PWNe, of which G359 apparently qualifies. Based on our measured mean power law index () for G359 we estimate a pulsar spin-down power of . But with a considerable dispersion about the above empirical relationship (Gotthelf, 2003), this estimate is uncertain by at least a factor of 10.
In the ram-pressure confined PWN scenario, the pulsar is located inside the leading edge. The bulk of the pulsar spin-down energy is expected to be released in a relativistic wind consisting of particles (assumed to be mainly electrons and positrons). A terminal shock should thermalize the bulk of pulsar wind particles to achieve a more-or-less Maxwellian distribution with the peak at , the Lorentz factor of the pulsar wind (e.g., Arons & Tavani (1994)). The particle acceleration at the shock modifies this distribution to form a high energy power law component, which is traced by the observed X-ray synchrotron emission. A particle that generates the synchrotron emission with a characteristic photon energy typically has a Lorentz factor
| (1) |
where is the magnetic field in units of G.
In a ram-pressure confined PWN, the shocked wind material is pushed downstream into a tail in the opposite direction of the pulsar motion. With a large ambient pressure gradient and no significant gas entraining, the flow can reach a velocity () comparable to the sound speed of the ultra-relativistically hot plasma, (van Buren & McCray, 1988; Wang et al., 1993; Bucciantini, Amato, & Del Zanna, 2005). The time for the flow to pass through the observed length of G359 ( pc) is where is the inclination angle of the flow relative to the line of sight. To account for the observed spectral steepening along G359, this flow time should be roughly equal to the X-ray synchrotron lifetime of the particles, , assuming no further acceleration of the downstream particles. Therefore, the magnetic field is
| (2) |
The total magnetic field energy can then be estimated as
| (3) |
where is the total X-ray-emitting volume of G359, assumed to have an approximate prolate shape with the major and minor axis to be 8′′ and 2′′ (§ 3). This energy is comparable to within the uncertainties of the parameter values (e.g., with keV, , , and ), indicating that the input energy from the pulsar is reasonably equal-partitioned between the thermal and magnetic field forms in G359.
From the observed X-ray spectral properties of G359, we can further infer the underlying energy distribution of the synchrotron particles. We assume that freshly accelerated particles have a differential energy distribution
| (4) |
From the observed power law photon index (Fig. 2b) at the head of G359, we obtain . Because of the synchrotron cooling, the higher energy part of the distribution steepens in the downstream. Over the entire PWN, the balance between the acceleration and the synchrotron cooling leads to an energy distribution of accumulated particles
| (5) |
The break between Eqs. 4 and 5 occurs at , where is the age of the pulsar in units of yrs (Chevalier, 2000). The expected steepening () in the corresponding synchrotron spectrum is consistent with the value for the entire G359 [, corresponding to ; § 3]. At lower energies where the synchrotron cooling does not dominate, other processes become important, such as inverse Compton scattering (ICS) in the nebula. The corresponding particle energy distribution can be probed through observations of synchrotron radiation at lower photon energies and -rays from the ICS (§ 5).
No radio counterpart is found for G359 (Fig. 1b). The point-like radio emission from the putative pulsar may be too faint to be present in existing observations and may be beamed away from our direction. The absence of the extended radio emission indicates the lack of particles with (see Eq. 1), presumably because the pulsar wind has a substantially greater . Fig. 1b does show a possibly related radio enhancement just south of IRS 13. This enhancement does not seem to be associated with any stellar complex and shows an unusually low radio recombination to continuum ratio (Shukla, Yun, & Scoville 2004). The enhancement seems to be aligned well with the X-ray-emitting G359 and thus may represent the terminal shock of the downstream flow. We do not expect a significant accumulation of the radio-emitting synchrotron particles in the PWN, however, because of their efficient ICS cooling in the strong ambient photon field (§ 5).
5 G359.95-0.04 as a TeV Source
The presence of a young energetic pulsar, only 87 from Sgr A∗, can also explain the very high energy (VHE; TeV) -ray radiation observed from the GC (e.g., Aharonian et al. (2004); Albert et al. (2005)). The HESS array of Cherenkov telescopes, in particular, gives an emission centroid error radius of , which does not allow for a spatial separation between G359 and Sgr A∗. Various mechanisms for generating the emission have been proposed, almost all of which are related to Sgr A∗, Sgr A East, or the hypothetical annihilation of super-symmetric dark matter particles (e.g., Aharonian & Neronov (2005) and references therein). In addition, Quataert & Loeb (2005) have suggested that stellar wind shocks may efficiently accelerate particles to relativistic energies, which might scatter ambient photons to TeV energies. However, there is little observational evidence for the expected diffuse (synchrotron) X-ray emission from such particles, except from G359, in the vicinity of Sgr A∗. In addition, younger and more massive stellar clusters, such as Arches and Quintuplet, are not detected as TeV sources in the HESS survey.
G359 as a PWN gives a ready explanation for the VHE -ray emission, as the well-known example of the Crab Nebula shows. Interestingly, the only other HESS source within the inner region of the GC is a known PWN in SNR G0.9+0.1 (Aharonian et al., 2005). An one-zone synchrotron plus ICS model well describes the data from radio to VHE -ray with reasonable physical parameters of the PWN. We note that Atoyan & Dermer (2005) have proposed that the VHE -ray radiation from the vicinity of Sgr A∗ may be produced by a hypothetic wind nebula, which could be produced by the SMBH, in a way similar to a PWN. G359 is about four times more luminous than Sgr A∗ in its quiescent state (Baganoff et al., 2003) and is also much more extended, consistent with the lack of the variability among the HESS observations. Therefore, G359 is the most logic suspect for the VHE -ray radiation.
In a PWN, VHE -ray radiation arises from the ICS of lower-energy ambient seed photons (e.g., the cosmic microwave background and stellar light) by energetic particles. Under the Thomson approximation, a seed photon with energy after an ICS reaches a characteristic photon energy . This approximation is good for (Moderski et al., 2005), i.e., when the photon energy in the rest frame of the particle is considerably smaller than . Otherwise, the Compton recoil (discrete energy gain) by the particle must be accounted for, resulting in the so-called Klein-Nishina (KN) effect, or the reduction of the ICS efficiency. As a result, the ICS of ultraviolet photons, which are abundantly produced by massive GC stars, to the TeV regime is strongly suppressed. Instead, the dominant ICS seed photon source for the TeV radiation in the vicinity of Sgr A∗ is the far infrared (FIR) emission (dust-reprocessed stellar light) with an energy density of and a characteristic photon energy of eV (Davidson et al., 1992; Quataert & Loeb, 2005). Therefore, we concentrate on the FIR-to-TeV ICS, assuming that G359 is located in the vicinity of Sgr A∗.
To check the relative importance of the ICS and the synchrotron emission in particle cooling, we also need to consider the photon to magnetic energy density ratio . Following Moderski et al. (2005), we express the ratio of the ICS power () to the synchrotron power () as
| (6) |
where the function describes the KN suppression relative to the Thomson approximation. For the FIR-to-TeV ICS, the required Lorentz factor . The corresponding indicates only a moderate KN suppression, which is further compensated by . The condition defines a characteristic particle Lorentz factor (Moderski et al., 2005). For particles with , (; the KN effect is not important), the ICS cooling is a factor of more efficient than the synchrotron emission. As a result, the synchrotron cooling diminishes from infrared to radio. For , the ICS is strongly suppressed by the KN effect and the synchrotron radiation dominates. For X-ray-emitting synchrotron particles, the ICS cooling may not be totally negligible, largely depending on the actual value of .
We can estimate the TeV flux from the ICS, based on the observed X-ray synchrotron emission of G359 (§ 3). The differential photon flux of the synchrotron emission as a function of can be approximately expressed as
| (7) |
where the index is chosen because both and are likely greater than (§4). We further express the ratio of the ICS intensity to the synchrotron flux as
| (8) |
where and . Here we have neglected any Doppler effect that may be caused by the bulk motion of the flow. From Eqs 6, 7, and 8 as well as at 1 keV (§ 3), we obtain the expected flux at TeV as
| (9) |
for .
We can now compare the above estimate with the observed spectrum of the TeV emission, which can be characterized by a power law (Aharonian et al., 2004; Albert et al., 2005): . By having , we obtain the corresponding mean magnetic field strength in the ICS region as G, which is comparable to the value from the synchrotron modeling of the X-ray data (§4). The power law index is marginally greater than that of the observed X-ray spectrum, which may be a result of an expected spectral break at TeV due to the KN suppression of the ICS by particles with . Therefore, the ICS of GC ambient FIR photons by particles in the PWN provides a consistent interpretation of the TeV radiation from the GC.
6 Connection to Other Galactic Center Objects
Within the centroid uncertainty of the G359 pulsar, we find a near-IR object [OEG99]192 (, ). This object has a K magnitude of 12.8, with evidence for variation (Ott, Eckart, & Genzel, 1999) and is likely to be an early-type star at the GC. The object could be a binary companion of the pulsar. In this case, the ambient medium must be relatively dense, because a binary is physically not expected to travel at a speed as high as would be expected for an isolated pulsar. A proper motion of [OEG99]192 at a few km s-1 would also have been noticed in existing monitoring observations of the GC. Alternatively, the object is not related to the pulsar. The probability that [OEG99]192 represents only a chance position coincidence is not small; there are other 10 SIMBAD objects in a 3′′ radius, for example.
What could we learn about the origin of G359 from its well-defined cometary shape and the apparent motion away from the the GC cluster? The mere presence of such a coherent feature in this dynamic region is quite extraordinary, where strong winds (e.g., from Sgr A∗ and the GC cluster), or even the turbulent motion of hot gas, may be expected to have high velocities up to . For the ram-pressure confinement to work, the relative motion between the G359 pulsar and the ambient medium should have a velocity at least of the same order, unless the pulsar happens to run into a relative dense cloud, which may be indicated by the somewhat higher absorption toward G359 than toward other sources in the region (§ 3). Furthermore, to produce the observed orientation this velocity should be in the opposite direction of the G359 X-ray tail, i.e., in the similar direction of the expected outward winds. One possible way to generate such a high velocity is that the G359 pulsar was ejected dynamically from the close vicinity of the SMBH or an intermediate-mass black hole (IMBH; e.g., Yu & Tremaine (2003)).
One plausible site for the pulsar ejection from an IMBH is the IRS 13 complex. Maillard et al. (2004) have suggested that the complex is the remnant core of a massive star cluster and may contain an IMBH, which helps to bound the system from a complete disruption by the tidal field of the SMBH (see also Schödel et al. (2005)). As shown in § 3, the comparable X-ray intensities and spectral signatures of IRS 13 and Sgr A∗ indicate that similar emission processes are involved. Thus, the putative IMBH may play a role in the X-ray emission from IRS 13. With the present separation of ′′ between IRS 13 and G359, the required travel time of the pulsar is yrs , where is the proper motion of the pulsar (in units of ) relative to IRS 13. During this period of time, the IRS 13 complex should be moving at under the gravitational pull of the SMBH with a mass of . The complex may have traveled a considerable fraction of the distance that the G359 has done after the ejection, which may explain a slight misalignment between IRS 13 and G359. Alternatively, this misalignment or the slight bending of the G359 tail to the west (Fig. 1) may be caused by the momentum impact of the winds from the Sgr A∗ and the GC cluster. The G359 pulsar, if indeed ejected dynamically from IRS 13, could then be formed much earlier. This opens up a possible connection between the pulsar/IRS 13 and SNR Sgr A East, which has an age of yrs (Park et al., 2005). The current separation between the explosion site (IRS 13) and the SNR could be caused partly by the ambient ram-pressure inserted on the latter.
It is also entirely possible that G359 is not directly related to IRS 13 itself and/or the Sgr A East SNR. But G359 may still likely originate in the GC cluster, to which IRS 13 belongs, and may be responsible for much of the diffuse and apparently thermal X-ray-emitting structure in the vicinity of Sgr A∗ (§ 3). The small ionization parameter ( s cm-3; Table 1) indicates that the gas was heated only recently. The structure may represent heated ejecta of the SN that produced the G359 pulsar. The evolution of this SNR could have been affected substantially by the winds from both young and old stars and from Sgr A∗ as well as by the large differential rotation and the strong magnetic field that thread the ambient medium. It is, however, beyond the scope of the present work to carefully examine these processes in the remnant evolution, let alone its interaction with the PWN. If G359 indeed results from a separate explosion, Sgr A East is then not the only SNR that has recently influenced the GC environment, hence the accretion of the SMBH.
While the PWN interpretation of the G359 can be firmly established only when a periodic signal from the pulsar is detected, observations with fast timing capability are the natural next step. Based on the above results, we have estimated the exposure time needed to detect putative pulsations from G359 using Chandra HRC or XMM-Newton EPIC-pn observations acquired in the fastest imaging/timing mode. With the limited sensitivity or spatial resolution of these instruments, however, such an observation will need an exposure in excess of a mega-second. We thus strongly encourage follow-up timing observations of G359 in radio, near-IR, or possibly -ray.
In conclusion, G359 as a ram-pressure confined PWN provides a natural interpretation for the observed steady X-ray flux, comet-shape morphology, featureless hard nonthermal spectrum, and spectral steepening away from the putative pulsar. The presence of this PWN may also be responsible for much of the enhanced diffuse X-ray emission and the VHE -ray source in the vicinity of Sgr A∗. An understanding of this energetic nonthermal X-ray feature, whatever its true nature may be, is important for studying the nuclear environment of the Galaxy.
References
- Aharonian et al. (2004) Aharonian, F., et al. 2004, A&AL, 425, 13
- Aharonian et al. (2005) Aharonian, F., et al. 2005, A&AL, 432, 25
- Aharonian & Neronov (2005) Aharonian, F., & Neronov, A. 2005, ApJ, 619, 306
- Albert et al. (2005) Albert, J., et al, 2005, ApJL, submitted (astro-ph/0512469)
- Arons & Tavani (1994) Arons, J., & Tavani, M. 1994, ApJS, 90, 797
- Atoyan & Dermer (2005) Atoyan, A., & Dermer, C. D. 2005, ApJL, 617, 123
- Baganoff et al. (2003) Baganoff, F. K., et al. 2003, ApJ, 591, 891
- Becker et al. (2005) Becker, W., et al. 2005, ApJ, submitted, (astro-ph/0506545)
- Belanger et al. (2005) Belanger, G., et al. 2005, ApJ, in press (astro-ph/0508128)
- Bucciantini, Amato, & Del Zanna (2005) Bucciantini, N., Amato, E., & Del Zanna, L. 2005, A&A, 434, 189
- Chevalier (2000) Chevalier, R. A. 2000, ApJL, 539, 45
- Coker, Pittard, & Kastner (2002) Coker, R. F., Pittard, J. M., & Kastner, J. H. 2002, A&A, 383, 568
- Cordes & Lazio (1997) Cordes, J. M., & Lazio, T. J. 1997, ApJ, 475, 557
- Davidson et al. (1992) Davidson, J. A., et al. 1992, ApJ, 387, 189
- Eisenhauer et al. (2005) Eisenhauer, F., et al. 2005, ApJ, 628, 246
- Gaensler et al. (2004) Gaensler, B. M., et al. 2004, ApJ, 616, 383
- Genzel et al. (2003) Genzel, R., et al. 2003, ApJ, 594, 812
- Gotthelf (2003) Gotthelf, E. V. 2003, ApJ, 291, 361
- Ho et al. (1985) Ho, P. T. P., Jackson, J. M., Barrett, A. H., & Armstrong, J. T. 1985, ApJ, 288, 575
- Krabbe et al. (1995) Krabbe, A., et al. 1995, ApJL, 447, 95
- Lu, Wang, & Lang (2003) Lu, F. J., Wang, Q. D., & Lang, C. C. 2003, AJ, 126, 319
- Maillard et al. (2004) Maillard, J. P., Paumard, T., Stolovy, S. R., & Rigaut, F. 2004, A&A, 423, 155
- Melia & Falcke (2001) Melia, F., & Falcke, H. 2001, ARA&A, 39, 309
- Moderski et al. (2005) Moderski, R., Sikora, M., Coppi, P. S., & Aharonian, F. 2005, MNRAS, 363. 954
- Muno et al. (2003) Muno, M. P., et al. 2003, ApJ, 589, 225
- Muno et al. (2005) Muno, M. P., et al. 2005, ApJ, 633, 228
- Ott, Eckart, & Genzel (1999) Ott, T., Eckart, A., & Genzel, R. 1999, ApJ, 523, 248
- Park et al. (2005) Park, S., et al. 2005, ApJ, 631, 964
- Quataert & Loeb (2005) Quataert, E., & Loeb, A. 2005, ApJ, submitted (astro-ph/0509265)
- Reid et al. (1999) Reid, M. J., Readhead, A. C. S., Vermeulen, R. C., & Treuhaft, R. N. 1999, ApJ, 524, 816
- Roberts & Goss (1993) Roberts, D. A., & Goss, W. M. 1993, ApJS, 86, 133
- Sakano et al. (2003) Sakano, M., Warwick, R. S., Decourchelle, A., & Predehl, P. 2003, MNRAS, 340, 747
- Schödel et al. (2005) Schödel, R., et al. 2002, Nature, 419, 694
- Shukla, Yun, & Scoville (2004) Shukla, H., Yun, M. S., & Scoville, N. Z. 2004, ApJ, 616, 231
- Tan & Draine (2004) Tan, J. C., & Draine, B. T. 2004, ApJ, 606, 296
- van Buren & McCray (1988) van Buren, D., & McCray, R. 1988, ApJL, 329, 93
- van der Swaluw, Downes, & Keegan (2004) van der Swaluw, E., Downes, T. P., & Keegan, R. 2004, A&A, 420, 937
- Wang et al. (1993) Wang, Q. D., Li, Z.-Y., & Begelman, M. C. 1993, Nature, 364, 127
- Wang et al. (2001) Wang, Q. D., Gotthelf, E. V., Chu, Y.-H., & Dickel, J. R. 2001, ApJ, 559, 275
- Wang, Gotthelf, & Lang (2002) Wang, Q. D., Gotthelf, E. V., & Lang, C. C. 2002, Nature, 415, 148
- Wang, Lu, & Lang (2002) Wang, Q. D., Lu, F. J., & Lang, C. C. 2002, ApJ, 581, 1148
- Xu et al. (2005) Xu, Y. D., et al. 2005, ApJ, in press (Astro-ph 0511590)
- Yu & Tremaine (2003) Yu Q., & Tremaine S. 2003, ApJ, 599, 1129