A Deep Radio Survey of A2125 III.
The Cluster Core – Merging and Stripping
Abstract
We use radio, near-IR, optical, and X-ray observations to examine dynamic processes in the central region of the rich galaxy cluster Abell 2125. In addition to the central triple of E and cD galaxies, including members of both major dynamical subsystems identified from a redshift survey, this region features a galaxy showing strong evidence for ongoing gas stripping during a high-velocity passage through the gas in the cluster core. The disk galaxy C153 exhibits a plume stretching toward the cluster center seen in soft X-rays by Chandra, parts of which are also seen in [O II] emission and near-UV continuum light. HST imaging shows a distorted disk, with star-forming knots asymmetrically distributed and remnant spiral structure possibly defined by dust lanes. The stars and ionized gas in its disk are kinematically decoupled, demonstrating that pressure stripping (possibly turbulent as well as ram) must be important, and that tidal disruption is not the only mechanism at work. Comparison of the gas properties seen in the X-ray and optical data on the plume highlight significant and poorly-known features of the history of stripped gas in the intracluster medium which could be clarified through further observations of this system. The nucleus of C153 also hosts an AGN, shown by the weak and distorted extended radio emission and a radio compact core. The unusual strength of the stripping signatures in this instance is likely related to the very high relative velocity of the galaxy with respect to the intracluster medium, during a cluster/cluster merger, and its passage very near the core of the cluster. An additional sign of recent dynamical events is the diffuse starlight asymmetrically placed about the central triple in a cD envelope. Transient and extreme dynamical events as seen in Abell 2125 may be important drivers of galaxy evolution in the cores of rich clusters.
1 Introduction
Progressively richer data in the optical and X-ray have revealed that clusters of galaxies, in addition to being important sites for galaxy evolution, are themselves evolving systems. This is seen in the evidence for cluster mergers, as shown by galaxy position/velocity arrays and substructure in the hot intracluster medium (ICM). Particularly intriguing has been evidence that such events on a cluster-wide scale might affect the individual galaxies, as manifested via star formation, occurrence of nuclear activity, and/or modifications due to the effects of tidal and ram-pressure forces. We have conducted an intensive study of Abell 2125, a cluster of richness class 4 at , originally motivated by fractions of blue galaxies and radio detections which are exceptional for its redshift and richness. As discussed by Miller et al (2004) and Owen et al (2005b) (Paper II), A2125 appears to be a major merger in progress seen close to the line-of-sight. Spatially the two largest galaxy concentrations overlap in projection. Modeling suggests a position angle to the line-of-sight of about 30∘ and that the two systems are within 0.2 Myr of core passage. The projected scale of the full A2125 concentration is about 5 Mpc, making the total extent about 10 Mpc, consistent with a major merger. Most of the radio-detected galaxies are distributed uniformly in projection throughout this region. We argued in Paper II that the radio emission from most of these systems is due to star-formation activity and that these galaxies live in intermediate density environments, more conducive to mergers, interactions, and thus star-formation. The on-going major cluster merger may also be enhancing the galaxy-galaxy interactions in group-like environments we are seeing.
Additional aspects of the cluster merger appear to be active in the richest parts of A2125. The core region has four, fairly luminous radio sources ( W Hz-1). All the evidence which we will present here suggests that, unlike most rich clusters as we currently observe them, a complex interaction is taking place which is the result of the merger of two dense sub-clumps in the A2125 system. Most striking, one of these radio sources arises from a smaller galaxy in the process of losing much of its interstellar medium to the ram pressure of a rapid passage through the densest part of the ICM. We discuss here the optical, radio, and X-ray evidence for this interpretation.
2 Observations
The radio, optical and near-IR imaging are described in more detail in previous papers. These observations include 1) a deep VLA A+B configuration survey (Owen et al, 2005a) (Paper I), 2) deep wide-field imaging in U,B,V,R,I,J,H,K, and two narrow bands at 8010 Å and 9170 Å using the KPNO 2.1m and 4m telescopes (Owen et al, 2005a), 3 ) optical spectroscopy using the KPNO 4m and WIYN telescopes (Owen et al, 1999; Miller et al, 2004), 4) HST imaging in F606W and F814W (Owen et al, 2005b) and 5) a Chandra 82ksec integration (Wang, Owen, & Ledlow, 2004).
Besides these observations, we describe here further VLA radio observations and new GMOS spectroscopy from the GEMINI-N telescope as described below.
2.1 VLA Observations
Besides the 1400 MHz observations, the cluster core was observed in the VLA D configuration on August 28, 2000 at 4860, 8460 and 14940 MHz to determine the radio spectrum of C153. The observations were taken in the standard 50 MHz bandwidth continuum mode for total integration times of 53, 39, and 31 minutes respectively for the three frequencies. Calibrations were performed in the standard way and imaged and cleaned with IMAGR, all in the AIPS package.
2.2 GEMINI GMOS Spectroscopy
Spectra of C153 were obtained during two Gemini-N programs (GN-2002A-Q-15 and GN-2003A-Q-14), using GMOS-N with 1” wide slits. The first observation, using a 5” slit length, was on 12 March 2002 (observation N20020312S0015), giving one 3000-second exposure. The slit was tilted by about 20∘ with respect to the default direction (that is, perpendicular to the dispersion) to follow the galaxy’s projected major axis. The grating R400-G5300 (400 lines per mm, 0.67 A/pixel) was set with a center wavelength near 6300 Å , giving coverage from [O II] to the H region. The small slit length arose from adding this object to a program of identification of faint radio-selected objects.
The later spectrum used a 19” slit length, centered asymmetrically on C153 to accommodate primary targets. This logistical limitation means that the slit did not encompass the plume seen in [O II] emission to the NW of the galaxy disk, a feature that had not been found when the observations were set up. This slit was likewise tilted with respect to the CCD and dispersion, to sample along the major axis. Two 2700-second exposures were done (observation N20030528S0100 and -101) on 28 May 2003. These was centered near 5200 Å , using grating B600-G5303 (600 lines/mm, 0.45 A/pixel) so we cover from short-ward of [O II] (to below 3200 Å in the emitted frame) and red-ward slightly past [O III]. Atmospheric dispersion compensation was not in use for either set of observations (air masses ranged from 1.4-1.6).
Reduction included flat fielding, wavelength mapping using associated CuAr exposures, rebinning of the data to linear and orthogonal spatial and wavelength scales, merging of data from the 3 CCDs, and sky subtraction. Since no flux standard star was observed with the same setups during these sessions, we calibrated the C153 spectrum to at least a relative flux scale by reference to a Kitt Peak 4m observation (Miller et al. 2004) taken with a wide (2”) slit.
3 Results
3.1 Radio/Optical Imaging
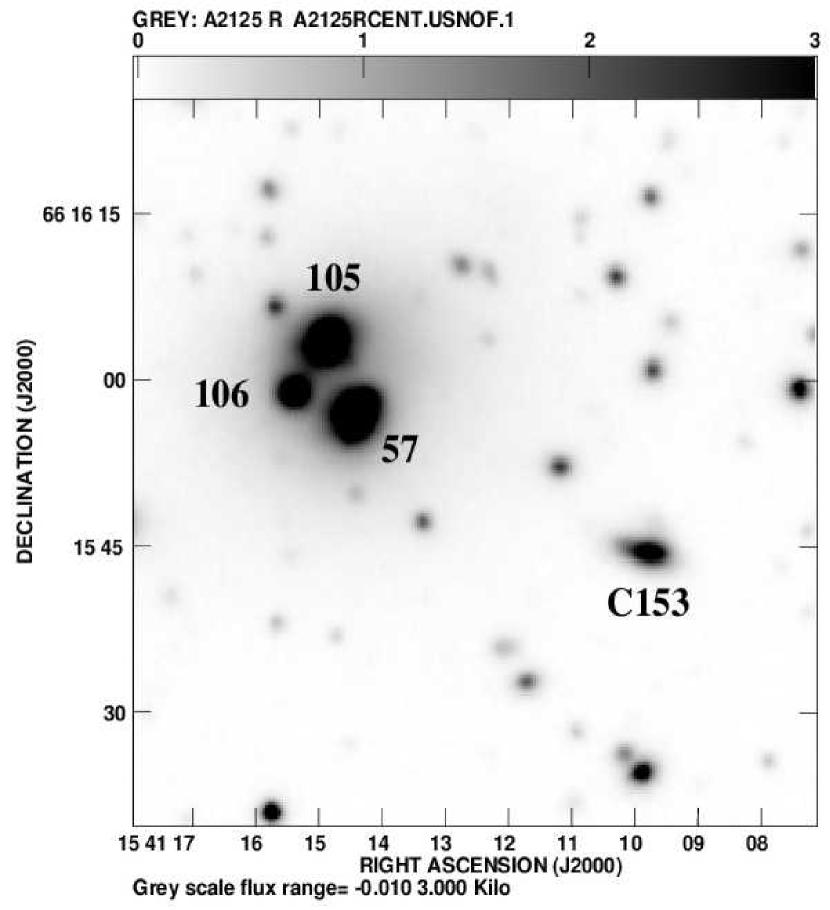
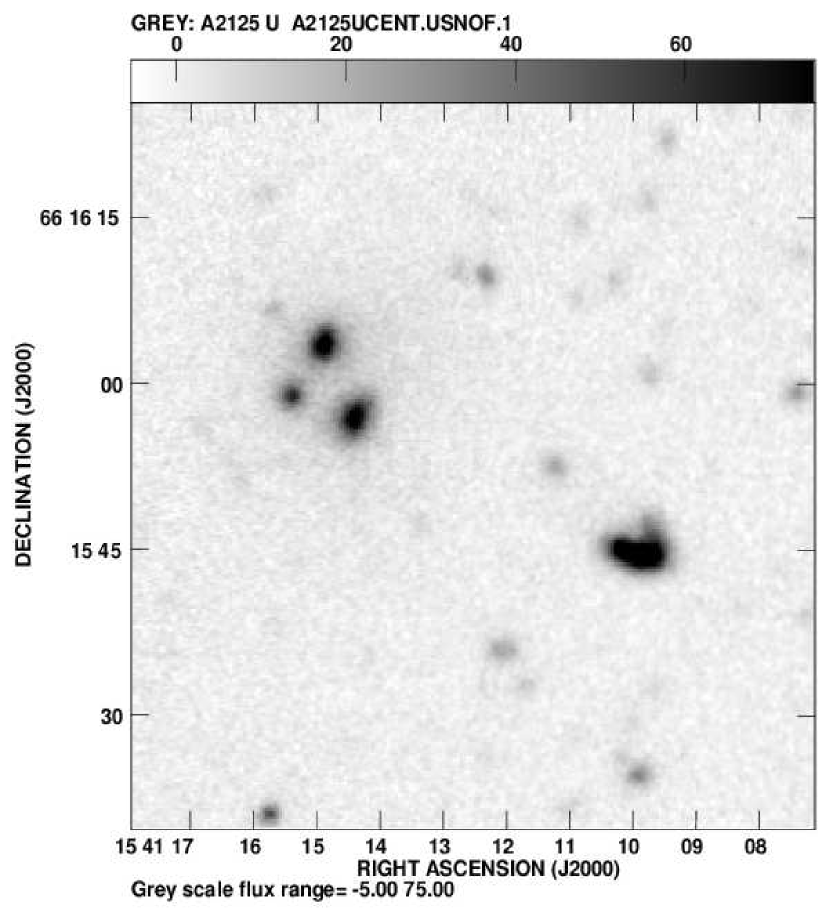
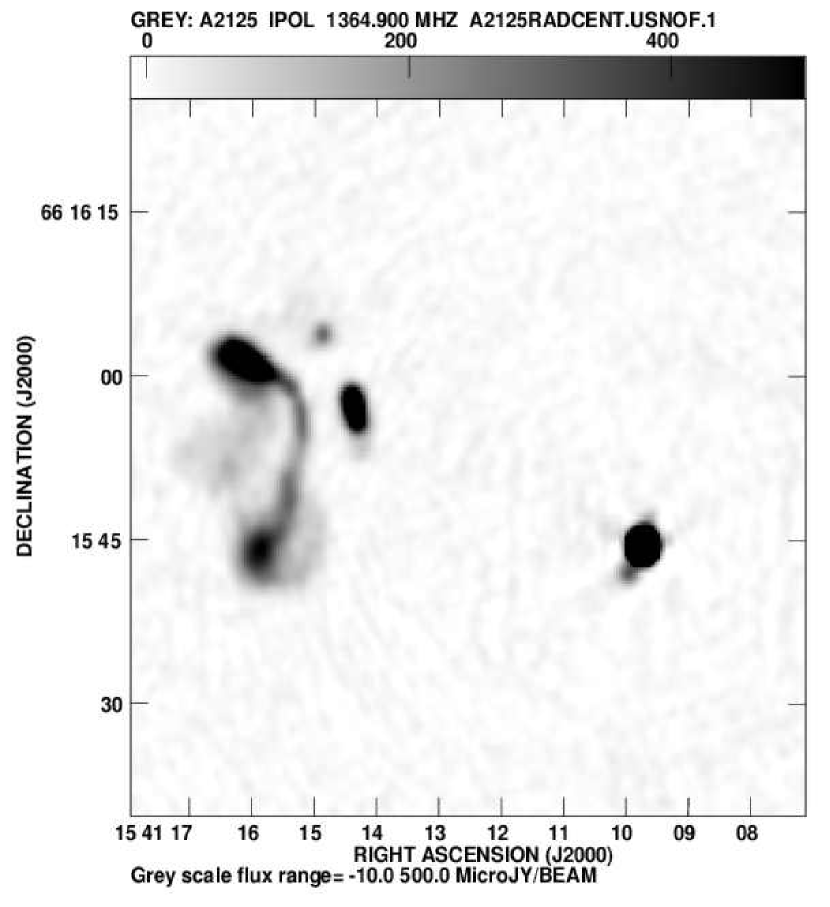
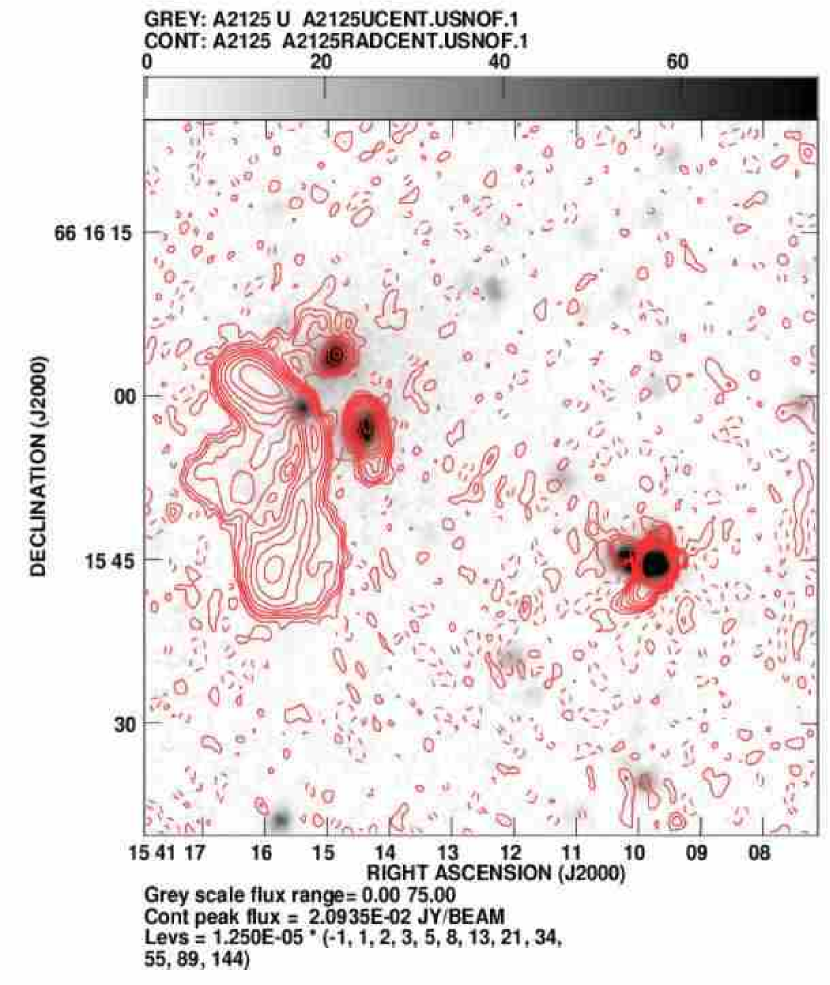
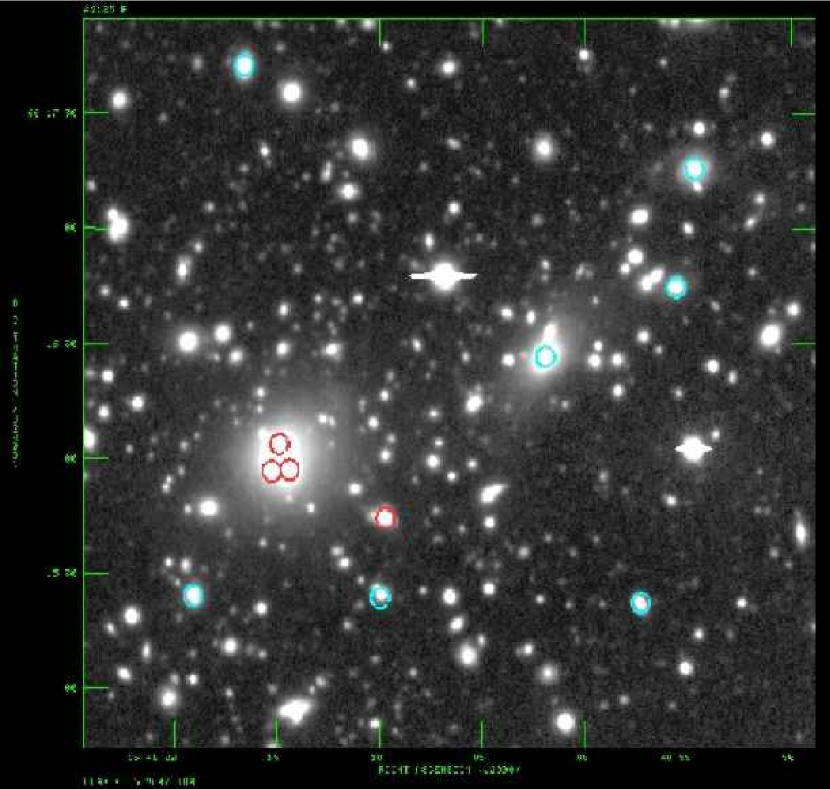
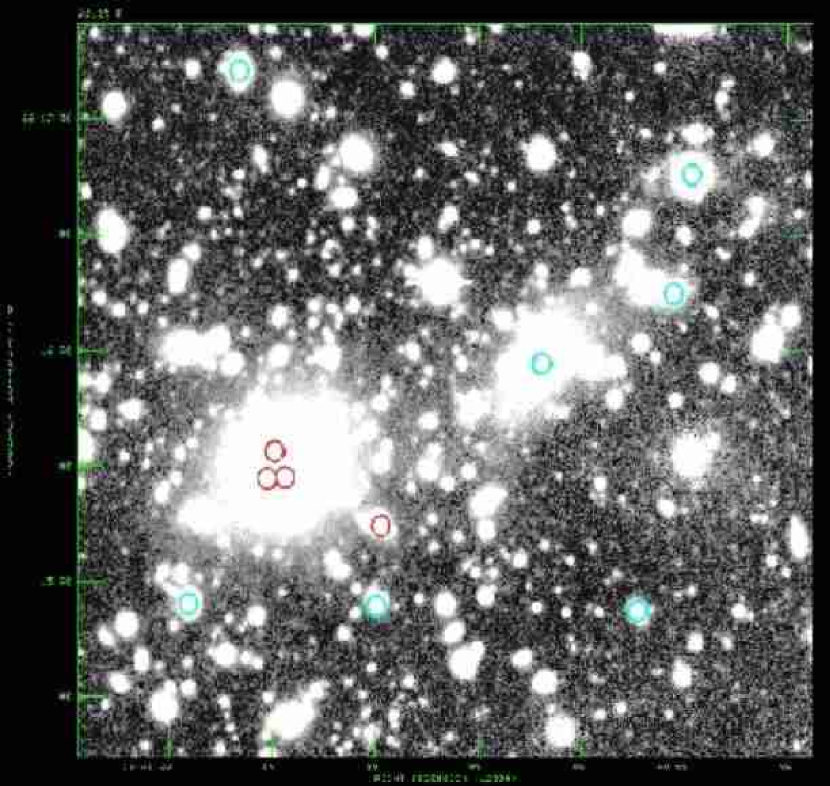
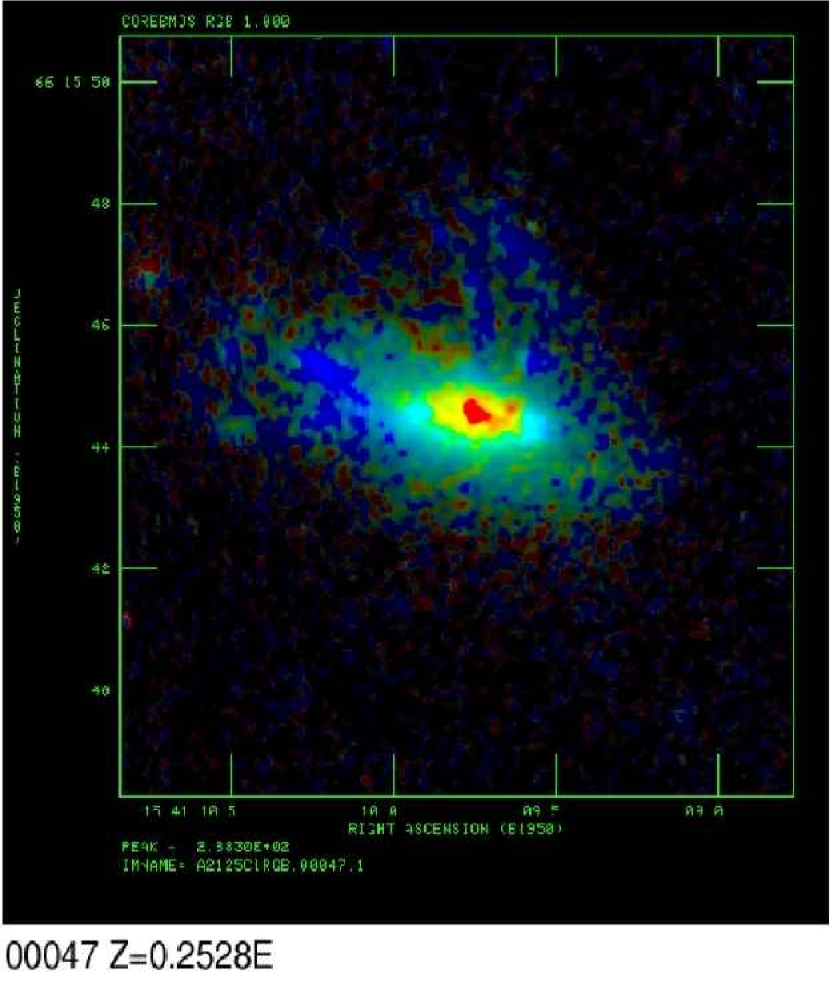
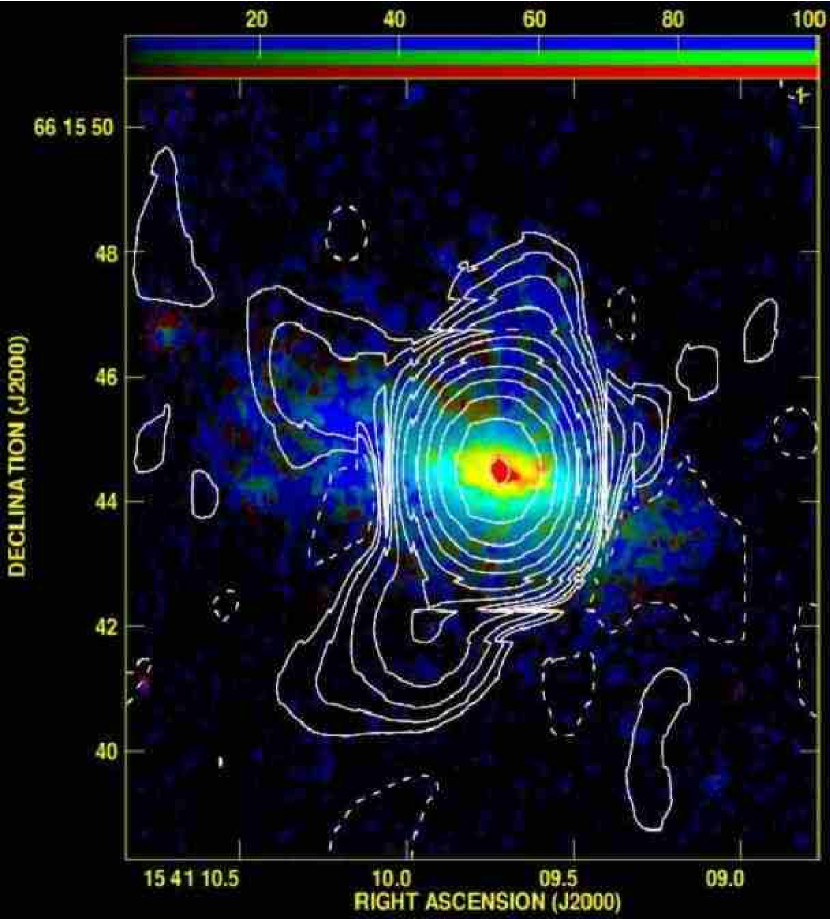
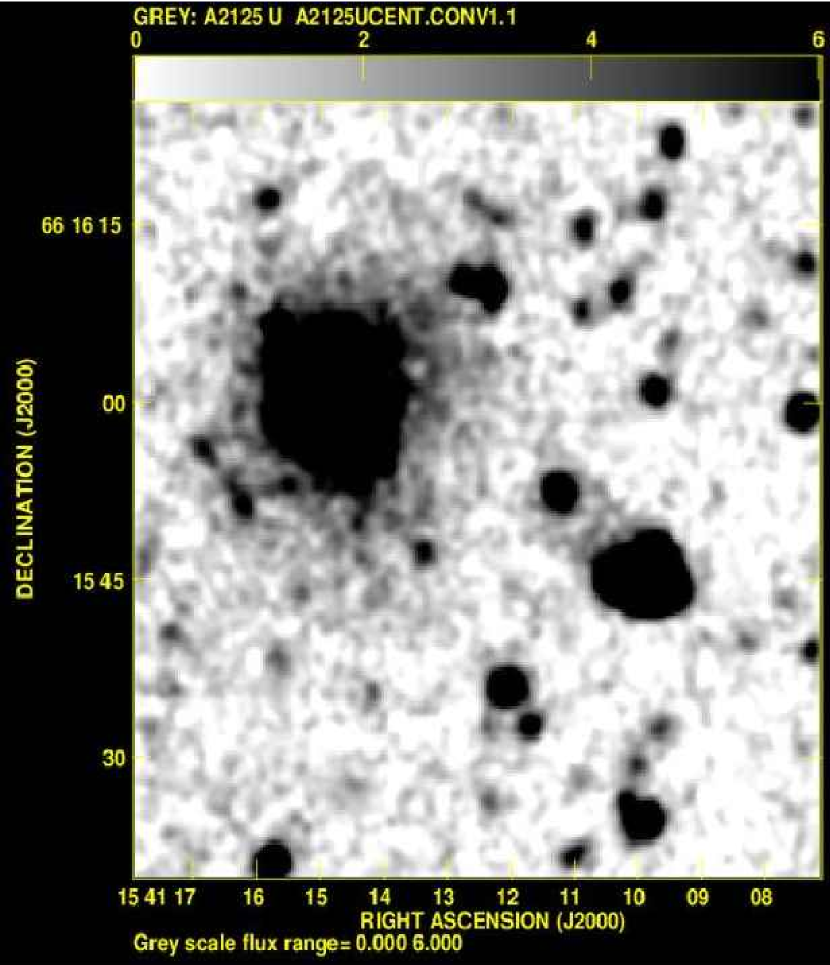
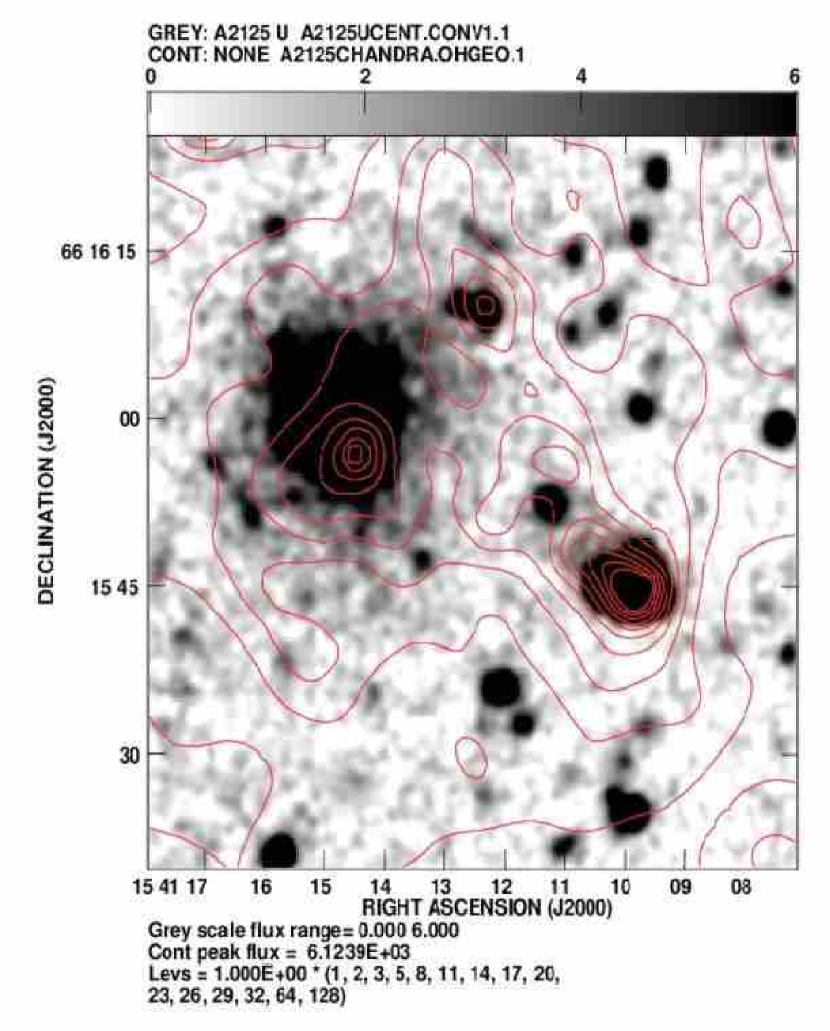
In figure 1, we show the R and U images of the cluster core from the KPNO 4m MOSAIC imaging. The central triple system of the cluster is near (15 41 15, 66 16 00). Also note the galaxy C153 (source 00047 from Paper II), near (15 41 10, 66 15 45); this galaxy will be the subject of much of the discussion in this paper. The central triple of cD galaxies dominates the R image. In contrast, C153 is the brightest object in the field at U. In figure 2, we show the radio image of the same field. Each of the three central galaxies has an extended radio source. However, C153 has the brightest peak, in addition to some extended structure of its own. In figure 3, we show the radio image as contours overlaid on the optical U image. Although C153 is dominated by a point source, note the radio extension along both the galaxy’s major and minor axes. Also note the extended emission associated with each of the three central galaxies and the bent tails associated with the SE galaxy, object 00106.
In table 1, we list some basic properties of the four central galaxies from Paper II, using Gunn-Oke apertures for the optical magnitudes. In columns 1 and 2, we give the source number and coordinate name; in columns 3 and 4, the radio size and luminosity in kpc and log W Hz-1, the absolute magnitude in a Gunn-Oke aperture (radius=13.1 kpc) is given in column 7; Columns 8, 9, 10 give the result of the SED fitting including the spectral type ( continuous star formation, star-burst), the characteristic time since the beginning of the event and the Calzetti extinction. Column 11 gives the redshift (e implies an emission line redshift). Please see paper II for the details. The spectroscopic data for this quadruple system reveals that two of the central galaxies (00105 and 00106) have radial velocities near the peak in the main cluster distribution. However, 00057 (the SW member of the triple) and C153 both have radial velocities about 1400 km/s higher than the other two galaxies, in the velocity range dominated by the less populous secondary cluster component of Paper II. The bent radio source associated with 00106 also is consistent with this system moving at high speed with respect to the surrounding medium.
On a slightly larger scale the cluster shows evidence of complex interactions at low light levels. In figures 4 and 5, we show the R MOSAIC image of the cluster core with two different stretches to show how the lower surface brightness emission relates to the galaxies. Note that the three central galaxies do not lie at the center of the diffuse light. Also note the large halo around the galaxy about two arcmin north and west of the central triple. This galaxy is radio galaxy 00039 and Chandra X-ray source X065. The diffuse X-ray emission of the main cluster also is elongated along a line connecting the central triple and 00039 (Wang, Owen, & Ledlow, 2004). Once again on this larger scale there is evidence of a complex interaction between multiple components of the cluster and a situation not likely to come from a relaxed equilibrium.
As a sanity check on the reality of this diffuse light, given the complex overlapping envelopes of the three central galaxies, we used iterative application of the STSDAS ellipse and bmodel tasks to derive symmetric models for the individual galaxies. This procedure converged to a set of profiles for the galaxies which indicate that the diffuse light must arise from something else - either very strong isophotal distortions of the galaxies or a photometrically distinct component of starlight. The X-ray brightness profile also shows this excess to the northwest (Wang, Owen, & Ledlow, 2004).
The global stellar populations determined from the SEDs also are of interest, tracing broad features of the galaxies’ histories. As listed in Paper II, the broadband SED of C153 fits a continuous star-forming model with an age of 3.5 Gyr and a Calzetti extinction law with an . This system was the only one we found in the cluster that fits this type of model SED. Repeating the fits using smaller aperture sizes, C153 was always best fit by a continuous star-formation model but with somewhat higher extinction and shorter durations ( Gyr). We will examine its star-forming history in more detail below, using GMOS spectroscopy. The other three galaxies all were fit best by single burst models with ages between 5.5 and 9.5 Gyr. Such models basically look like simple old stellar populations, noting that the WMAP consensus cosmology had an age of 10.5 Gyr at . The optical spectra of these three central objects show no emission lines.
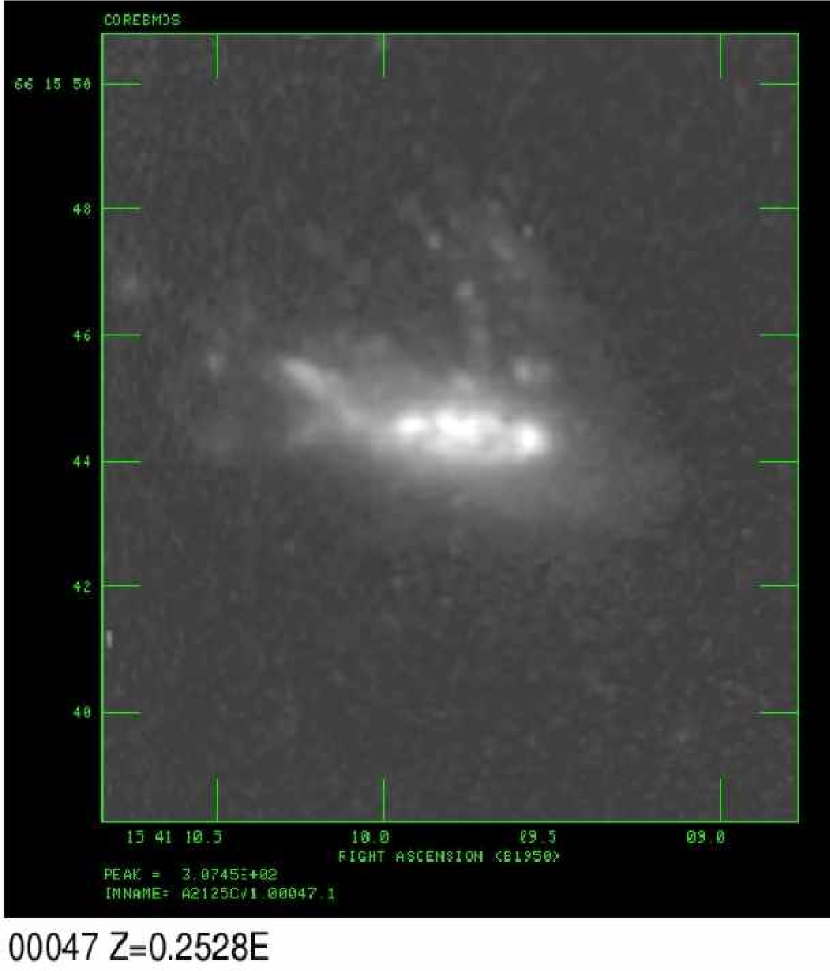
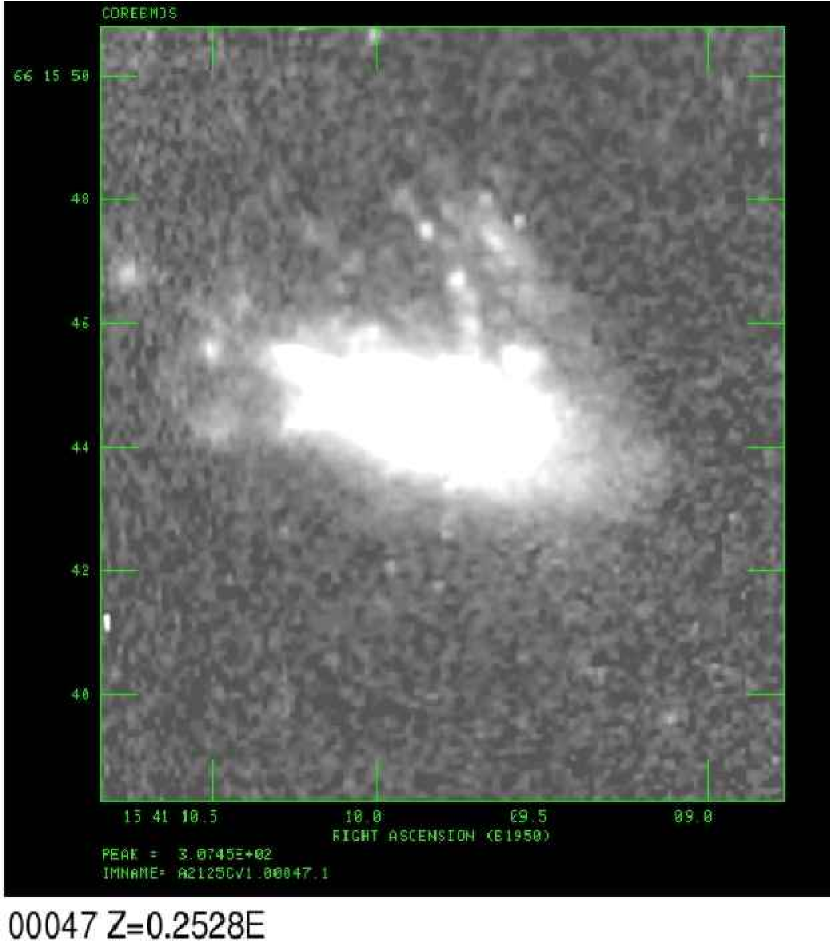
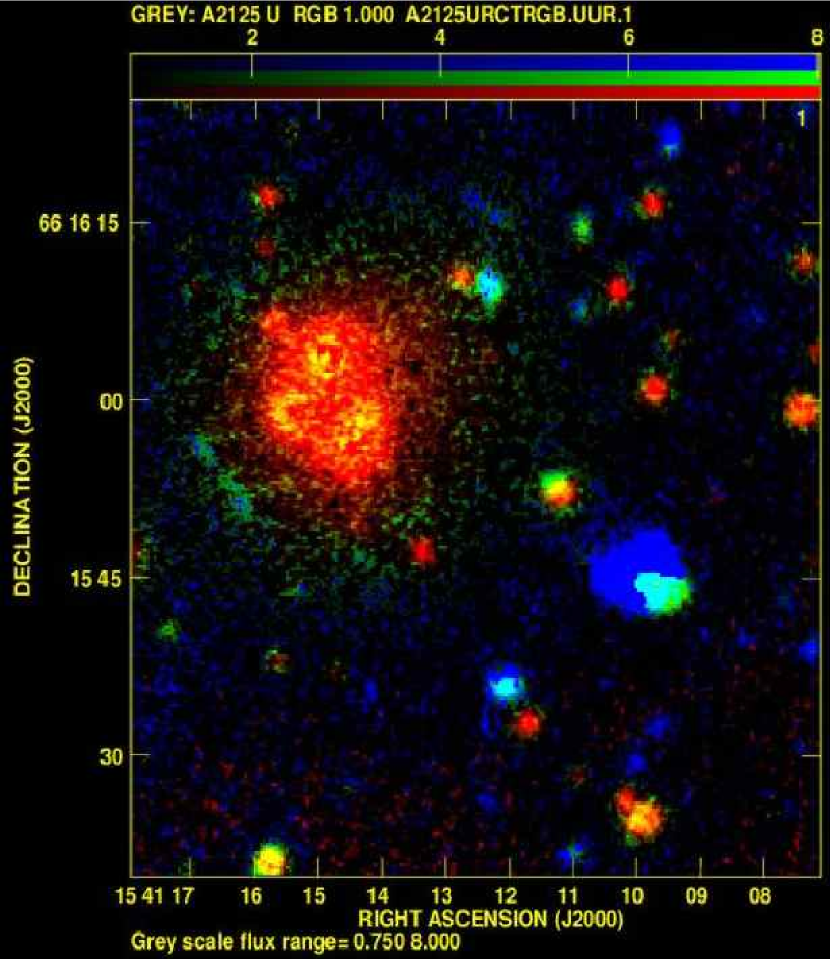
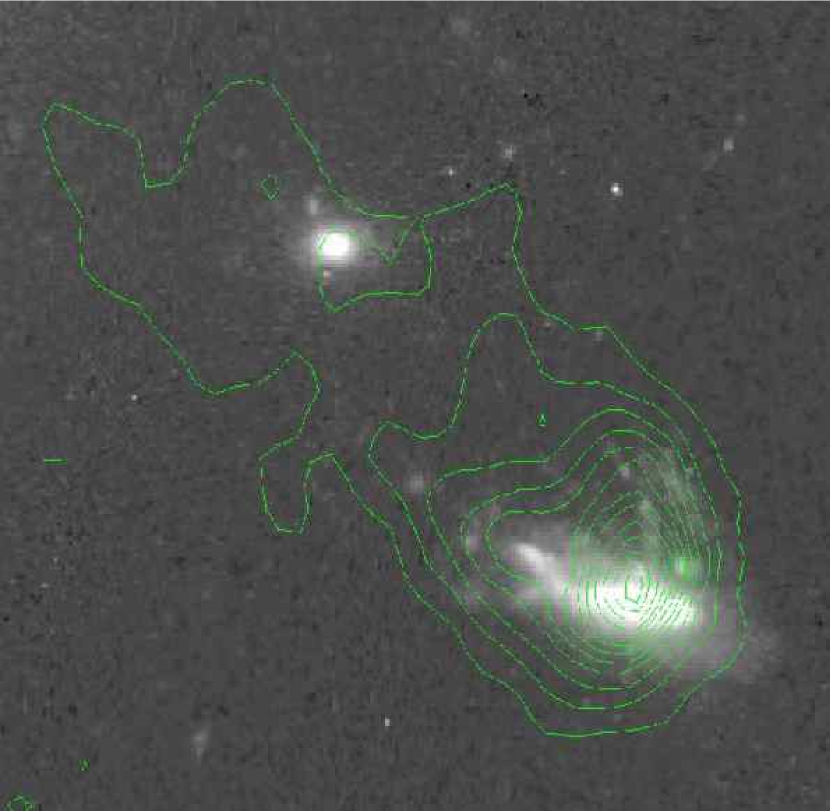
From the ground, C153 appears to be a late type galaxy of some type. However, in figure 6 we show the WFPC2 image of the system. Clearly this system is not a normal galaxy. In figure 7, we show a “true color” image of the system made from the two HST images. The colors seem likely to be primarily due to continuum emission. The observed equivalent widths of emission lines in the core of the galaxy account for 3.2% and 9.8% of light in the F606W and F814W filters respectively. Away from the nucleus where we do not have spectroscopy the percentages could be more significant. The central core of the galaxy is red with respect to the outer more diffuse regions, suggesting dust-obscuration. Thus the galaxy appears to be the combination of a heavily dust-obscured nuclear region along with less obscured blue light from young stars coming from the complex outer region of the system. In figure 8, we show the 1.5 arcsec resolution radio image overlaid on the HST color image. The extended radio emission seems generally aligned with the blue light, except to the south of the nucleus, while the unresolved radio core is coincident with the red nuclear region. In figure 9, we show the U-band image of the region containing the four central objects stretched to show the lower surface brightness emission. One can see a faint broad region of emission extending about 10 arcsec from C153 back toward the central triple. One can also see two approximately linear features near (15 41 16.5, 66 15 53) and (15 41 12.5, 66 16 17) which more or less tangential with respect to the central diffuse emission. In figure 10, we show a “true color” image made from the U and R images of the same region. One can see that these two features are quite blue. It seems possible that these two features are gravitational arcs, especially since the presence of arcs in such low-redshift clusters is correlated with the kinds of substructure expected during mergers (Bartelmann et al., 1995; Allen, 1998; Torri et al., 2004).
As part of our MOSAIC imaging program we found that there was a narrow-band filter (center wavelength 4653 Å, FWHM 52Å) in the KPNO set which was very well matched to [OII] at the redshift of A2125. In figure 11, we show the HST WFPC2 image with contours of the continuum subtracted [OII] image overlaid. Note the the similarity of the U band continuum image in figure 9 and the [OII] image. Also note the northern extension of the [OII] emission aligns with the filamentary structure seen on the HST image. Overall, we see a similar structure in each of the , [O II], and soft X-ray bands - a plume or tail stretching to the northwest from C153, extending at least 80 kpc in projection from the [O II] image, and perhaps stretching, further based on the X-ray image (e.g. figure refX02) to become confused with weaker sources in the cluster. This feature furnishes strong evidence that many of the oddities of C153 are related to an intense episode of ISM stripping.
3.2 Chandra Imaging
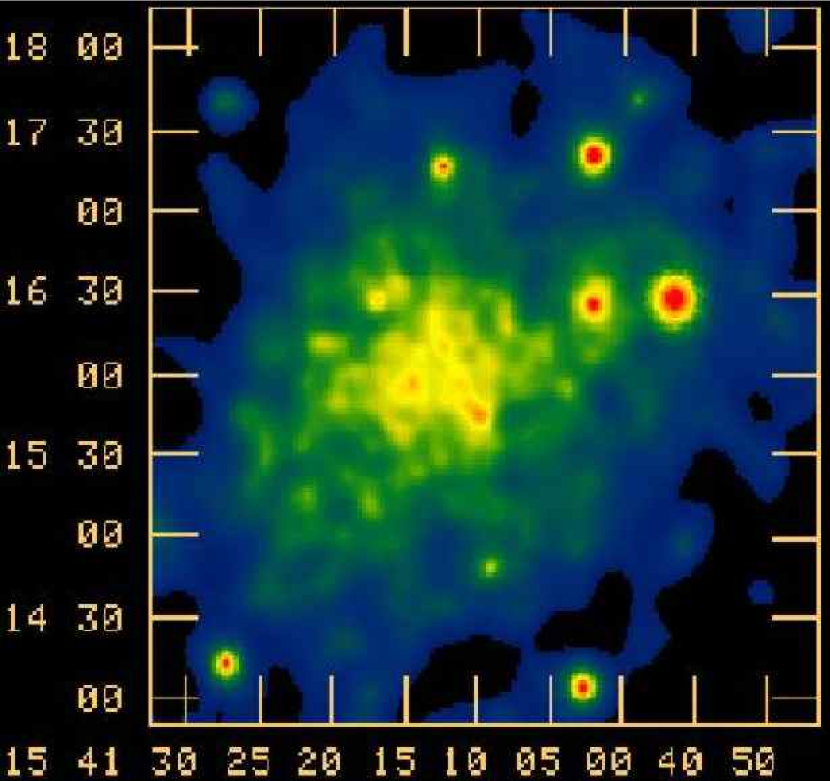
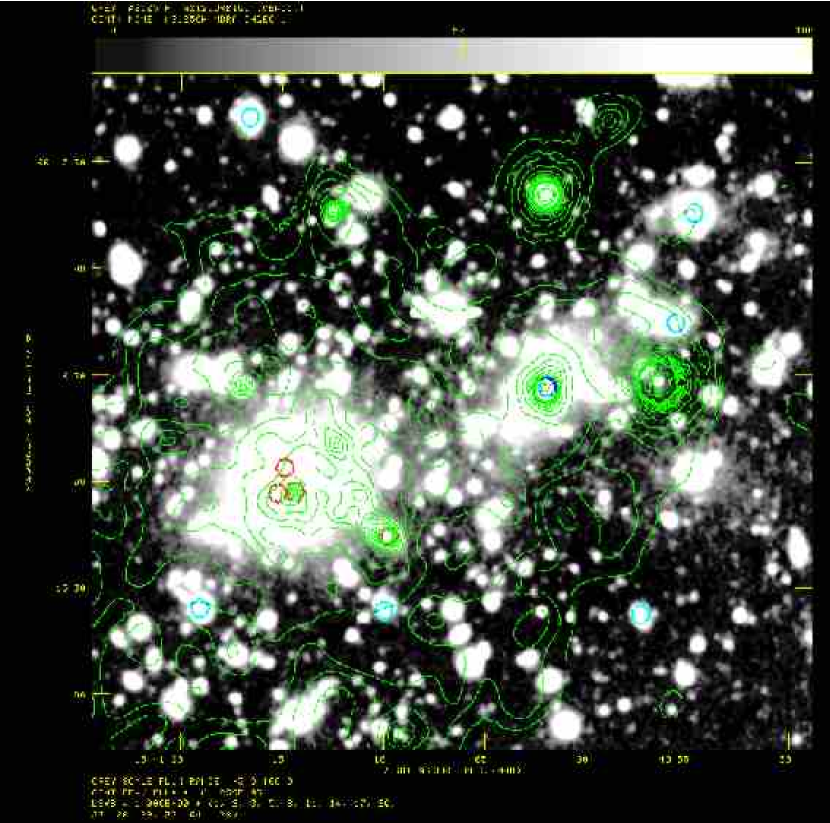
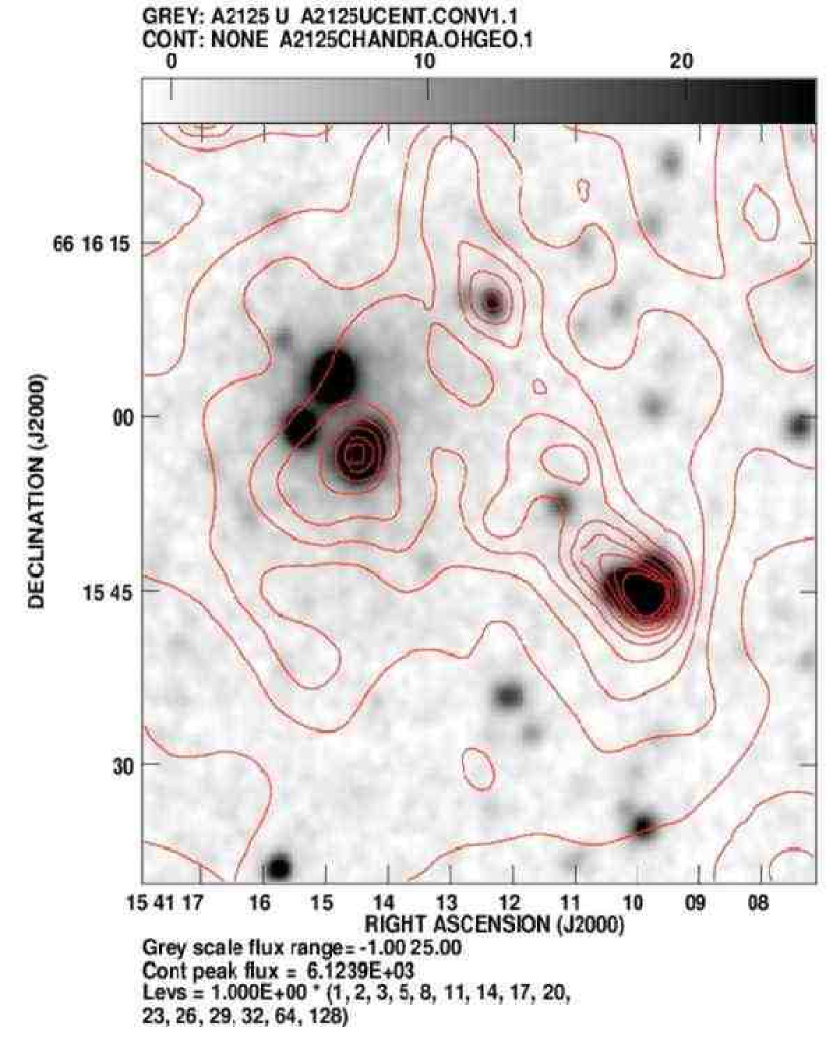
As described in Wang, Owen, & Ledlow (2004), A2125 was observed for 82 ksec by Chandra in 2001. In figure 12, we present the 0.5 to 8 kev Chandra image of the core region. In this image the X-ray core appears both complex and unusual. In figure 13 we display the wider field, R-band image of the cluster core with the X-ray contours overlaid. ne can see the overall association of the X-ray emission with the lower surface brightness R-band emission. In figure 14 we show the U image of the cluster core, with two different transfer functions, with the Chandra image overlaid. From the left hand panel, one can see the general alignment of the X-ray tail of C153 with the diffuse U-band emission (and thus the [OII] emission). The length of the X-ray tail appears to exceed the optical emission. However, in the right hand panel, one can see a faint galaxy near (15 41 11.5, 66 16 14) appears also to coincide with a local peak in the emission. Thus the length of the X-ray tail is at least arcsec or about 80 kpc in projection. From the left hand panel of figure 14 one can also see that the diffuse emission at the core of the cluster is centered on the SW member of the central triple. The two other core galaxies do not obviously have associated X-ray emission.
3.3 C153 GMOS Spectrum
We examined clues to the stellar population in C153, using the spatially integrated GMOS spectrum (covering a region 81 pixels long, or 5.8”, by 1” extended along the major axis). We considered primarily the details of the spectral fit between emitted wavelengths 3200-4200 Å , not only because of the range of diagnostic stellar lines in this region, but to reduce sensitivity to reddening (which changes the weighting of stellar populations) within the spectral range fitted.
3.3.1 Stellar Population
The GMOS spectrum includes numerous stellar absorption lines, especially the high-order Balmer features. Their relative strengths, and the amplitude of the spectral break across the Balmer limit, are sensitive to the mix of stellar ages. The broadband spectral shape from these data is less well determined, relying on secondary information from a KPNO observation with a different slit area and with the accuracy of correction for atmospheric dispersion an issue as well. We take the overall continuum shape, integrated over the system, from large-aperture photometric measures, as fit by hyperz (Bolzonella, Miralles, & Pelló, 2000). As discussed earlier, the best fit to the broad-band magnitudes for a single population from the hyperz library is for continuous star formation. In comparison, the best single-age fit to the GMOS spectral data, using the Starburst99 solar-abundance spectra (Leitherer et al, 1999) ranges from 100-200 Myr depending on how we weight various pieces of the spectrum. The predicted broadband spectral distributions for these two cases are quite similar, as one would expect from the strong weighting of the continuous star-formation case to its youngest constituents.
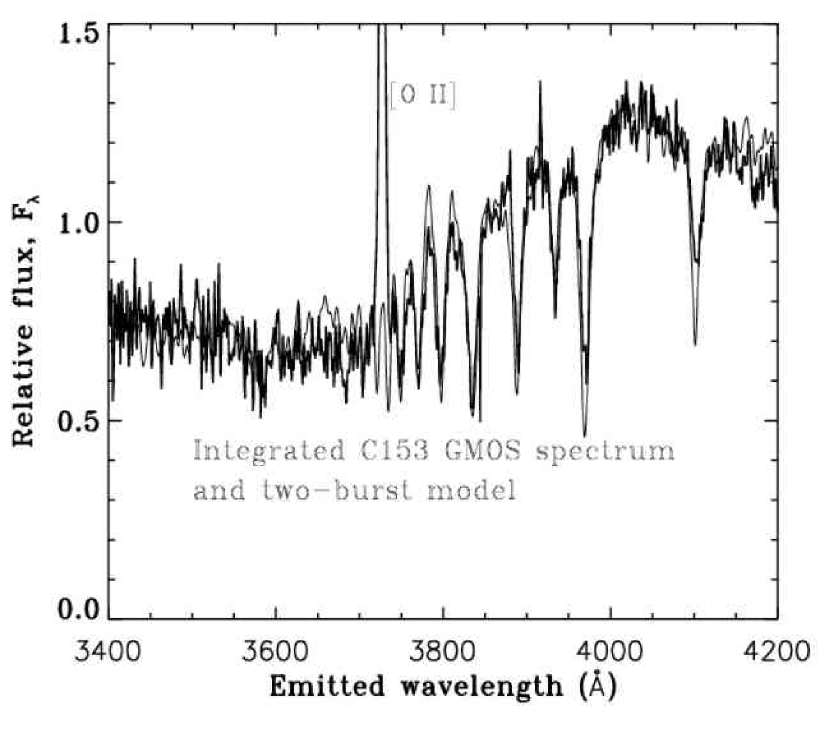
However for the GMOS spectrum, the continuum level between Balmer lines requires a multicomponent population, as all the single-age burst populations and models with continuous star formation give continuum levels here which are too high to match the data by typically 15-20%. In particular, the continuum level just blue-ward of the H+Ca II blend suggests a very diluted 4000-Å break, such as would be produced by a small fraction of the light coming from an older population. To narrow the range of parameters in the two-population fit, we took the old population to have an age of 10 Gyr (based on the age of the Universe at the epoch we observe Abell 2125 - from the WMAP cosmology, this would be 10.5 Gyr). The best fit of such an old population and a younger starburst, over the emitted wavelength range 3500–4200 Å , has a burst of age 100 Myr contributing 90% of the flux just longward of the 4000-Å break (specifically as measured at 4050 Å ). Over such a short wavelength span, its reddening is poorly determined, being better constrained by the broadband continuum shape. In figure 15 we show this fit overlaid on the observed spectrum. This model fits the broadband data as well as the single model from hyperz, with the added feature of fitting the spectral data much more closely. The longest two Balmer lines in this region (H and H) show some filling by emission, which is progressively less important for the higher-order lines (since the emission decrement is steeper than the absorption decrement). The best match between model and data gives an absorption-line redshift , which will be the flux-averaged value along the slit.
In assessing the range of stellar populations that fit the GMOS data, an ordinary analysis is difficult because diagnostic spectral features are concentrated in only a few wavelength ranges, and we must allow for emission components to the Balmer lines and interstellar absorption in, for example Ca II. We have used several kinds of constraint to estimate error ranges. The wings of the Balmer lines, beyond the line widths implied by other emission features, are under-predicted by combinations with less than 0.6–0.9 of the 4050 Å flux arising in a young population (for ages of that population from 100-25 Myr, respectively). A similar but weaker constraint comes from not predicting Ca II stronger than observed; this is another one-sided constraint, since interstellar absorption could strengthen the line independent of the stars’ properties. Fitting across the 3400–4200 Å emitted range, where most of the diagnostic absorption lines are and our flux calibration is most secure, we find that the young population can be no older than 150 Myr or the observed spectrum becomes too blue. Between the Balmer lines H7-10, the continuum level is best reproduced with a modest contribution ( at 4050 Å) from an old population; the constraint is roughly for all the young ages we considered. Putting these together, the young population implied by this model has an age Myr and contributes of the light emitted at 4050 Å.
There is degeneracy between the age and reddening of the young population (even to the extent that a such a simple two-component model is appropriate). However, the continuum slope from 3300–3600 Å(short-ward of the Balmer jump) is so blue that even the youngest burst populations can be reddened by no more than E, assuming a Calzetti et al (2000) effective extinction, without being redder than we observe. This level of extinction applies strictly only to the escaping light; as Witt et al. (1992) stressed, the stars which are most heavily obscured contribute least to the emerging colors. In view of the prominent dust structure seen in the WFPC2 images (e.g. figure 7), we are certainly seeing only those stars which are behind the smallest levels of extinction.
This model suggests that C153 is brighter now by a factor at 4050 Å than it was before the onset of this star-formation episode. In our model this episode has largely subsided, since the strong Balmer absorption lines require a dropping star-formation rate over much of the last years. Of course, given the apparent large extinctions in the core of the galaxy, the single slit position we have analyzed, and the relative simplicity of our model, the most important point is that we see evidence of star-formation activity on the time-scale of years. This year scale is interesting, being comparable to the crossing time we infer for this galaxy across the core ICM.
3.3.2 Emission Line Ratios
To examine the energy sources powering the emission-line gas which is prominent in our optical spectra, we have measured emission-line ratios point-by-point along the slit for each spectrum. For the spectral region covered in the higher-quality blue exposure, we have subtracted a stellar population spectrum based on the best fit two-component model above, to minimize the effects of underlying features from the starlight. Most line ratios show radial gradients; given the seeing-limited resolution of these data, such gradients might result from mixing of light from a core and surrounding regions, as well as reflecting a more continuous change in conditions. In the classification diagrams of Veilleux & Osterbrock (1987), most of the regions we see fall among the LINERS but near the higher-ionization edge and toward the “transition” region which occurs when AGN and starburst spectra are mixed. The ratios change as one moves outward from the core in the sense that [O II]/[O III], [S II]/H, and [O I]/H increase while [O II]/H and [N II]/H decrease. With [N II]/H=1.1, [O III]/H=4.4, and [O I]/H=0.13, the core spectrum would typically be classified as a reddened Sy 2, since the FWHM linewidth (from H, where multiple structure is least important) is about 350 km s-1. Some of the line ratios approach values typical of star-forming regions away from the nucleus (such as [N II]/H), but [O I] is too strong all across the galaxy to be accounted for solely by ordinary H II regions. The Balmer decrement H/H reaches 10 at the center, declining to nearly its recombination value at the edge of detected emission.
The [Ne III] lines at 3889, 3969 Å are detected near the edge of the galaxy, although blended with Balmer lines so their intensities are not precisely known (but near 0.15 of [O II]). These lines may be observed at strengths including the values we observe in both AGN and starburst systems. However, we do not detect [Ne V] 3426, at the core or elsewhere, which would be a clear sign of AGN photoionization, to a limit about 0.05 of [O II]. We are left with the implication that ordinary star formation is not the dominant source of ionization for the gas in C153. There may well be a reddened contribution from an AGN, and the strong [O I] and [S II] far from the core could implicate shock ionization as well.
The multiple kinematic components seen in some lines (especially [O III]), which is strong and unblended) mean that all emission lines are likely to be blends of multiple zones along the line of sight, in which we do not have sufficient signal-to-noise ratio to constrain the contributions from various velocities. This makes us reluctant to interpret the line ratios in any greater detail.
3.3.3 Velocity Field
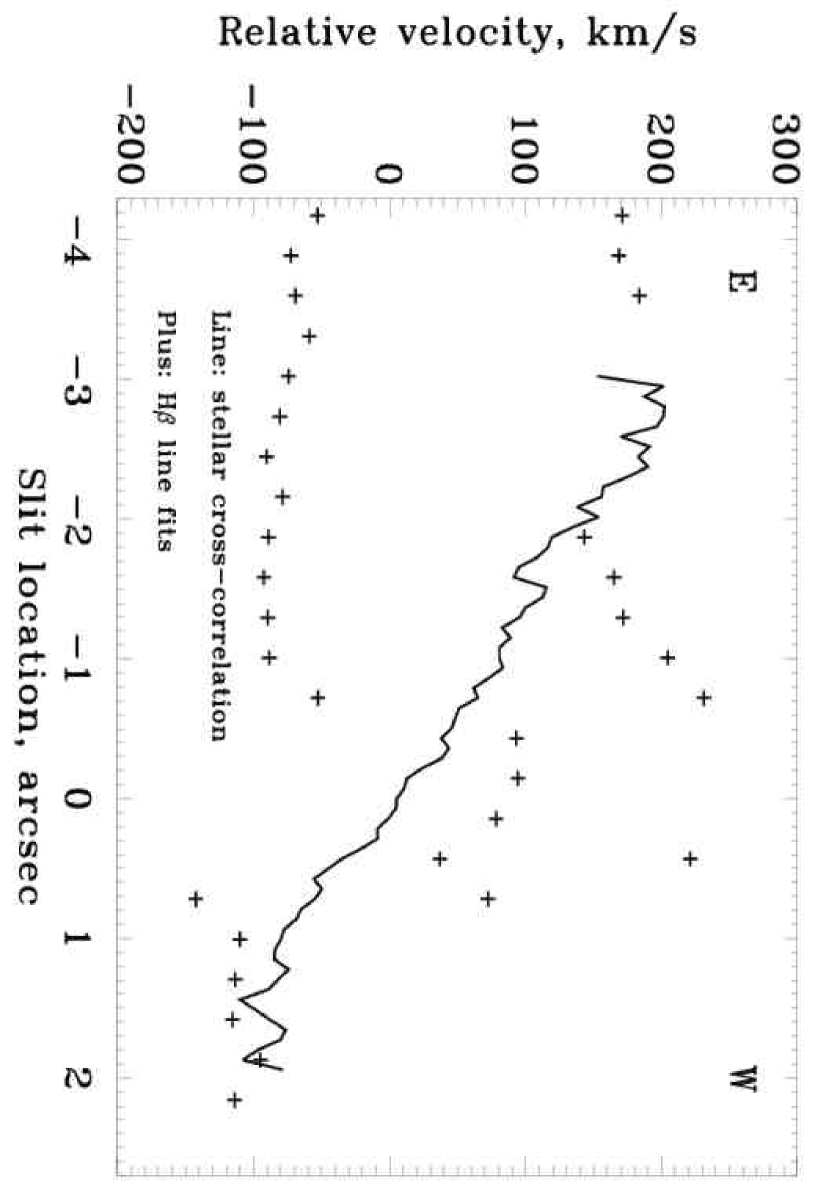
We have evaluated the velocity structure of stars and emission-line gas along the major axis of C153, as sampled by the GMOS spectra. For the stars, we cross-correlated the peak spectrum with slices along the slit, using the IRAF task fxcor. The result (figure 16) shows a nearly linear position-velocity slice (noting that the seeing for the Gemini data may have smeared away any small-scale rise in velocity near the core). The full velocity range we see is 300 km s-1 in the emitted frame, with the galaxy’s eastern edge receding. The data span is truncated on the eastern end by the edge of the slit, rather than by signal-to-noise considerations.
The emission-line profiles are complex, with multiple components in some locations. The cleanest results come from H, since both line blending and residual telluric absorption affect measurements of H and [N II], while [O III] is weaker. The results are shown with the absorption-line data, in figure 16. The actual structure may be still more complex than the two components we measure along some parts of the slit; the line profiles are not completely fit by our pairs-of-Gaussians approach, but anything more complicated risks becoming very strongly model-dependent.
We see regions in which the gas roughly follows the stellar velocities (such as the area just E of the nucleus, and another one 1-2” W) but additional components appear decoupled from the stars. Low gas velocities persist from 1-4” east of the core, and very high velocities are seen ” east. These components may be loosely described as counter-rotating, but this may be misleading since we do not know that this gas is confined to the disk, or indeed still bound to the galaxy. Such velocity structures could arise during stripping events either as departing gas is decelerated to the ICM frame, a process that we view from a poorly-constrained direction in this instance. Alternatively, we could be seeing some of the stripped gas falling back onto the galaxy, as occurs in the simulations by, for example, Vollmer et al (2001) and Schulz & Struck (2001). The GMOS spectrum does not extend far enough to the east (along the “tail” of ionized and X-ray gas) to show whether we do see gas reaching the local ICM frame at a velocity offset of km s-1 from C153; the velocity range projected against the disk is comparable to the maximum circular velocity.
3.4 C153 nucleus: star-formation or AGN ?
In Owen et al (1999) we argued that C153 was an AGN from its optical spectrum and the very large implied SFR from the radio. It also seemed likely that the radio nucleus is quite compact, more consistent with an AGN. For such a source one might expect the nuclear spectrum to be flat or inverted, indicating a very small optically thick radio AGN. However, from Gaussian fits using JMFIT in AIPS to our VLA D configuration radio images, we measure flux densities of , and mJy at 4860, 8460 and 14940 MHz. From Paper II, we found a 1400 MHz total flux density for C153 of mJy. These results suggest a steep, optically thin radio core with a spectral index, of about 0.83, between 15 and 5 GHz. The spectrum then steepens a bit to 0.96 between 5 and 1.4 GHz. At 1400 MHz about 95% of the flux density was in a compact core while 5% was extended over about 14 arcseconds. While the combination of extended and compact emission confuse slightly our knowledge of the spectrum of the core of C153 alone, it is clear that the nuclear spectrum must be a fairly normal optically thin synchrotron spectrum.
The Chandra X-ray observations do not detect the nucleus as a point-like X-ray source. Using the 2 to 8 keV spectral range, which is not confused by the lower temperature emission from the diffuse tail, we can set a three sigma upper limit is ergs s-1 for the 0.5 to 8 kev spectral range. Thus there is no evidence for an AGN from X-rays.
If we interpret the nucleus as star-formation we can use the radio detection and X-ray limits to estimate the SFR, using the methods described in Paper II, which result in equations 1 and 2 in that paper. These equations are based on the calibration of the radio and X-ray luminosities for local star-forming galaxies in terms of a SFR. If star-formation were responsible for the radio luminosity, then we would expect these two estimates of the SFR to give similar results. The radio estimate gives a SFR of 390 M☉ yr-1 while the X-ray estimate gives M☉ yr-1. Although both relations allow for some scatter about the fitted relations, these results are inconsistent with each other and, along with the emission line strengths discussed by (Owen et al, 1999), suggest that star-formation is unlikely to be the origin of most of the radio emission.
Given the GMOS results discussed above, the nucleus of C153 seems most consistent with a heavily obscured, X-ray weak AGN. Certainly, in this case it is possible that we are looking at a very Compton thick environment around the nucleus of C153 which is hiding the X-ray AGN emission. The very large HI optical depth seen against the nucleus of (Dwarakanath & Owen, 1999) is certainly consistent with such a picture. However, the radio nucleus is optically thin, suggesting that higher resolution observation might well reveal a resolved jet.
4 Discussion
4.1 Violent Galaxy Stripping during a Cluster Merger
From the radio and optical data, the galaxy C153 stands out as an unusual system. The galaxy appears to have undergone a major disturbance. From the radio perspective, the galaxy appears to be an AGN based on the compact core and its radio luminosity. However, the optical spectrum show both indications of weak AGN and star-formation activity. The alignment of some of the fainter diffuse radio emission with the blue light from the galaxy is also consistent with star-formation activity. The SED fitting is consistent with star formation activity of the last years. Clearly some very unusual event is taking place in this galaxy.
The alignment of the emission from C153 is also suggestive of an interaction with the cluster core. The elongated tail of optical, [O II] and radio emission appears to point back to the cluster core. Of course, C153 could just be an outlying member of A2125 seen in projection and the alignment could be chance. In this case, C153 might be a galaxy in the outskirts of the cluster which has undergone a major galaxy-galaxy merger. However, the close proximity of C153 to the central triple, along with the apparent alignment of the system with the cluster core and the tail of bright X-ray and optical emission suggests that the galaxy is probably near the cluster core. Two mechanisms seem likely to account for the peculiar galaxy. First a close passage to the massive cluster core would tidally heat and disrupt a smaller galaxy (Henriksen & Byrd, 1996; Gnedin, 2003). Second, such a close passage through a moderately dense cluster IGM would strip much of the ISM from the unfortunate galaxy (e.g. Acreman et al, 2003).
Another piece of the puzzle is the relative velocities of C153 and the central triple system. This pattern, unless it is a very unlikely projection effect, suggests a complex three or four body interaction. Miller et al (2004) show that the dynamics of the A2125 are consistent with a major cluster-cluster merger seen in our line-of-sight which is near core passage. The radial velocity of both 00057 and C153 are consistent with the higher velocity component of the cluster-cluster merger, while 00105 and 00106 appear to be part of the lower velocity component. Thus it seems possible that the activity in the core of A2125 is due to the merger of two major subclumps in the A2125 cluster-cluster merger.
On the somewhat large scale shown in figures 4, 5 and 12, the X-ray and radio galaxy, 00039, with the large optical halo to the west of the cluster core has a radial velocity consistent with the main cluster system and the 00105/00106 pair. However, the peak of the central diffuse X-ray emission is centered on 00057. Furthermore, the diffuse light is not centered of the central triple but is offset toward 00057, suggesting a system not yet in equilibrium. Thus it would be very interesting to know the velocity field of the central diffuse light. The overall pattern we see in this cluster suggests a cluster-cluster merger taking place along a major filament. Besides this large scale pattern, the interaction seems to be manifesting itself as a number of smaller scale events in the apparent core of the cluster.
C153 itself is very unusual. It has the brightest compact radio source in the cluster. Its radio luminosity seems much too high to be due to star-formation. The line ratios from the 4m spectrum are most consistent with a weak AGN (Owen et al, 1999). However, its almost total lack of a 4000Å break, its optical/NIR SED, and the optical images suggest active star-formation. The “flying fish” appearance of the HST images suggest that something special has happened to C153. The X-ray emitting tail also is far from the norm. This feature is hard to understand if the galaxy is not moving at high velocity through a relatively dense external medium. Thus it seems likely that we are seeing C153 at some special point in its evolution. There are many processes which might contribute to the phenomena we observe.
Given the peculiar radial velocity field of C153 and the central triple, it seems quite possible that some complex interaction has occurred recently among these four galaxies. If the matter responsible for the dominant potential near the cluster core is near that of the dominant component seen by Miller et al (2004), then C153 has a large radial velocity relative to this system (at least 1400 km/s, perhaps much greater depending on its transverse motion). However, the X-ray tail suggests significant velocity in the plane of the sky as well. Thus the total velocity of C153 appears to be large with respect to the sound speed, km s-1 (Wang, Owen, & Ledlow, 2004), perhaps Mach 4.
If the cluster core has a potential like most lensing systems, C153 will have experienced significant tidal acceleration during its core passage (Henriksen & Byrd, 1996). If the linear blue features seen near the cluster are gravitational arcs, then we have direct evidence of such a potential. If C153 plunged quite close to the central mass concentration of the main component of Abell 2125, this encounter would have driven a strong tidal impulse on its disk. Because its velocity relative to the cluster is much higher than its rotational velocity, such a tidal effect would be impulsive, producing a stretching force within the disk (Henriksen & Byrd, 1996); a strongly peaked potential may in fact drive up the rate of star formation through lateral compression of the disk and accompanying changes in the rate of cloud collisions within the disk. Interstellar matter pulled outward by tidal effects would also become more vulnerable to ram-pressure removal. If C153 has a velocity in the plane of the sky of 1400 km s-1 and has passed near the cluster core then years may have passed since core passage. Thus C153 has had plenty of time to experience increased mass loss from evolving stars into its ISM due to increased star formation.
Stripping of C153’s ISM is the most obvious origin of the X-ray tail of C153. Several authors have numerically modeled the stripping expected for the case of a spherical galaxy falling into a cluster numerically (e.g. Gaetz, Salpeter, & Shaviv (1987); Balsara, Livio, & O’Dea (1994); Stevens, Acreman, & Ponman (1999); Acreman et al (2003)). Given C153’s relatively modest mass based on its rotation curve, its optical luminosity below and its linear size, the X-ray luminosity of erg s-1 is rather high compared with the simulation of Acreman et al (2003). However, the velocity of C153 relative to the external medium appears higher than was modeled. Also the size of the unstripped region may be larger due to the higher SFR and thus the internal mass loss rate. C153 appears to have a much more elongated potential based on its optical isophotes but in our ground-based K-band imaging, the galaxy appears rounder; thus the galaxy’s cross-section is uncertain. Higher resolution NIR imaging would help us understand the galaxy’s underlying potential. Also C153’s current trajectory may have originated from a much more violent event than has been assumed in the models. Thus how the details of the C153 encounter relate to the models is uncertain. However, we can use them as a guide to get some idea of what might be expected and how C153 needs to be different to fit the physical picture.
As can be seen in the simulation of Balsara, Livio, & O’Dea (1994), the velocity of material as it is stripped from the galaxy is much smaller than that of the galaxy through the IGM. Furthermore, the flow is unstable both as it originates from the galaxy and at the boundary of the flow where Kelvin-Helmholtz instabilities are important. In these regions conditions may be right for the formation of stars.
At the “leading edge” of the disk, the GMOS spectrum suggests that star formation has shut down at the observed epoch since these regions lack emission-line gas. Gas removal by stripping of C153 may be responsible. The velocity structure we see in the emission-line gas shows enough complexity to fit either with the episodic stripping from disks seen in the models by Vollmer et al (2001), or by some of the stripped gas falling back into the disk (as seen in the same models). We can make only very crude estimates of the mass we see in gas in the stripped tail or plume. For very rough guesses of the density ( cm-3) in the [O II] region (and for solar oxygen abundance), the mass of gas in this structure is about solar masses. Still lower densities give larger masses. The mass in this volume of the X-ray tail is likely to be several times larger.
In contrast to much of the galaxy disk itself, we do see evidence for recent or ongoing star formation in the stripped material. Luminous blue knots are seen on the “downstream” side, and the rest-frame, near-UV surface brightness of the plume (e.g. figures 6,7) is difficult to explain unless it contains stars so young that they must have been formed after the gas left the galaxy. Stripped gas will be subjected to multiple and competing physical effects whose interplay has yet to be properly understood (and for which C153 should prove to be a valuable test case). In particular, the observations of both optical line emission and X-rays from the stripped region may make it possible to address the thermal history of stripped gas. There could be a role for the ablation of dense clouds by thermal conduction from the ICM, while the density increase would make an interface cool the ICM efficiently; magnetic effects could further complicate the behavior by introducing positional and directional dependences in how efficient these processes are.
The event we have described suggests such a close passage to the nucleus of a rich cluster could be one of the ways cluster galaxies change their morphology. It seems likely that C153 will eventually settle down to look more like an ordinary galaxy, perhaps an elliptical. Given the short timescale ( years) for the event, we would only rarely expect to catch such an event in the act. As we argued in Paper II, a cluster-cluster merger near core passage may be a special time for galaxy evolution and C153 may be another way that accelerated evolution can occur.
The unusually high velocity of C153’s plunge through the densest part of Abell 2125 lets us see the results of ram pressure in an unusually pure way, and offers the possibility that further kinematics observations can exploit the implicit mapping between location and time in the stripped tail to further probe the history of gas after leaving the galaxy. This system embodies in an extreme form processes that are likely to have influenced the evolution of many cluster members in more subtle ways.
4.2 A Toy Model
We can consider two pieces of the physical picture we have for C153 in more detail: 1) the tidal effects of the close passage to to the cluster center and 2) the stripping process.
4.2.1 Assumptions
The outermost part of the GMOS velocity slice are consistent with a mass for C153 within 12 kpc of M☉, assuming a thin rotating disk. We assume that the blue features in figure 10 are gravitational arcs; then we can derive the mass within 65 kpc of the cluster core in projection is M☉ (Narayan & Bartelmann, 1996). Conveniently, these values are consistent with the parameters assumed by Henriksen & Byrd (1996) for potential a) as well as the mass of the galaxy they consider. Given that C153 has a relatively long tail as seem in the plane of the sky and a large velocity offset from the cluster mean, we assume that the galaxy is moving at an angle to the line-of-site of 45°, giving a velocity to the cluster of km sec-1. This velocity results in a time to cross a kpc cluster core radius (Wang, Owen, & Ledlow, 2004) of years.
4.2.2 Tidal Effects
As observed C153 is about 100 kpc from the cluster core in projection. If this distance is approximately the distance of the galaxy’s closest approach to the cluster core, then figures 2 and 3 of Henriksen & Byrd (1996) shows that at this point in its orbit the transverse and radial tidal acceleration dominates over C153’s internal forces by a factor and respectively. Thus the tidal acceleration dominates the internal forces and the galaxy should be strongly disturbed and we should expect the SFR rate to be stimulated. However, the timescale of these large forces with respect to a galactic rotation of C153 is short, so the effect of the these forces should be relatively local in the galaxy.
Given the timescales involved, we would expect increased mass loss from the evolving stellar populations to replenish the galaxy’s ISM and provide a continuous supply of gas to be stripped. The spectral modeling suggests that the bulk of the star-formation activity happended within the last years perhaps while C153 was at an optimal point for the tidal effects to have their maximal affect.
4.2.3 Stripping
We can use the simple formalism from Jones & Owen (1979) to evaluate what might be implied about the galaxy from the stripping we observe under our assumptions and assuming simple spherical geometry for C153’s ISM. Instead of mass-loss rates from old stellar populations, we generalize their results using the results summarized by Veilleux et al (2005) where the mass-loss rates are taken from the STARBURST99 models (Leitherer et al, 1999). Using equation 4 from Jones & Owen (1979) and assuming mass-loss-rates we estimate the stagnation radius, roughly the radius of the tail just behind the galaxy, to be
where the S is the SFR measured in solar masses per year, is the galaxy’s effective velocity dispersion in 1000 km s-1 , is the IGM density in units of particles cm-3, and is the galaxy’s velocity relative to the IGM in units of 1000 km s-1. We can roughly estimate from the HST image and the group-based [OII] and U-band images to be about 12kpc. With , at 100kpc from the cluster core (Wang, Owen, & Ledlow, 2004), and , we get that the needed SFR would be about 50 yr-1. However, the pressure at the ISM/IGM boundary could also be affected by the excess energy in the mass-loss outflows and/or by any AGN mechanical energy. Thus a lower SFR is certainly possible, especially if the AGN is an important part of the process. Also from Jones & Owen (1979), the e-folding time for our model galaxy to lose its ISM is years, so the mass-loss due to stripping would be dominated by the mass-loss from the stellar population created during the tidal encounter.
This model is very simple, a ”toy” model and there are several uncertainties which could change the actual parameters. However, it supports the plausibility of the interpretation we have presented.
5 Conclusions
We have used optical, X-ray, and radio properties of galaxies near the core of the populous and apparently merging cluster Abell 2125 to probe the effects of cluster-scale events on individual galaxies. The radio source C153 shows spectacular features which suggest both an AGN and a starburst have been triggered during the interaction. A tail of emission, seen in X-rays, [OII] line emission and UV-light are also seen. A “toy” model suggests the event is consistent with triggering by tidal effects, and stripping of gas during the last 108 years, roughly the time it would take to cross the cluster core at an unusually high relative velocity.
Individual events of this intensity may be rare, requiring a gas-rich galaxy to cross deep within the cluster core at very high velocity. However, they do furnish an opportunity to test our ideas about how stripping proceeds, with less confusion from purely gravitational effects than is generally seen in more protracted instances. In particular, simultaneous detection of optical and X-ray gas in the plume from C153 in A2125 may show us the thermal history of gas as it moves from the interstellar medium to the hot intracluster medium. This event may also be showing us another way in which galaxy evolution can occur.
References
- Acreman et al (2003) Acreman, D. M., Stevens, I. A., Ponman, T. J., & Sakelliou, I. 2003, MNRAS, 341, 1333
- Allen (1998) Allen, S. W. 1998, MNRAS, 296, 392
- Balsara, Livio, & O’Dea (1994) Balsara, D., Livio, M., & OD́ea, C. P. 1994, ApJ, 437, 83
- Bartelmann et al. (1995) Bartelmann, M., Steinmetz, M., & Weiss, A. 1995, A&A, 297, 1
- Bolzonella, Miralles, & Pelló (2000) Bolzonella, M., Miralles, J.-M., & Pelló, R. 2000, A&A, 363, 476
- Calzetti et al (2000) Calzetti, D., Armus, L., Bohlin, R. C., Kinney, A. L., Koornneef, J., & Storchi-Bergmann, T. 2000, ApJ, 533, 682
- Dwarakanath & Owen (1999) Dwarakanath, K. S. & Owen, F. N. 1999, AJ, 118, 625
- Gaetz, Salpeter, & Shaviv (1987) Gaetz, T. J., Salpeter, E. E., & Shaviv, G. 1987, ApJ, 316, 530
- Gnedin (2003) Gnedin, O. Y. 2003, ApJ, 582, 141
- Henriksen & Byrd (1996) Henriksen, M., & Byrd, G. 1996, ApJ, 459, 82
- Jog & Solomon (1992) Jog, C. J., & Solomon, P. M. 1992, ApJ, 387, 152
- Jones & Owen (1979) Jones, T. W. & Owen, F. N. 1979, ApJ, 234, 818
- Leitherer et al (1999) Leitherer, C., et al. 1999, ApJS, 123, 3
- Narayan & Bartelmann (1996) Narayan, R. and Bartelmann, M. 1996, astro-ph/9606001
- Miller et al (2004) Miller, N. A., Owen, F. N., Hill, J. M., Keel, W. C., Ledlow, M. J. & Oegerle, W. R. 2004, ApJ, 613, 841
- Owen et al (1999) Owen, F. N., Ledlow, M. J., Keel, W. C., & Morrison, G. E, 1999, AJ, 118, 633
- Owen et al (2005a) Owen, F. N., Keel, W. C., Ledlow, Morrison, G. E. & Windhorst, 2005, AJ, 129, 26 (Paper I)
- Owen et al (2005b) Owen, F. N., Ledlow, M. J., Keel, Wang, Q. D. & Morrison, G. E. 2005, AJ, 129, 31 (Paper II)
- Schulz & Struck (2001) Schulz, S. & Struck, C. 2001, MNRAS, 328, 185
- Stevens, Acreman, & Ponman (1999) Stevens, I. R., Acreman, D. M. & Ponman, T. J. 1999, MNRAS, 310, 663
- Torri et al. (2004) Torri, E., Meneghetti, M., Bartelmann, M., Moscardini, L., Rasia, E., & Tormen, G. 2004, MNRAS, 349, 476
- Veilleux & Osterbrock (1987) Veilleux, S. & Osterbrock, D. E. 1987, ApJS, 63, 295
- Veilleux et al (2005) Veilleux, S., Cecil, G. & Bland-Hawthorn, J. 2005, ARA&A, 43, 769
- Vollmer et al (2001) Vollmer, B., Cayatte, V., Balkowski, C., & Duschl, W. J. 2001, ApJ, 561, 708
- Wang, Connolly, & Brunner (1997) Wang, Q. D., Connolly, A. & Brunner, R. J. 1997, ApJ, 487, L13
- Wang, Owen, & Ledlow (2004) Wang, Q. D., Owen, F. N. & Ledlow, M. J. 2004, ApJ, 611, 821
- Witt et al. (1992) Witt, A. N., Thronson, H. A., & Capuano, J. M. 1992, ApJ, 393, 611
| Name | Coord Name | Size | ) | Spec T. | Age | z | ||
|---|---|---|---|---|---|---|---|---|
| 00047 | 154109+661544 | 53.6 | 24.59 | -21.7 | 8 | 3.5 | 1.0 | 0.2528e |
| 00057 | 154114+661557 | 10.7 | 23.69 | -23.3 | 1 | 5.5 | 0.4 | 0.2518 |
| 00105 | 154114+661603 | 15.3 | 23.06 | -23.1 | 1 | 7.5 | 0.4 | 0.2470 |
| 00106 | 154115+661556 | 88.1 | 24.42 | -22.7 | 1 | 9.5 | 0.0 | 0.2466 |