xxx–yyy
Physical and chemical structure of dense cores in regions of high mass star formation
Abstract
We found that in regions of high mass star formation the CS emission correlates well with the dust continuum emission and is therefore a good tracer of the total mass while the N2H+ distribution is frequently very different. This is opposite to their typical behavior in low-mass cores. The behavior of other high density tracers varies from source to source but most of them are closer to CS. Radial density profiles in massive cores are fitted by power laws with indices about , as derived from the dust continuum emission. The radial temperature dependence on intermediate scales is close to the theoretically expected one for a centrally heated optically thin cloud. The velocity dispersion either remains constant or decreases from the core center to the edge. Several cores including those without known embedded IR sources show signs of infall motions. They can represent the earliest phases of massive protostars. There are implicit arguments in favor of small-scale clumpiness in the cores.
keywords:
astrochemistry, stars: formation, ISM: abundances, ISM: molecules, radio lines: ISM1 Introduction
Many important aspects of high mass star formation (HMSF) remain unknown or poorly known. This is caused by the much more complicated appearance of HMSF regions in comparison with their low-mass counterparts and by the relative difficulties of their studies due to larger distances, etc. Therefore, detailed investigations of the structure and kinematics of HMSF cores are of great importance. For example, different models of star formation predict different density profiles in the cores and different frequency of outflow occurrence.
An important question in this respect is a selection of reliable tracers of physical parameters in HMSF regions. Chemical effects can seriously distort their appearance. It is now well established that the central parts of dense low mass cloud cores suffer strong depletion of many molecules (in particular, CO, HCO+ and CS) onto dust grains ([Caselli, Walmsley, Tafalla, et al. (1999), Caselli, Walmsley, Tafalla, et al. 1999]; [Caselli, Walmsley, Zucconi, et al. (2002), Caselli, Walmsley, Zucconi, et al. 2002]; [Kramer, Alves, Lada, et al. (1999), Kramer, Alves, Lada, et al. 1999]; [Willacy, Langer, & Velusamy (1998), Willacy, Langer, & Velusamy 1998]; [Jessop & Ward-Thompson (2001), Jessop & Ward-Thompson 2001]; [Tafalla, Myers, Caselli, et al. (2002), Tafalla, Myers, Caselli, et al. (2002)]; [Bergin, Ciardi, Lada, et al. (2001), Bergin, Ciardi, Lada, et al. 2001]), suggesting that CS (so far considered a high density tracer) does not actually probe the central core regions. On the other hand, N2H+ is usually an excellent tracer of dust continuum emission ([Caselli, Walmsley, Zucconi, et al. (2002), Caselli et al. 2002]), implying that this species depletes at higher densities compared to CO, despite of the same binding energies ([Öberg, van Broekhuizen, Fraser, et al. (2005), Öberg, van Broekhuizen, Fraser, et al. 2005]).
The situation is less clear in HMSF cores where the mechanisms of chemical differentiation are probably different (e.g. not linked to molecular freeze-out). There were several studies which show chemical variations in a few similar regions ([Ungerechts, Bergin, Goldsmith, et al. (1997), Ungerechts, Bergin, Goldsmith, et al. (1997)]; [Bergin, Goldsmith, Snell, et al. (1997), Bergin, Goldsmith, Snell, et al. 1997]). Here, we present observations of a statistically significant sample of HMSF cores.
2 Chemical differentiation in HMSF regions
A comparison of our CS ([Zinchenko, Mattila & Toriseva (1995), Zinchenko, Mattila & Toriseva 1995]; [Zinchenko, Pirogov & Toriseva (1998), Zinchenko, Pirogov & Toriseva 1998]; Pirogov et al., in preparation) and N2H+ ([Pirogov, Zinchenko, Caselli, et al. (2003), Pirogov, Zinchenko, Caselli, et al. 2003]) maps in many cases shows striking differences between them. Our further studies of dust continuum emission and other high density tracers (HCN, HNC, HCO+, their isotopes, etc.) reveal certain relationships between them. The details of these observations are presented elsewhere (Pirogov et al., in preparation, Zinchenko et al., in preparation). Here we summarize the main results.
First, we found a good correlation between CS and dust emission in most cases. At the same time N2H+ distributions are frequently very different. An example of such comparison is shown in Fig. 1. The millimeter wave dust (and CS) emission peaks are also usually associated with strong FIR sources (in particular, from the IRAS catalogue). On the other hand the N2H+/CS ratio usually reaches the highest values towards clumps without such association.
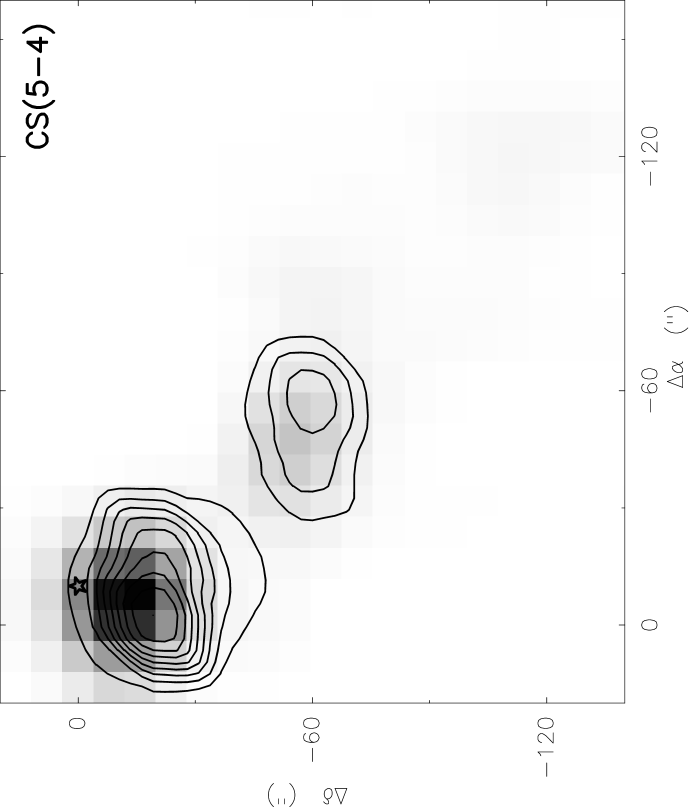
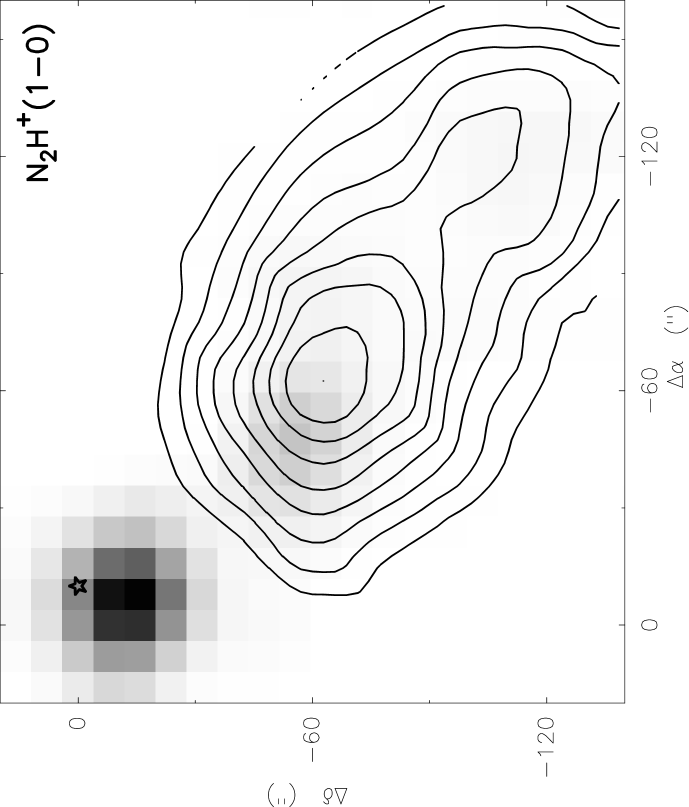
This behavior is opposite to that typical for cold low-mass cores. The variations of the CS/N2H+ intensity ratio reach more than an order of magnitude. It is worth noting that the N2H+ optical depth is usually small ([Pirogov, Zinchenko, Caselli, et al. (2003), Pirogov et al. 2003]) while the CS optical depth can be rather high. This means that the saturation effects can only decrease the apparent variations of the CS/N2H+ ratio.
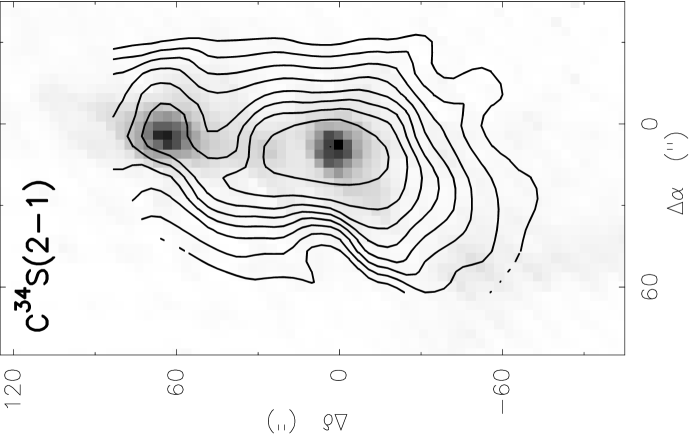
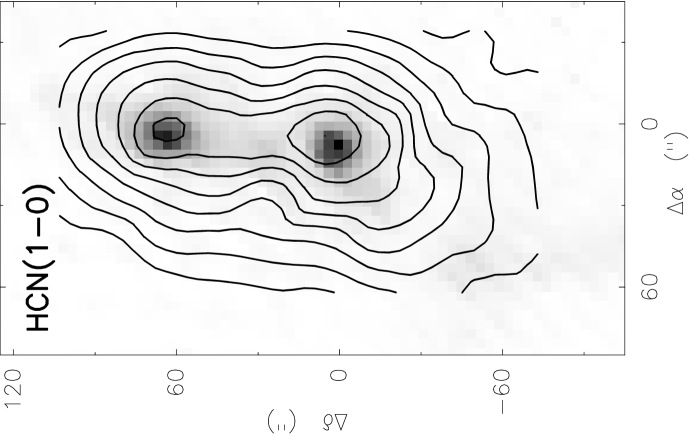
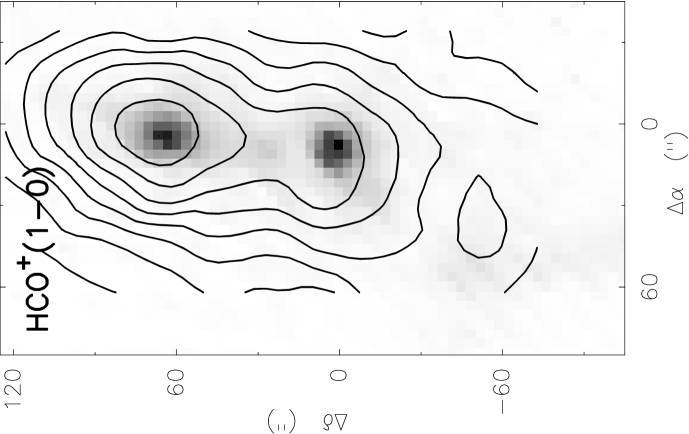
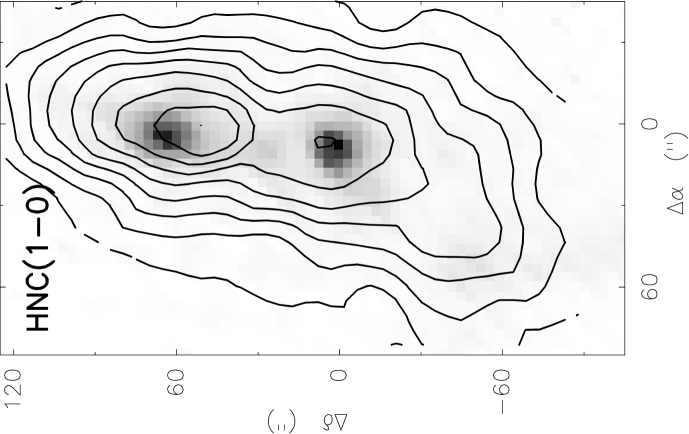
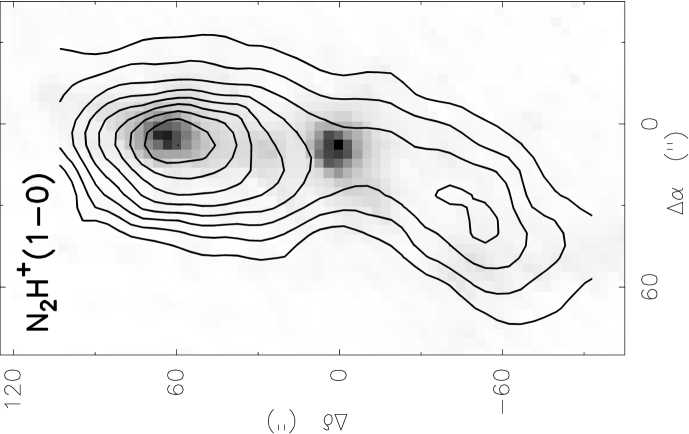
The behavior of other high density tracers varies from source to source but most of them are closer to CS. An exception is HNC which is an intermediate case in this sense between CS and N2H+. In Fig. 2 we present as an example maps of several high density tracers in S255 overlaid on the dust continuum map. It shows two continuum peaks almost equal in intensity. The nature of these two components is different. The central one is associated with a luminous cluster of IR sources, whereas toward the northern one an ultracompact H ii region (G192.58-0.04) was detected. CS and HCN follow the dust distribution quite well, while N2H+ is very different. HCO+ map in S255 looks similar to N2H+ but in some other sources it is closer to CS. The same can be said about ammonia. A comparison of the C18O and dust continuum data for this source shows no sign of CO freeze out which suggests that the dust temperature is above 20 K, the sublimation temperature of CO.
We studied variations of kinetic temperature in these sources by CH3C2H observations. In most cases no significant temperature difference between the CS and N2H+ peaks was found ([Malafeev, Zinchenko, Pirogov, et al. (2005), Malafeev, Zinchenko, Pirogov, et al. 2005]). Typical temperatures which we derived for these peaks are K. E.g. in S255 we found kinetic temperatures of K for both peaks mentioned above. Therefore, the observed chemical differentiations cannot be explained by molecular freeze-out as in low mass cores.
Density differences between the CS and N2H+ peaks are also not very significant as follows from our density estimates based on CS and CH3OH LVG modelling. At the same time the gas densities at CS peaks are somewhat higher than at the N2H+ ones and in general there is a correlation between CS emission intensity and gas density.
One possible explanation for the observed chemical differentiations was proposed by [Lintott, Viti, Rawlings, et al. (2005), Lintott, Viti, Rawlings, et al. (2005)]. They suggested that the enhancement of CS/ abundance ratio may be related to the high dynamical activity in these regions which could enhance the rate of collapse of cores above the free-fall rate. Consequently, high gas densities would be achieved before freeze-out had removed the molecules responsible for the loss, while the high densities promote CS formation. Our data show that in most cases the line widths at the CS peaks are somewhat larger than at the N2H+ peaks which is consistent with this model although in S255 the reverse is true.
3 Internal structure and kinematics of HMSF cores
3.1 Radial density profiles
We studied the density profiles in the cores using the molecular line and dust continuum maps. From the N2H+ data we derived the density profile assuming constant N2H+ excitation and abundance along the radius ([Pirogov, Zinchenko, Caselli, et al. (2003), Pirogov et al. 2003]). However, this assumption is not justified and probably more reliable conclusions can be drawn from dust observations. The analysis of the dust continuum maps was similar. We fitted the 2D intensity distribution for nearly circular clumps with a convolution of a power law function with a gaussian beam. The details of this analysis are presented elsewhere (Pirogov et al., in preparation). An example of this fitting is shown in Fig. 3.


In total, the data for 17 clumps obtained at SEST were analyzed. The power law index is for clumps with embedded IRAS point sources and for clumps without such sources. Assuming temperature gradient in the former sources (described by a power law index of , see below) and isothermal latter sources, this corresponds to density profiles for both types of clumps.
Such density profiles are in agreement with several other studies (e.g. [Beuther, Schilke, Menten, et al. (2002), Beuther, Schilke, Menten, et al. 2002]; [Mueller, Shirley, Evans II, et al. (2002), Mueller, Shirley, Evans II, et al. 2002]). They rule out some theoretical models (e.g. so-called “logatropic” one) but are consistent with the “standard” theory of star formation ([Shu (1977), Shu 1977]).
It is worth noting that these dependencies are obtained for mean volume densities which are derived from column densities. Densities found for regions of molecular emission from excitation analysis are usually significantly higher and have different dependence on radius (as shown in Fig. 3). This can be a consequence of small scale clumpiness in these regions. The volume filling factor should be .
3.2 Radial temperature profiles
We studied the temperature distribution in the cores on the basis of high quality CH3C2H maps obtained at IRAM 30-m telescope (the beam width at this frequency is ). An example of temperature map (for S140) is shown in Fig. 4. These maps could be deconvolved into several distinct clumps and the dependence of temperature on the projected distance from the clump center was analyzed. An example of this dependence for the main clump in S140 is also shown in Fig. 4.
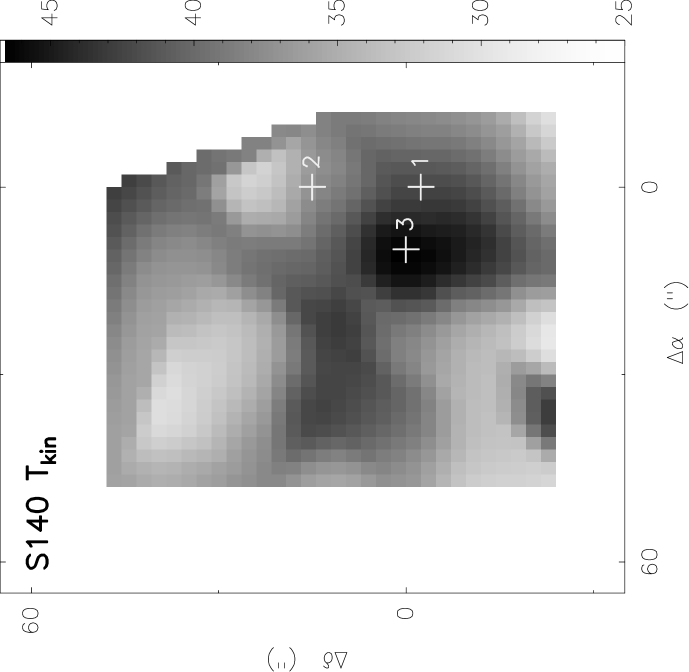
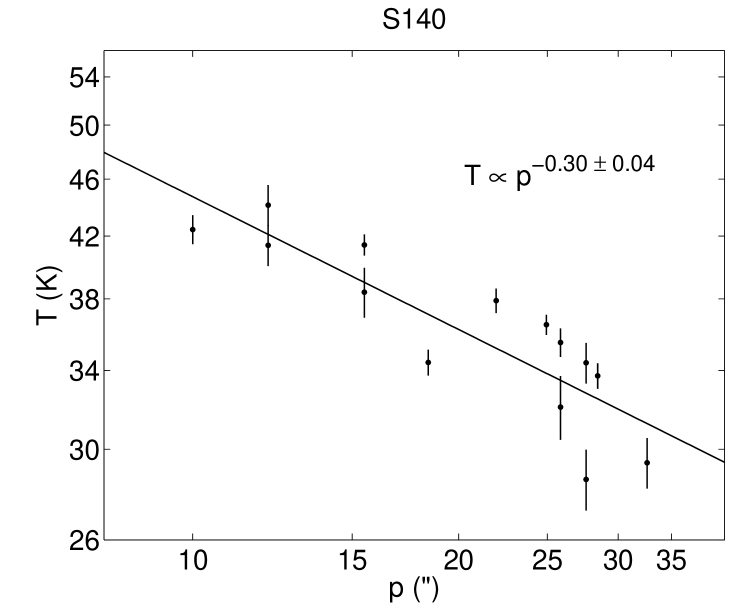
These dependencies were compared with model calculations of temperatures which would be derived for optically thin CH3C2H emission from a spherically symmetric cloud with a power law temperature and density gradients (CH3C2H was assumed to be thermalized at densities cm-3). We found that the radial temperature dependence in these clumps can be fitted by a power law with indices between –0.3 and –0.4.
This dependence is in agreement with the theoretically expected one for a centrally heated optically thin cloud. Some other recent studies found somewhat different dependencies. E.g. [Fontani, Cesaroni, Caselli, et al. (2002)] derived steeper temperature gradients from comparison of temperatures found from different species and at the same time argued for rather constant temperature in regions of CH3C2H emission. The results presented here do not support these conclusions.
3.3 Radial velocity dispersion profiles
Our CS and N2H+ data show that the velocity dispersion in HMSF cores either remains constant or decreases outwards ([Zinchenko (1995), Zinchenko 1995]; [Lapinov, Schilke, Juvela, et al. (1998), Lapinov, Schilke, Juvela, et al. 1998]; [Pirogov, Zinchenko, Caselli, et al. (2003), Pirogov et al. 2003]). A plausible explanation could be found in a higher degree of dynamical activity of gas in central regions of HMSF cores, including differential rotation, infall motions and turbulence due to winds and outflows from massive stars. It is worth noting that [Caselli & Myers (1995)] derived an opposite trend from comparison of line widths and sizes of the emission regions for different species in the same source. The reason for this discrepancy is not clear yet.
3.4 Core rotation and associated outflows
Many HMSF cores mapped in N2H+ show systematic velocity gradient fields, implying nearly uniform rotation ([Pirogov, Zinchenko, Caselli, et al. (2003), Pirogov et al. 2003]). There is a correlation () between direction angle of total velocity gradient and elongation angle. This fact justifies an assumption that elongation of cores and clumps could be due to rotation. However, the ratio of rotational to gravitational energy is only on the average, so that rotation should not play a significant role in core dynamics.
The frequency of occurrence of high velocity outflows in the studied sample was found to exceed % using SO line wings as an indicator ([Zinchenko (2002), Zinchenko 2002]) which is in agreement with other available estimates.
3.5 Infall motions and massive protostars
In several cases molecular line profiles (especially HCO+) show features indicative of infall motions (red-shifted self-absorption). This is a case both for clumps with and without strong embedded IR sources. However, the latter ones are probably at an earlier stage of evolution, and they are characterized by a relatively high N2H+/CS ratio, as mentioned above. Thus, one can speculate that this ratio can be one of the indicators of the earliest phases of massive protostars.
4 Conclusions
We have shown that effects of chemical differentiation in warm massive cores are very different from those in cold low mass cores. In particular, CS is a good tracer of total mass here, while N2H+ is not. A relatively high N2H+/CS ratio can indicate the earliest phases of massive protostars. The internal structure of HMSF clumps is more or less consistent with the standard theory of star formation.
Acknowledgements.
The work was supported by Russian Foundation for Basic Research grant 03-02-16307 (in part) and INTAS grant 99-1667 (in part). The research has made use of the SIMBAD database, operated by CDS, Strasbourg, France.References
- [Bergin, Goldsmith, Snell, et al. (1997)] Bergin, E.A., Goldsmith, P.F., Snell, R.L., Langer, W.D. 1997, ApJ 482, 285
- [Bergin, Ciardi, Lada, et al. (2001)] Bergin, E.A., Ciardi, D.R., Lada, C.J., Alves, J., Lada, E.A. 2001, ApJ 557, 209
- [Beuther, Schilke, Menten, et al. (2002)] Beuther, H., Schilke, P., Menten, K. M., Motte, F., Sridharan, T. K., & Wyrowski, F. 2002, ApJ 566, 945
- [Caselli & Myers (1995)] Caselli, P., Myers, P.C. 1995, ApJ 446, 665
- [Caselli, Walmsley, Tafalla, et al. (1999)] Caselli, P., Walmsley, C.M., Tafalla, M., Dore, L., Myers, P.C. 1999, ApJ 523, L165
- [Caselli, Walmsley, Zucconi, et al. (2002)] Caselli, P., Walmsley, C.M., Zucconi, A., Tafalla, M., Dore, L., Myers, P.C. 2002, ApJ 565, 331
- [Evans II, Mundy, Kutner, et al. (1989)] Evans, N.J., II, Mundy, L.G., Kutner, M.L., Depoy, D.L. 1989, ApJ 346, 212
- [Fontani, Cesaroni, Caselli, et al. (2002)] Fontani, F., Cesaroni, R., Caselli, P., & Olmi, L., 2002, A&A, 389, 603
- [Jessop & Ward-Thompson (2001)] Jessop & Ward-Thompson, 2001, MNRAS 323, 1025
- [Kramer, Alves, Lada, et al. (1999)] Kramer, C., Alves, J., Lada, C.J., Lada, E.A., Sievers, A., Ungerechts, H., Walmsley, C.M. 1999, A&A 342, 257
- [Lapinov, Schilke, Juvela, et al. (1998)] Lapinov, A. V., Schilke, P., Juvela, M., & Zinchenko I. I., 1998, A&A 336, 1007
- [Lintott, Viti, Rawlings, et al. (2005)] Lintott, C.J., Viti, S., Rawlings, J.M.C., Williams, D.A., Hartquist, T.W., Caselli, P., Zinchenko, I., Myers, P. 2005, ApJ 620, 795
- [Malafeev, Zinchenko, Pirogov, et al. (2005)] Malafeev, S.Yu., Zinchenko, I.I., Pirogov, L.E., Johansson, L.E.B. 2005, Astron. Lett. 31, 262
- [Mueller, Shirley, Evans II, et al. (2002)] Mueller, K. E., Shirley, Y. L., Evans II, N. J., & Jacobson, H. R. 2002, ApJS 143, 469
- [Öberg, van Broekhuizen, Fraser, et al. (2005)] Öberg, K.I., van Broekhuizen, F., Fraser, H.J., Bisschop, S.E., van Dishoeck, E.F., & Schlemmer S. 2005, ApJ 621, L33
- [Pirogov, Zinchenko, Caselli, et al. (2003)] Pirogov, L., Zinchenko, I., Caselli, P., Johansson, L.E.B., Myers, P.C. 2003, A&A 405, 639
- [Shu (1977)] Shu, F. H. 1977, ApJ 214, 488
- [Tafalla, Myers, Caselli, et al. (2002)] Tafalla, M., Myers, P.C., Caselli, P., Walmsley, C.M., Comito, C. 2002, ApJ 569, 815
- [Ungerechts, Bergin, Goldsmith, et al. (1997)] Ungerechts, H., Bergin, E.A., Goldsmith, P.F., Irvine, W.M., Schloerb, F.P., Snell, R.L. 1997, ApJ 482, 245
- [Willacy, Langer, & Velusamy (1998)] Willacy, K., Langer, W.D., Velusamy, T. 1998, ApJ 507, L171
- [Zinchenko (1995)] Zinchenko, I. 1995, A&A 303, 554
- [Zinchenko, Mattila & Toriseva (1995)] Zinchenko, I., Mattila, K., Toriseva, M. 1995, A&AS 111, 95
- [Zinchenko, Pirogov & Toriseva (1998)] Zinchenko, I., Pirogov, L., Toriseva, M. 1998, A&AS 133, 337
- [Zinchenko (2002)] Zinchenko, I.I. 2002, Astron. Lett. 28, 316