Hydrogen and Helium traces in Type Ib-c Supernovae
Abstract
Aims. To investigate the spectroscopic properties of a selected optical photospheric spectra of core collapse supernovae (CCSNe). Special attention is devoted to traces of hydrogen at early phases. The impact on the physics and nature of their progenitors is emphasized.
Methods. The CCSNe-sample spectra are analyzed with the parameterized supernova synthetic spectrum code “SYNOW” adopting some simplifying approximations.
Results. The generated spectra are found to match the observed ones reasonably well, including a list of only 23 candidate ions. Guided by SN Ib 1990I, the observed trough near 6300Å is attributed to H in almost all Type Ib events, although in some objects it becomes too weak to be discernible, especially at later phases. Alternative line identifications are discussed. Differences in the way hydrogen manifests its presence within CCSNe are highlighted. In Type Ib SNe, the H contrast velocity (i.e. line velocity minus the photospheric velocity) seems to increase with time at early epochs, reaching values as high as 8000 km s-1 around days after maximum and then remains almost constant. The derived photospheric velocities, indicate a lower velocity for Type II SNe 1987A and 1999em as compared to SN Ic 1994I and SN IIb 1993J, while Type Ib events display a somewhat larger variation. The scatter, around day 20, is measured to be 5000 km s-1. Following two simple approaches, rough estimates of ejecta and hydrogen masses are given. A mass of hydrogen of approximately 0.02 is obtained for SN 1990I, while SNe 1983N and 2000H ejected 0.008 and 0.08 of hydrogen, respectively. SN 1993J has a higher hydrogen mass, with a large uncertainty. A low mass and thin hydrogen layer with very high ejection velocities above the helium shell, is thus the most likely scenario for Type Ib SNe. Some interesting and curious issues relating to oxygen lines suggest future investigations.
Key Words.:
Supernovae: type Ib-c, spectra, light curves; Line: identification; Line: formation1 Introduction
Stripped-envelope SNe, namely Type Ib (helium-rich) and Type Ic (helium-poor), being hydrogen deficient objects, are undoubtedly amongst the most mysterious SN classes. Recently efforts have started to understand the nature of these objects through studies of samples (Matheson et al. 2001; Branch et al. 2002).
However the rarity of cases with well sampled observations, photometry and spectra, hampers a more direct inference of the physical situation behind the explosions and hence a clear view of the progenitor nature. Nevertheless, the discovery of metamorphosing events as SN 1987K and SN 1993J (recognized as SNe IIb), that evolve from Type II to Type Ib-c as they age, together with the similarity of the environments in which they occur have linked Type Ib-c SNe to a core-collapse scenario in massive stars. At present, indeed, the most widely accepted models relate Type Ib-c SNe to both relatively low mass progenitors within the context of close binary system evolution (i.e. mass-loss as consequence of mass transfer) and massive stars that have undergone significant mass-loss due to a wind (i.e. Wolf-Rayet stars). So far observations have not discriminated between the two scenarios, although recently, using HST data, a high spatial resolution search for the progenitor of the Type Ic SN 2004gt in a wide wavelength range from the far UV to the near IR has suggested that the event might result from an evolved Wolf-Rayet star, although the observations could not constrain models invoking less massive progenitors in binary systems (Gal-Yam et al. 2005).
Photometrically, the lack of significant hydrogen in the outer layers of SNe Ib-c probably inhibits the most important characteristic of Type II SNe light curves, namely the plateau phase resulting from the hydrogen recombination wave.
At late phases, the steeper decline rate, compared to the “56Co to 56Fe” decay slope, is indicative of significant -ray escape as a result of the low mass ejecta in this class of objects (Clocchiatti Wheeler 1997); there are rare exceptions where the late slope approaches the full trapping rate (e.g. SN Ib 1984L; Schlegel Kirshner 1989).
Spectroscopically, a clear separation scheme within the stripped-envelope SNe subclasses is still lacking. Part of the problem is the absence of meaningful statistics. A direct classification was earlier proposed by Harkness et al. (1987) on the basis of He I strengths in the photospheric optical spectra of Type Ib SNe. Wheeler et al. (1994), however, have claimed the presence of He I 10830Å in SN Ic 1990W, although He I lines were not noted in the optical region. The authors presented the idea of adopting, instead, the OI 7773Å line as a distinguishing feature. The absorption seems stronger in Type Ic than in Ib SNe. Matheson et al. (2001) came to the same conclusion when analyzing a sample of Ib and Ic events. In addition, it has been argued that in Type Ib SNe He I lines 5876Å and 7065Å gradually grow in strength with respect to the one at 6678Å (Matheson et al. 2001). SN 1998bw (GRB980425) is another example of classification as Type Ic, but where IR lines of He I have been clearly identified (Patat et al. 2001).
Branch et al.(2002) have presented a relation between the velocity at the photosphere, measured using synthetic-spectrum analysis, and the time since maximum light for a sample of Type Ib SNe. The relation is well fitted by a power-law, indicating a fairly homogeneous behaviour. Interestingly, SN Ib 1990I does not follow this trend (Elmhamdi et al. 2004).
An important issue concerns features in the 60006500Å region of the early spectra in Ib-c SNe. Deng et al. (2000), when analyzing spectra of SN Ib 1999dn, have attributed the absorption feature seen at 6300Å around maximum brightness to H which later on disappears or is overwhelmed by C II 6580Å when H optical depth decreases as a consequence of the envelope expansion. The possibility of the presence of C II 6580Å in Ib spectra has been earlier suggested by Harkness et al.(1987). Alternatively, the 6300Å absorption was identified to be due to Ne I 6402Å in SN Ib 1991D (Benetti et al. 2002). Ne I lines and H had already been proposed to account for the deep absorption in SN Ib 1954A by Branch (1972).
The presence, or not, of hydrogen and/or helium in Type Ib-c, with the possibility of quantifying the amount, is of great importance in identifying the progenitor stars that may give rise to these classes of objects.
The papers by Matheson et al. (2001) and Branch et al. (2002) have provided an impetus towards an advanced understanding of SNe Ib and Ic. The present work may be regarded as a continuation of those efforts. However in our comparative study of early spectra of Type Ib SNe we include representatives of all the various types of CCSNe, namely Type IIb, Type Ic and Type II. This is established by means of synthetic spectra generated with the parametrized SN synthetic-spectrum code “SYNOW”.
Our main goal was to understand the similarities and differences among SNe Ib objects in the available sample, and to also compare to properties of the wider CCSNe family. The paper is organized as follows. First the analysis method and parameters are illustrated in Sect. 2. Data description is briefly given and the best fit synthetic spectra are presented and compared with the observed ones in Sect. 3. This is done separately for each individual object among representatives of CCSNe classes. Sect. 4 presents two methods to obtain spectroscopic mass estimates. The complete results will be discussed in detail and conclusions will be drawn in Section 5.
2 Fitting procedure: SYNOW code
For the purpose of our analysis we make use of the parameterized supernova synthetic spectrum code “SYNOW”. The code assumes spherical symmetry, homologous expansion: “v r” velocity-law and resonant scattering line formation above a sharp photosphere, emitting a blackbody continuum. SYNOW treats line formation and line blending (i.e. multiple scattering) within the Sobolev approximation (Jeffery & Branch 1990; Fisher 2000; Branch 2001), and reads lines from the Kurucz 42-million atomic line list (Kurucz 1993). It is an LTE code in only one respect: LTE excitation for the relative strengths of the lines of an individual ion, but it does not assume LTE ionization.
SYNOW provides a number of free fitting parameters. The most important are: 1. (), the optical depth of the strongest line, in the optical region, of the introduced ion. The line is called “the reference line”. The optical depths of the other lines of the same ion are thereafter determined assuming Boltzmann equilibrium. To decide which ion to introduce in the synthesis procedure we rely on the work by Hatano et al.(1999) as a starting point. The authors have presented the variation with temperature of LTESobolev line optical depths of 45 individual candidate ions that might be encountered in supernova envelopes for six different compositions. 2. (): the underlying blackbody continuum temperature. We did not attach high physical importance to this parameter although the galactic extinctions for each individual supernova, as reported by Schlegel et al. 1998, is taken into account. Independently of the present study, estimating the total reddening to the event, both that caused by foreground dust in the Milky Way and that caused by dust in the host galaxy, is a crucial point in supernovae study, especially when using them as cosmological probes. 3. (): the velocity at the photosphere, estimated from the match with Fe II lines. Restrictions on the velocity interval within which an ion is introduced is possible. A maximum outer boundary velocity of line-forming-region of km s-1 is adopted in the present analysis. When assigning a minimum ion velocity, “”, greater than “”, the ion is said to be “detached” from the photosphere, and consequently has a “non-zero” optical depth only starting at “”. In SYNOW the profile of a detached line has a flat-topped emission, and the absorption minimum is blueshifted by the detachment velocity. An undetached line has a rounded emission peak. A slightly detached line has a flat top but only over a small wavelength interval. However whenever one talks about detached lines one needs to keep in mind that we are using a somewhat unrealistic “”, one that has a discontinuity in it. Real supernovae spectra probably do not have sharp discontinuities.
The radial dependence of the line optical depths can be chosen to be either exponential with an -folding velocity “” as free parameter (i.e. ), or a power-law with an index “” (i.e. ). In the present work a power-law profile is adopted with an index , although for some objects we will discuss the possibility of an exponential profile.
When fitting our CCSNe sample spectra we have tested many combinations of fitting parameters. Only the best generated synthetic spectra are displayed in the following and compared to the observed ones. We introduce the parameter “contrast velocity”, defined as the line minimum velocity minus to the photospheric one: “”. We show as well the behaviour of a similar parameter, defined instead as a ratio, i.e. “”.
Although the computations are made under the purely resonant scattering assumption, we find that the photospheric-optical spectra of CCSNe are fitted well usually requiring only 23 candidate ions or fewer. Table 1 lists the candidate reference lines sufficent to reproduce the observed features in optical spectra of the CCSNe sample. It is important to note that since at early phases line formation takes place in high velocity layers causing severe line blending, it is better in some complicated cases to analyze line identifications in reverse chronological order (i.e. starting with later phase spectra followed by earlier ones). All the analyzed spectra have been transformed to the rest frame of their host galaxies.
| Ion | Rest Wavelength (Å) |
|---|---|
| Ca II | 3934 |
| Ni II | 4067 |
| Co II | 4161 |
| Mn II | 4205 |
| Ca I | 4227 |
| Cr II | 4242 |
| Sc II | 4247 |
| C II | 4267 |
| Mg II | 4481 |
| Ti II | 4550 |
| Ba II | 4554 |
| Fe II | 5018 |
| Mg I | 5184 |
| He I | 5876 |
| Na I | 5890 |
| Si II | 6347 |
| Ne I | 6402 |
| H I | 6563 |
| O II | 7321 |
| O I | 7772 |
| Si I | 7944 |
| N I | 8680 |
| C I | 9095 |
3 Data description and Analysis
Our selected CCSNe sample consists of 20 objects - 16 of them are Type Ib, 2 are Type Ic, 1 is Type IIb and 1 is Type II SN. Some of the spectra presented in this work were gathered with the 60” Telescope and the “MMT” on Mount Hopkins. They are part of the supernova monitoring program of the Center for Astrophysics (PI R.P. Kirshner). Data for SN 1996aq are taken from the Padova-Asiago supernova database. Use is made as well of the “SUSPECT”111http://bruford.nhn.ou.edu/ suspect/index1.html supernovae spectral archive. Descriptive data regarding the sample events are listed in Table 2 (i.e. host galaxy, recession velocity and phases). For each individual event, the table summarizes as well the most important fitting parameters. The last column indicates the number of ions we find responsible for determining the best fit spectra (details described in the following). Throughout the present work, however, we do not provide details concerning observations of individual objects. We focus, instead, on synthetic spectra fitting procedures, constraints, problems and what we may learn about the CCSNe physical situation.
3.1 Type Ib SNe: the sample
SN 1990I:
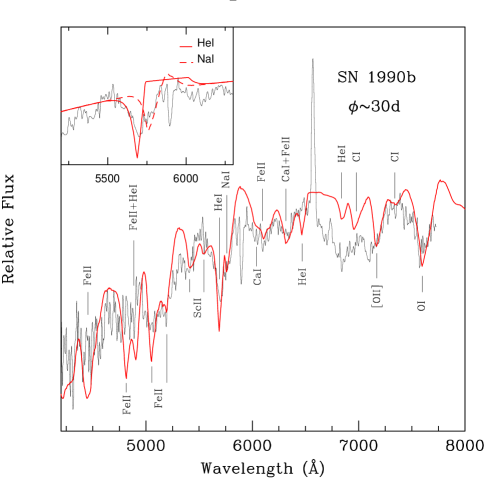
We start with SN 1990I since it can be considered as one of the better observed objects among Type Ib-c SNe in terms of quality and sampling. The event has been exploited both photometrically and spectroscopically giving constraints on ejecta, oxygen and nickel masses and energy estimates (Elmhamdi et al. 2004). The supernova seems to follow a velocity trend different from the pattern shown by the 10 SNe Ib sample of Branch et al. (2002). Here we investigate this peculiarity by means of synthetic spectra fits.
The observed spectrum at maximum light, shown in Fig. 1, is compared to a synthetic spectrum (SSp) that has a velocity at the photosphere km s-1 and a blackbody continuum temperature T14000 K. The SSp contains lines of He I, Fe II, Sc II, Mg II, O I, Ca II and H. The lines of Sc II, with (Sc II), have been introduced to help the fit of the absorption feature around 6000Å and redward the trough attributed to He I 5876Å. Absorption troughs of P-Cygni He I lines at 5876Å, 6678Å and 7056Å are evident, although their relative strengths cannot be simultaneously fitted within the LTE approach in the SSp. We will face this limitation each time we analyze and fit He I lines. A more precise analysis requires NLTE treatment as He I lines may be non-thermally excited by the decay products of 56Ni and 56Co (Lucy 1991). Apart from He I and H lines, the remaining lines have non-zero optical depths starting at the photospheric velocity (i.e. they are undetached). The SYNOW parameters required to account for the He I lines are (He I) and (He I) km s-1.
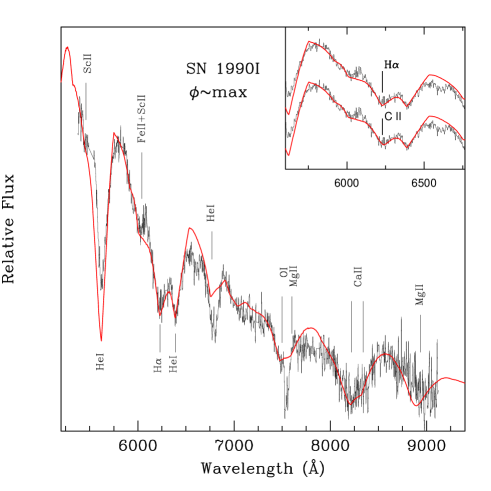
The absorption minimum near 6250Å is well fitted by H, with (H)=16000 km s-1 and assigned a moderate optical depth of 0.6 (Fig. 1). However, we tested other plausible alternative identifications that were introduced in the literature to account for similar features seen in Type Ib SNe, namely Si II 6355Å, Ne I 6402Å and C II 6580Å lines. Undetached Ne I lines were quite tempting in SN Ib 1991D, and worked as well as H having a contrast velocity of (H) =7000 km s-1 (Benetti et al. 2002). For SN 1990I, instead, ( H) is only 4000 km s which means that undetached Ne I line is excluded because it is too blue to fit the observed feature. Si II 6355Å is obviously also too blue. C II 6580Å remains then a plausible alternative for H, since its rest wavelength is slightly redder than H and therefore has its contrast velocity as a free parameter. In the window of Fig. 1, we show synthetic spectra for both cases (H and C II). C II, with (CII)=17000 km s-1 and (CII), provides a fit as good as H. But an acceptable C II 6580Å line would require an additional velocity of about 820 km s-1 compared to H (Å difference). C II 6580Å has been proposed in early spectra of SN Ib 1999dn (Deng et al. 2000). Indeed, at maximum light and day 14, SSp fits of SN 1999dn included C II with (CII) 7000 and 1000 km s-1 respectively, while He I lines were formed starting at the photosphere (i.e.(He I)0 km s-1) (Deng et al. 2000). For SN 1990I, the situation is almost similar: He I in the SSp shown in Fig. 1 has (He I)2000 km s-1 while (CII)5000 km s-1. This means that the C II lines would need to be formed above the helium layer, which would be surprising, if not unphysical, in Type Ib SNe.
SN 1990I, with its particular velocity structure, presents good evidence for an H feature. However since it is not absolutely clearcut that H is always responsible for the absorption at about 6300Å seen in Type Ib SNe, the presence of the H Balmer line would be of great support. Unfortunately the optical depth sufficient to fit the H trough is so small that the other Balmer features are too weak to be unambiguously detectable ((H is about 7 times greater than (H).
Based on our investigation, the ions that generally might be encountered in shaping the 60006500Å wavelength
range are: H, Ne I, C II, Si II, Sc II, Ca I, He I, Fe II, Si I and Ba II. Here, we propose the following
criteria in view of the methodology for deciding what lines should be adopted
(especially for the 6300Å feature):
when Fe II lines are very strong, they could produce a trough that might be sufficient to fit the
6300Å feature. The depth of that Fe II feature is controlled by means of Fe II lines at 4924, 5018 and 5169Å.
undetached Sc II, Si I, Ca I and Ba II can be introduced especially to fit the slope at 60006300Å
wavelength range. They should not, however, introduce unwanted features in the rest of the spectrum.
undetached Ne I 6402Å line is rejected once its feature is too blue to fit the 6300Å trough or/and
when the other Ne I lines clearly introduce various unwanted features. Similar reasoning applies to the Si II 6355Å
line.
with its contrast velocity as a free parameter, C II 6580Å line could be a candidate for the 6300Å
trough; nevertheless it is ruled out once it exceeds the He I contrast velocity.
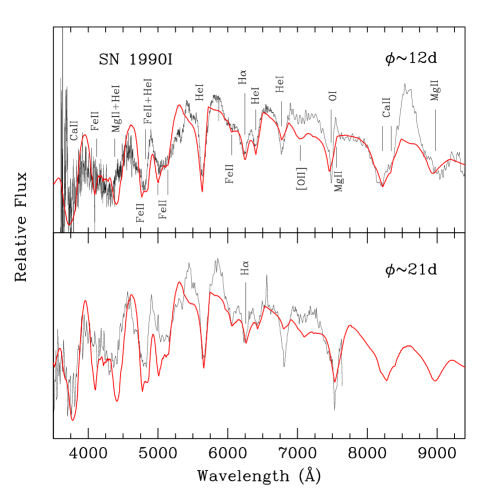
In Figure 2, the observed spectra at 12days (top panel) and 21days (bottom panel) are compared to the synthetic ones with (=10000 km s-1; Tbb=5500 K) and (=9500 km s-1; Tbb=5400 K), respectively. Synthetic line profile features are labeled by the designation of the ion whose line gives rise to the feature. He I is still detached from the photosphere with (He I) 3000 km s-1 at 12d and (He I) 2500 km s-1 at 21days. The He I 7065Å seems to increase in strength relative to the He I lines at 5876Å and 6678Å, indicating the non-thermal excitation effects are changing but still existent. Two interesting points emerge from our SSp fit: on the one hand, even though the reference line Ca II 3933Å, with (Ca II)=120 at both 12days and 21days, produces a good match to the observed one, the Ca II infrared triplet (8542, 8662, 8498Å) has a clear deficit especially in the emission component of its P-Cygni profile. On the other hand, the observed O I 7773Å is deep. An optical depth of 2 is in fact imposed to reproduce the deep trough in the SSp at 21days. The O I 7773Å lines are believed to have relatively greater strength in Type Ic SNe compared to Ib objects (Wheeler et al. 1994; Matheson et al. 2001). This is presumably because for a “” C/O envelope of Type Ic, one would expect oxygen lines to be more prominent relative to Ib case where an intact helium, and possibly some hydrogen, could tend to dilute the C/O core.
Matheson et al. (2001) have defined a parameter called “Fractional Line Depth” of the line through absorption minimum relative to the continuum flux. Mean values of 0.27 (0.11) and 0.38 (0.091) were found to represent Type Ib and Type Ic respectively. For the case of SN 1990I, we measure a value of about 0.45, indicating that the SN was peculiar in this respect. One explanation for this abnormal behaviour of SN 1990I might be related to the amount of oxygen. In fact Elmhamdi et al. (2004) have argued for a possible high oxygen mass (0.71.35 M⊙) relative to other Ib objects (0.3 M⊙ in SNe 1984L, 1985F and 1996N).
As far as the 60006500Å wavelength region is concerned, we find that Fe II, He I and H are sufficient to
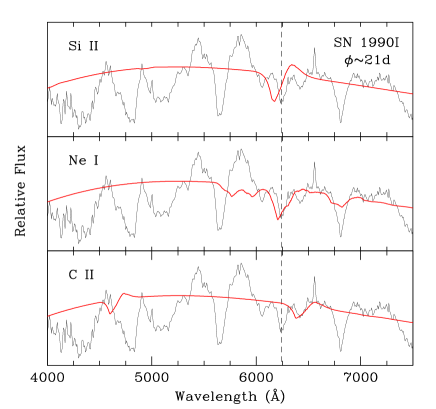
reproduce the overall shape in the SSp at both 12days and 21days. We have, however, tested the Ne I, Si II and C II
possibilities as candidates for the 6250Å trough. Panels in Fig. 3 are similar to the bottom of Fig. 2, but with
only Si II(top), Ne I(middle) and C II(bottom) lines. All three ions are formed starting at the photosphere
(= 0 km s-1). Both Si II and Ne I lines are ruled out by means of criterion number 3 above. C II is
as well rejected because of criterion 4. We therefore consider H to be the most likely explanation in SN 1990I.
SN 1983N:
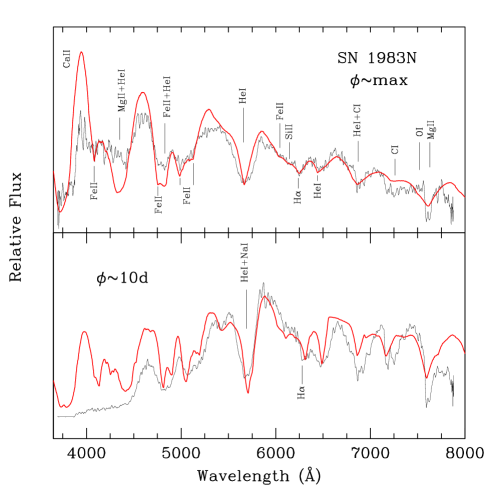
The observed spectra at maximum light and at 10days are shown in Fig. 4, together with the corresponding
synthetic spectra. The SSp at maximum brightness has km s-1 and a blackbody continuum
temperature T8000 K, while the one at 10days has km s-1 and T5000 K. Ne I
and C II are rejected because of the criteria 3 and 4, while undetached Si II helps in fitting the absorption
blueward the 6250Å trough. H with 0.34 accounts nicely for the 6250Å absorption at maximum.
He I has 2.5 and = 0 km s-1, while SSp at 10days has (He I)= 2000 km s-1
and (H)= 5000 km s1. Na I line is added in the 10days SSp to help the fit of the emission
component peaked around 5900Å.
SN 1984L:
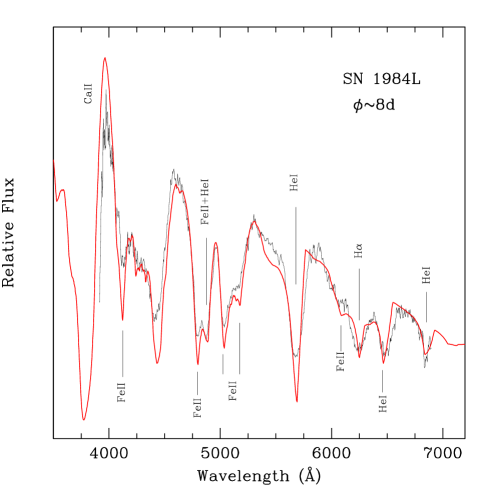
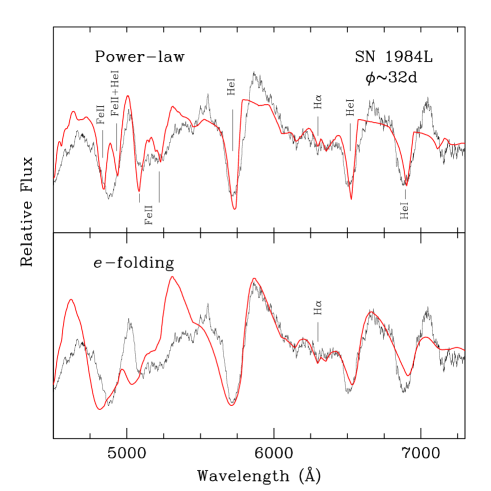
Figure 5 compares the observed spectrum at 8days with an SSp that has km s-1 and T8000 K. Ions that are responsible for the most conspicuous absorption features are indicated. Interestingly, He I lines with = 2000 km s-1 and 2.5 , provide a good match at 5876Å, 6678Å and 7056Å. That may indicate that departures from LTE, due to non-thermal effects, are not severe for this Type Ib object. A similar result obtains for the 32day spectrum i.e. ((He I)= 2000 km s-1 and 6.7; Top panel of Fig. 6). The corresponding SSp in Fig. 6 has km s-1 and T5600 K.
The 32days He I profiles show rounded emission components that cannot be matched by a power-law SSp. As we have already mentioned, a detached line in a power-law assumption has a discontinuity in its optical depth (i.e. non-zero optical depth only above the ). When a profile retains a rounded P-Cygni emission component even if its is greater than , this might indicate two components of optical depth rather than only one above the photosphere. In such cases better fits could be obtained by having gradually decreasing optical depth below the detached velocity, instead of a discontinuity. In the present version of SYNOW, only an folding assumption of the optical depth allows a two-component treatment of a given line. We switch then to the exponential case adopting =3000 (see Sect. 2). For He I lines and below = 7000 km s-1 we introduce a second component with negative (2000 km s-1), such that “” is continuous at the detachment velocity (i.e. at 7000 km s-1). In this case and for similar situations, the line should not be defined as “detached”. Instead, it has a maximum value of “” that is not at the photosphere as is normal for an undetached line. The bottom panel in Fig. 6 demonstrates that the two-component optical depth reflects more probably the real situation of the He I lines in SN 1984L. The He I line fits seem better relative to the power-law case, although blueward 5500Å we obtain an inferior match.
In the 8days SSp, Si II is too blue to account for the 6250Å. We checked the undetached Ne I 6402Å line
possibility, assigning it an optical depth of 1.5.
It gives a profile broader than the observed one. In addition the coverage in wavelength of the spectrum hampers a
check whether Ne I lines produce unwanted features longward of 7000Å. Ne I lines would need to be non-thermally
excited as the case for He I lines in Type Ib (Lucy 1991; Swartz et al. 1993). With an optical
depth of 1.5, Ne I
would have a departure coefficient from LTE of about 15 (Hatano et al. 1999). Additionally, the low non-thermal
effects seen in He I lines of SN 1984L (see above) may argue against Ne I identification.
C II is also rejected since it will require a (CII)= 8000 km s-1 while at this phase (He I)=
2000 km s-1 (criterion 4). H remains then a plausible candidate. In Fig. 5, indeed,
(H)=0.65 and (H)= 7000 km s-1 provide a good fit, while at 32days we use
(H)=0.2 and (H)= 7500 km s-1 (Fig. 6).
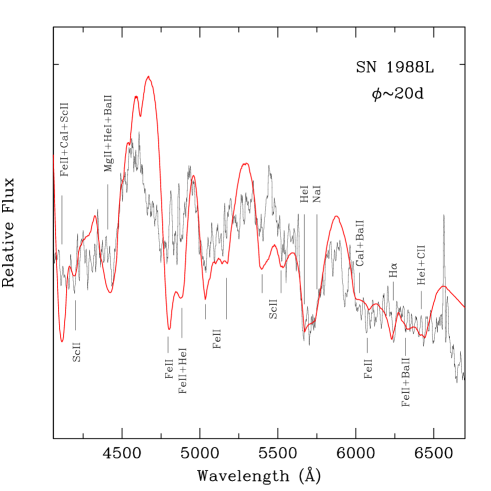
SN 1988L:
Figure 7 compares the observed spectrum at 20d with an SSp that has km s-1 and T9000 K. The observed spectrum has been smoothed with a box size of 5. Narrow emission lines due to H II regions are present in the spectrum. The object has been discussed and classified as a Type Ib SN (Filippenko 1988; Kidger 1988).
The strong and broad P-Cygni profile at 5550Å is well matched in our SSp by a blend of Na I and He I lines.
The He I 5876Å accounts for the blue edge of the broad trough, having (He I)= 3000 km s-1 and
(He I)=1, while undetached Na I has (NaI)=3. Ba II lines together with Ca I lines have been introduced
in the SSp and help the fit blueward 6000Å. Undetached Si II 6355Å is too blue to account for the trough
seen at 6250Å. We adopt H with an optical depth of 0.7 and (H)= 8000 km s-1.
Undetached C II 6580Å, (CII)=0.006, contributes together with He I blueward 6500Å (Fig. 7). SN 1988L may
be regarded as an intermediate Ib/c object rather than a typical Type Ib.
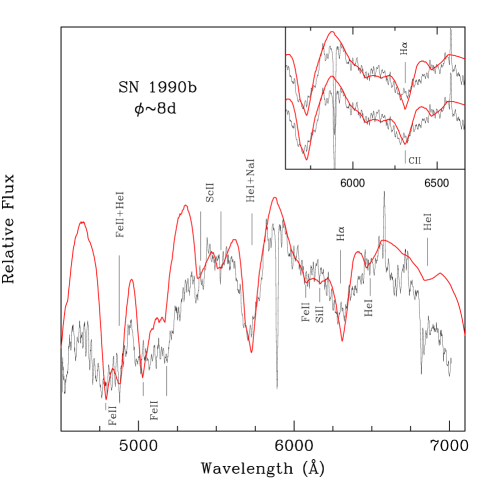
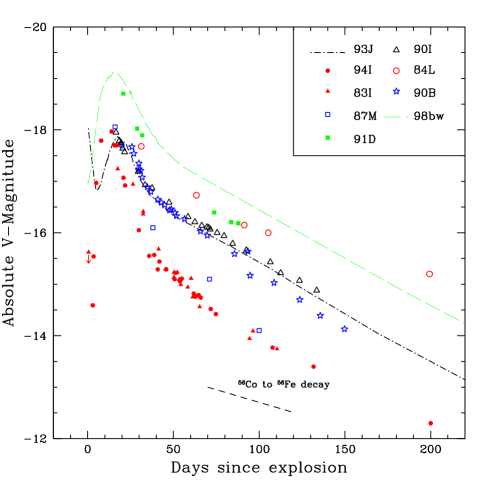
SN 1990B:
An extensive study of SN 1990B observations has been presented by Clocchiatti et al. (2001). The authors pointed out the red character of the object. This fact is supported in the present analysis, see below, by means of the estimated continuum temperatures that seem much lower than values at similar phases for the other Type Ib-c sample objects.
The spectrum at day 8 with the best fit SSp is presented in Figure 8. The SSp has km s-1 and T5400 K. Ions that are responsible for the most conspicuous features are indicated. The fit parameters have been modified many times in order to investigate line identification possibilities. The strong P-Cygni profile around 5700Å is a blend of undetached Na I and detached He I 5876Å ((He I)= 1500 km s-1 and (He I)=0.55). The expelled helium, with (He I)= 1500 km s-1, accounts nicely for the weak absorption near 6500Å. Undetached Si II 6355Å is considered to fit the weak absorption at 6200Å. The H line, (H)= 4500 km s-1 and (H)=0.5, is introduced to account for the broad observed absorption trough around 6300Å. The window in Figure 8 displays a zoom of the 6300Å region, together with the C II fit possibility ((CII)=0.0025). The fit looks as good as H, however it would need to be expelled with 3000 km s-1 more than the He I lines (i.e. (CII)= 4500 km s-1), and hence is ruled out (criterion 4).
The second spectrum, around day 30, is compared to an SSp that has km s-1 and T4000 K (Fig. 9). The presence of He I 5876Å is supported by two facts, first by the wide nature of the absorption trough that cannot be caused only by the undetached Na I D. Second, by the emergence of a “” around 5760Å, in the transition slope redward of the deep absorption trough at 5700Å. A closer view of the “He I+Na I” region is provided in the window of Fig. 9. The window demonstrates the contribution of both Na I D and He I 5876Å separately. The match is good and reproduces nicely the total feature seen in the observed profile. This tends therefore to confirm the presence of helium in the ejecta of this object, even though it does not exhibit a full and clear set of helium absorption lines. He I lines have (He I)= 3000 km s-1 and (He I)=0.8. On the other hand, Fe II lines with (FeII)=12, provide good fit in the blue part of the spectrum. In addition Fe II contributes significantly in the absorption at 6320Å. The presence of H is therefore not needed since the Fe II contribution is sufficient. Nevertheless if H were present it would have a (H)= 4000 km s-1.
Based on its spectroscopic properties, especially the weak He I lines, SN 1990B was re-classified as a Type Ic object
(Clocchiatti et al. 2001). It was first classified as Type Ib SN (Kirshner et al. 1990).
Clocchiatti et al. (2001)
presented an extensive set of well-sampled photometry. In Figure 10, we show the absolute Vlight curve of SN 1990B
compared to other SNe Ib-c. The comparison
highlights the similarity with Type IIb 1993J, SN Ib 1990I and SN Ib 1991D. The maximum brightness is comparable to
those of SNe 1990 I, 1987M and 1994I and intermediate between the bright SNe 1999bw and 1991D and the faint SN 1983I.
Moreover the figure reveals a similar decline rate, from maximum to reach the exponential decay, of SNe 1990B, 1990I,
1993J, 1991D and 1998bw and indicates
similar peak-to-tail contrast, whereas SNe 1983I, 1987M and 1994I display narrower peak widths and greater peak-to-tail
contrast. The events with steeper decline rates (i.e. narrow widths) and greater peak-to-tail contrast are classified
as Type Ic SNe, while SNe 1990I and 1991D are Type Ib events. This fact may point to a photometric behaviour closer
to Type Ib rather than Type Ic.
We regard, therefore, SN 1990B as an intermediate Type Ib/c event.
SN 1991ar:
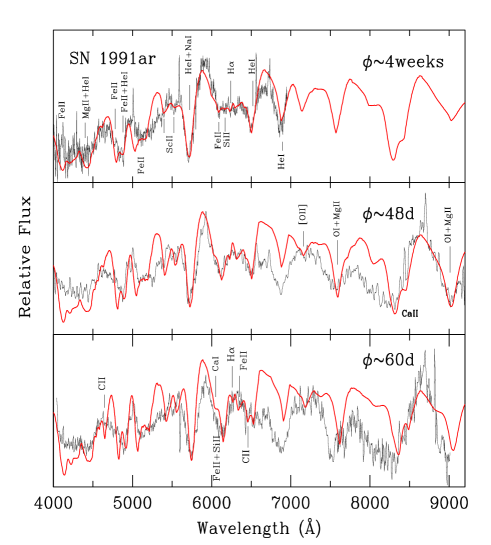
Figure 11 displays the available spectra of SN 1991ar at 3 different phases, namely 28days, 48days and 60days. The first spectrum is compared to an SSp that has km s-1 and T4400 K. The broad P-Cygni profile with the minimum trough centered at 5720Å is well fitted by the “He I+Na I D” blend. Although the spectrum covers only the Å wavelength range, it shows distinctly the He I series, indicating a Type Ib nature. The He I lines are undetached and have (He I)=10. One particularity of this spectrum is the flat behaviour of the 60706450Å range. We checked different ion combinations, and the best fit to that zone is reached including lines of Fe II, Si II and H. This latter has (H)= 8000 km s-1 and (H)=0.32.
For the 48day spectrum, the match is good with the SSp having km s-1 and T4800 K (Fig.11; middle panel). The He I lines are now slightly detached with (He I)= 1000 km s-1 and (He I)=4.8 Lines of O I and Mg II both contribute to the observed features around 7600Å and 9030Å ((OI)=3.5 and (MgII)=5), while the Ca II IR triplet is produced by (CaII)=500. The weak feature labeled as being due to H corresponds to (H)= 9000 km s-1 and (H)=0.4.
The bottom panel in Figure 11 shows the 60day spectrum compared to an SSp that has km s-1 and T4600 K. The 60806500Å range loses the flat behaviour seen in the first spectra and a round emission profiles start to form. The match in that part of the spectrum with the SSp is acceptable. The profile is mainly due to lines of Fe II, Si II, C II, H and Ca I. The He I fit corresponds to (He I)= 1000 km s-1 and (He I)=4.4, while H has (H)= 8000 km s-1 and (H)=0.28. Note that the two weak troughs due to the Sc II lines at 5527 and 5661Å appear near 5500Å in all 3 spectra. Another notable feature is the deficiency, in flux, of the observed spectra, in the middle and bottom figures, relative to the synthetic ones especially redward of 6500Å. This is possibly because the supernova already enters a transition phase to the nebular epoch.
Surely the evidence of H should not be taken as definite, although the corresponding weak absorptions in the
SSp nicely matches the observed features.
SN 1991D:
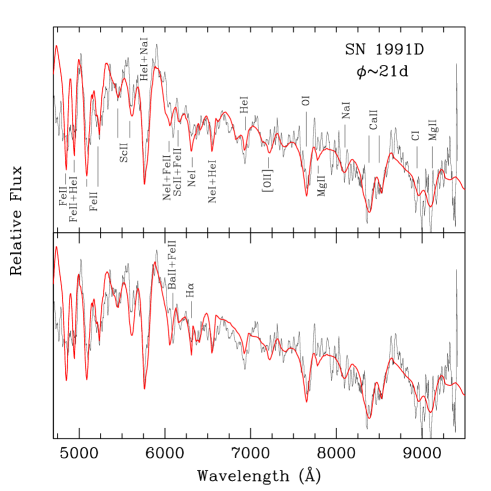
SN Ib 1991D data has been presented and studied by Benetti et al. (2002). The object, with its narrow features, seems having lower velocities compared to other Type Ib events at similar phases. When analyzing the 10day spectrum by means of SYNOW code, the authors obtained an improved match introducing undetached Ne I lines with respect to the H SSp fit. Figure 12 illustrates this possibility for the 21days spectrum. The displayed SSp has km s-1 and T7000 K. The He I lines are evident through our SSp ((He I)= 1400 km s-1 and (He I)=1.8). In addition, the Na I D feature ((NaI)=4) contributes to the He I 5876Å broad P-Cygni profile. The presence of Na I lines is consistent with the good fit around 8100Å. The most conspicuous line absorption features are indicated in the figure. In the top panel of Figure 12, undetached Ne I lines are included in the SSp ((NeI)=2). The match in the whole spectrum is quit good. In the bottom panel the H possibility is tested. Except for adding Ba II lines in order to help the fit at 6100Å, the other ion parameters are kept unchanged. The fit to the observed absorption near 6300Å with H, (H)= 7400 km s-1 and (H)=0.46, is slightly better compared to the Ne I case (Top panel). However the SSp, in the bottom panel, does not account for the observed features near 6630Å and 6840Å as does NeI lines in the SSp of the top panel. Ne I remains hence a strong candidate in this Type Ib object.
It is worth noting here that at a similar phase, i.e. 21days, SN Ib 1990I had a photospheric velocity of
9500 km s-1.
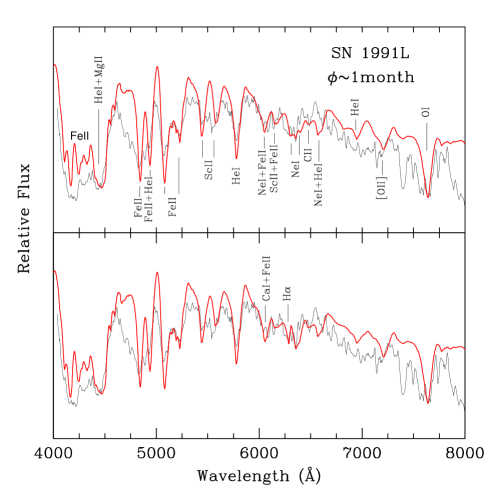
SN 1991L:
We study a spectrum dated about one month after maximum (Fig. 13). The spectrum has been smoothed with a box size of 3. The classification of this event based only on the shown spectrum is very tentative. Indeed the spectrum shows a short wavelength part reminiscent of Type Ia spectra. However, nebular spectra of SN 1991L have been found to display emission features that are normally found in Type Ib/c events (Gomez Lopez, 2002). The illustrated best fit SSp has km s-1 and T6000 K. The He I lines are not so obvious, although an undetached He I 5876Å line, (He I)=2, provides a good fit to the observed absorption trough at 5880Å. Na I D could contribute to that feature, although it would provide an absorption component slightly redshifted. We regard SN 1991L as a transition Type Ib/c object.
Similarly to SN 1991D, we tested the H and Ne I possibilities as a candidates for the feature near 6290Å. Figure 13 shows both cases. The included Ne I lines in the upper panel have (He I)=1, while in the lower panel H has (H)= 8000 km s-1 and (H)=0.34. Some features due to Ne I lines appear similar to the observed ones, which are not accounted for the H case (lower panel; Fig. 13). Compared to the lower panel, Ne I lines also improve the fit of the broad emission component of the He I 5876Å P-Cygni profile. Ne I remains therefore an alternative possibility to the H identification.
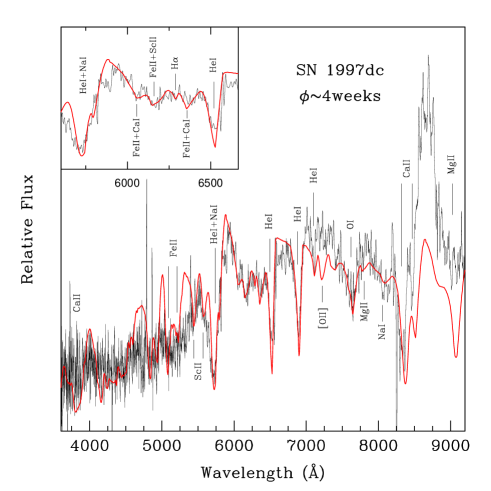
SN 1997dc:
The best SSp fit, km s-1 and T4200 K, is displayed in Figure 14 together with the observed spectrum (4 weeks since maximum). On the one hand, the match with He I series, (He I)= 2000 km s-1 and (He I)=2, is evident, confirming the classification as a Type Ib event. On the other hand and in order to obtain an improved fit to the He I 5876Å P-Cygni profile, undetached Na I D with =5 is needed. The identification of Na I is consistent with the absorption profile seen near 8090Å. Ca II IR triplet is unusually strong and the match to the synthetic one is rather poor. Sc II with =2 is responsible for absorption features blueward of the He I 5876Å, and contributes as well, with Fe II, near 6160Å.
A zoomed view of the 56006600Å region is shown in the window of Figure 14. The adopted SSp fits well the observed features. Various ion combinations have been tested, especially to explain the weak absorption at 6290Å. The best fit that would not introduce unwanted features in the rest of the spectrum and as well be in agreement with our previous criteria (Sect. 3.1) is attributed to H having (H)= 8000 km s-1 and (H)=0.2.
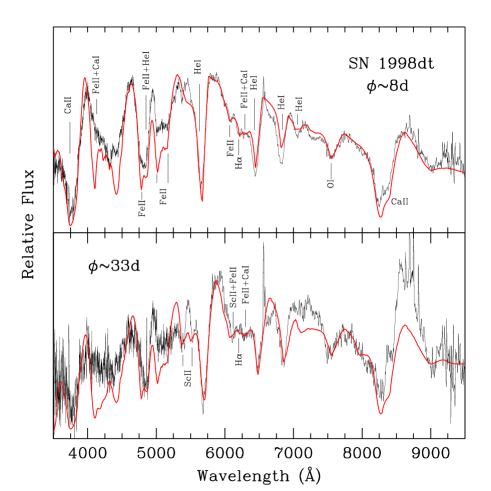
SN 1998dt:
Spectra at 2 phases, 8days and 33days, are shown in Figure 15 and compared with the best fitting synthetic spectra. The SSp in the upper panel corresponds to km s-1 and T5600 K, while for 33days, the SSp has km s-1 and T5000 K (lower panel). The SSp nicely match the features in the observed spectra. The narrow emission near 6565Å is due to H from H II region.
The reference Ca II line (i.e. at 3933Å) in the upper panel has an optical depth of 500. The corresponding Ca II HK and IR Ca II triplet (8542, 8662, 8498Å) SSp both fit well the observed broad P-Cygni profiles. For the 33day spectrum however, the Ca II infrared triplet (=500) presents a deficit with respect to the observed profile even though for the absorption part the fit is still acceptable. The O I 7773Å with =0.5 accounts for most of the observed feature at both phases (top and lower panels).
The He I lines are clearly evident for both phases, with the main difference that while at 8days He I lines are detached ((He I)= 2000 km s-1 and (He I)=4), they have non-zero optical depths starting at the photosphere for the 33day spectrum ((He I)= 0 km s-1 and (He I)=10). Note here that for both phases He I 5876Å is sufficient to fit the observed P-Cygni profile. There is no need to include Na ID line. The slope redward of the He I 5876Å emission component is nicely accounted for by lines of Fe II, Ca I and H at 8days, while for the 33day spectrum we introduce, in addition, lines of Sc II (=2). The presence of Sc II is supported by the double absorption features near 5390 and 5500Å.
The best SSp fit of the observed 8day spectrum includes only 6 elements, namely Fe II, He I, Ca I, Ca II, O I and H I. H, with = 8000 km s-1 and =0.3, accounts for the weak absorption near 6200Å. A similar but weaker absorption is seen in the 33day spectrum as well. We fit it with H that has = 8000 km s-1 and =0.2. It is clear that even though the fit is convincing, the presence of H is not definite. This limitation occurs whenever we deal with absorption features that are not so deep with respect to the continuum.
SN 1998T:
Spectra of SN 1998T at two different phases, 21days and 42days, are displayed in Figure 16 and compared to synthetic spectra having km s-1 and T5400 K (upper panel), and km s-1 and T5200 K (lower panel). The spectra are highly contaminated by weak emission features from an H II region. The absorption troughs caused by He I series are prominent, indicating a familiar Type Ib appearance. The He I line best fit at 21days corresponds to (He I)= 3000 km s-1 and (He I)=1.15, while at 42days (He I)= 2200 km s-1 and (He I)=0.75. The optical depth of the undetached Ca II is 120 (upper panel) and 140 (lower panel). The corresponding features, i.e of Ca II, fit well the observed ones although an excess in the emission P-Cygni components is visible, as is the case in most advanced photospheric spectra. C I, with =0.3, helps fit the absorption feature near 8930Å. Fe II lines are unusually weak for SN 1998T. Indeed, optical depths of 1 and 5 are respectively adopted for our best synthetic fits at 21days and 42days.
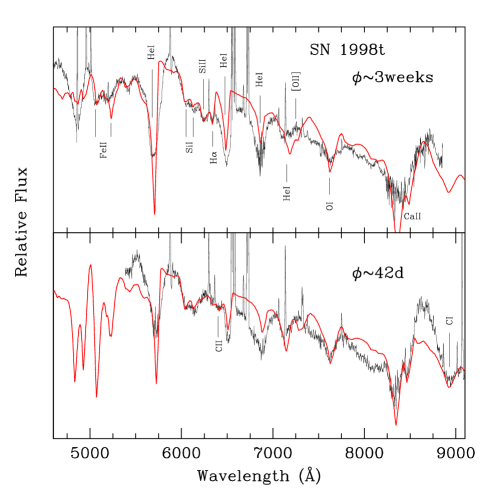
We checked different combinations for the 60006500Å wavelength range, testing the possible candidates and keeping in mind our departure criteria (Sect. 3.1). For the 21day spectrum, the best fit includes Si I(=0.03), Si II(=0.6), Fe II and H. This latter has (H)= 4500 km s-1 and (H)=0.34. When testing Ne I lines one obtains an improved fit blueward of the He I 7065Å feature, but then unwanted profiles in the 60006500Å region would be introduced. At low temperatures, an Si I identification is plausible in Type Ib objects within LTE assumption with low optical depths (Hatano et al. 1999). Si II however, is expected (in LTE) to have an optical depth of about 10 at temperatures similar to that for the 21day spectrum (helium-rich composition; Hatano et al. 1999). This would mean that we might have mis-identified the absorption feature near 6250Å, or we have a departure from LTE in the Si II line. Note that for Type II SNe, and at similar temperatures, Si II has an optical depth as low as 0.1 (hydrogen-rich composition; Hatano et al. 1999). The remaining possibility is that the 6250Å is due to H rather than Si II. In this case hydrogen would have (H)= 9000 km s-1, but then the absorption near 6340Å remains unaccounted for. To fit this latter with C II, we need then to impose a velocity of about =6000 km s-1, which means that carbon is expelled 3000 km s-1 greater than helium, contradicting our criteria (Sect. 3.1). The most acceptable combination is then the one illustrated in the top panel of Figure 16.
The situation for the 42day spectrum is more difficult as the spectrum is noisier. Our best fit includes
Si I(=0.025), Si II(=0.4), Fe II and C II (=2.310-4). We prefer C II, having in
this case similar as He I, rather than adopting H. First, because hydrogen would need then to
be expelled at velocities lower than helium, and second because we remain consistent with our criteria.
We propose that it was H at 21days which was then overwhelmed by C II later as the photosphere recedes
because of the envelope expansion.
SN 1999di:
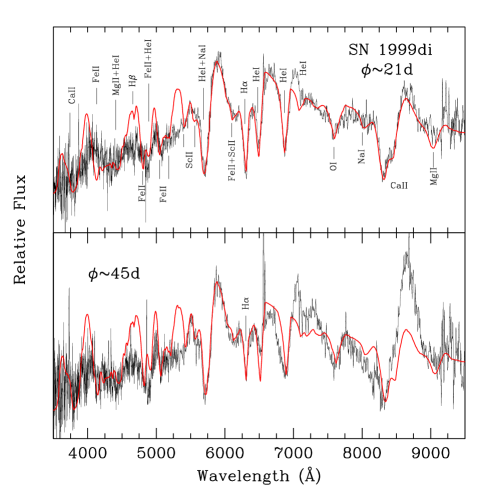
In Figure 17, the observed spectra of SN 1999di at 21days and 45days are compared to the computed synthetic spectra. The spectra are synthesized adopting km s-1 and T4800 K (upper panel) and km s-1 and T5200 K (lower panel). The match is good in the overall spectral shape. The fit to the He I lines is obvious. The parameters used are (He I)= 1500 km s-1 and (He I)=12.6 for the 21day spectrum, while at 45days the He I optical depth diminishes to (He I)=10, keeping the same contrast velocity (i.e. 1500 km s-1). For the 21day spectrum the optical He I lines (i.e. at 5876, 6678 and 7065Å) are simultaneously well accounted for by their corresponding absorption troughs in the SSp. Even the He I 7281Å line accounts for an observed absorption. At day 45, however, the SN displays a shallower He I 6678Å compared to the He I lines at 5876Å and 7065Å. At both phases, Na ID 5893Å is blended with He I 5876Å. The absorption near 8030Å is also accounted for by lines of Na I. The features blueward of the broad “He I+Na ID” P-Cygni profile are attributed to Sc II lines (=2 for both epochs). Sc II also helps the fit redward of the emission component of the blended “He I+Na ID” P-Cygni profile.
The O I 7773Å line, with =1, accounts for most of the observed feature. Note however that the line of
Mg II at 7890Å contributes in some cases to the red edge of the O I 7773Å line. In the present case this
contribution is not so relevant. In the upper panel, the Ca II IR triplet, with an optical depth of 700, fits very
well the observed profile. At day 45, the fit is under-estimated especially for the emission part, which may indicate
a transition to the nebular phase. The reproduced Ca II HK line is also strong in both synthetic spectra.
The issue of the 6300Å feature is particular in this object, because it is very deep and different from features
seen in “normal” Type Ib SNe. We have tested various identifications for the deep feature. The best
fit that would be consistent with our criteria attributes the trough to H with (H)=
5000 km s-1 and (H)=3 (upper panel), and (H)= 6000 km s-1 and
(H)=1.6. With these parameters and in addition to the almost perfect H fit, the SSp
accounts as well for the notch222The word ”notch” referes to a narrow and weak absorbtion feature.
seen near 4665Å, assigning it to H. The H trough is reminiscent
of what is seen in Type II and IIb objects, with the difference that in these latter types H displays a
complete P-Cygni profile (i.e. with both conspicuous emission and absorption components). This is understandable
within the context of “detachment” concept. Indeed, Branch et al.(2002) have shown that an H P-Cygni
profile loses its obvious emission component when it is highly
detached. If correct, we would then expect an
increasing value of (H) as we go from Type II to IIb to Ib SNe. This point will be emphasized
and discussed at the end of the paper.
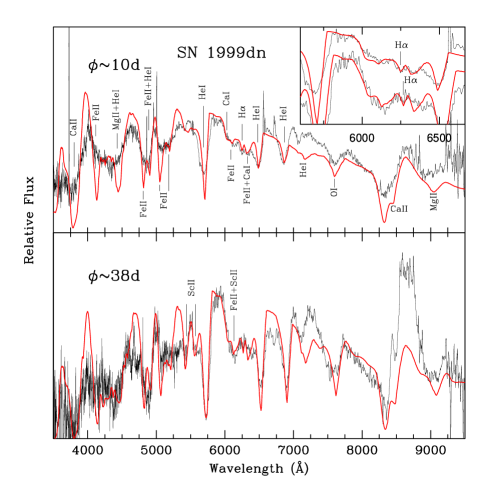
SN 1999dn:
Two spectra of SN 1999dn, observed at 10 and 38 days after maximum light, are compared in Figure 18 to synthetic spectra that have km s-1 and T5800 K (upper panel) and km s-1 and T5400 K (lower panel). As shown in both panels, the prominent lines of He I 5876, 6678 and 7065Å are clearly accounted for, indicating a typical Type Ib nature. The fit to the He I reference line corresponds to (He I)= 2000 km s-1 and (He I)=1.9 at day 10, and (He I)= 1000 km s-1 and (He I)=14.5 at day 38. A spectral analysis of SN 1999dn has been also presented by Deng et al. (2000). The authors discussed line identifications for 3 photospheric spectra (at -10, 0 and 14 days from maximum). The observed trough at 6250Å was first blended with He I 6678Å for the -10day spectrum, while around maximum light the two troughs become distinctly isolated, giving rise to a double absorption profile (Fig. 2; Deng et al. 2000), very similar to what is seen in SN 1990I (Fig. 1), although the two events evolve afterwards in different ways, with the 6250Å feature being less deep in SN 1999dn than in SN 1990I later on. The authors found it difficult to attribute the minimum near 6250Å to Si II 6355Å. They argued that it was H first, before maximum, that becomes blended and overwhelmed by C II line in later spectra. For the two early spectra, i.e. at -10days and maximum, C II 6580Å provides a fit as good as H, however C II 6580Å is assigned a minimum velocity much higher than the one attributed to He I. Highly detached C II lines are surely improbable in this class of event. Even in their late spectrum (i.e around 14days), the C II has a value of higher than that of He I.
We analyzed various possibilities among line candidates for our 10 and 38 day spectra. The wavelength range of
interest, Å, is zoomed in the window of Figure 18. We find that the best fits which would
reproduce the weak absorption features and not contradict the fit criteria,
include lines of He I, Fe II, Ca I and H. This latter accounts nicely for the absorption near 6260Å with
(H)= 8000 km s-1 and (H)=0.24 (at 10days), and
(H)= 8000 km s-1 and (H)=0.34 (at 38days).
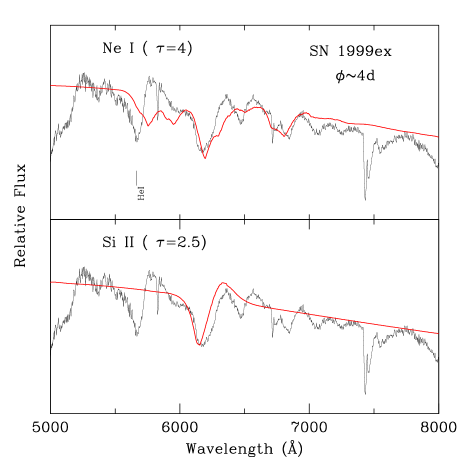
SN 1999ex:
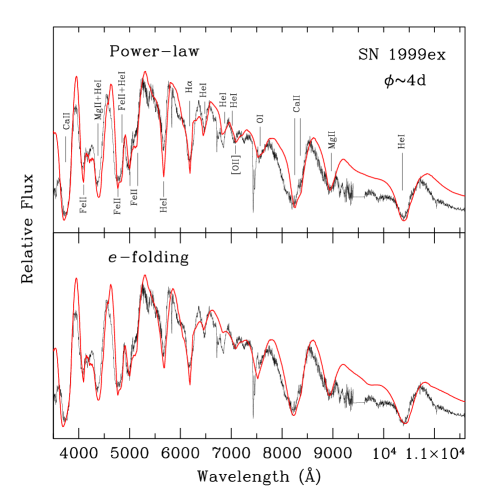
A good set of early data for SN 1999ex, spectra and photometry, have been presented by Hamuy et al. (2002). The quality of the photometry, starting well before maximum light, offers a unique possibility of looking at the early behaviour of light curves. Indeed, the early seen in the and light curves is interpreted as being due to the shock breakout, supporting the present belief that Type Ib-c SNe are the outcome of core collapse in massive stars rather than thermonuclear disruption of white dwarfs (Hamuy et al. 2002; Stritzinger et al. 2002). Because of weak optical He I lines, the object was classified as an intermediate case between Ib and Ic SNe. The evident trough at 6250Å was attributed to Si II 6355Å (Fig. 4; Hamuy et al. 2002). The authors also presented three infra-red spectra.
We analyze, by means of synthetic spectra, line identifications in this interesting object. The two observed spectra, around 4 and 13 days, are compared with our best fit SSp that have km s-1 and T5800 K (Fig. 19) and km s-1 and T5600 K (Fig. 22). In Figure 19, we combined the IR spectrum with the optical one in order to check the consistency of He I identification. In fact, at 4days, assigning the following parameters: (He I)= 1000 km s-1 and (He I)=2.35, we obtain a good match to the observed He I profiles. On the one hand, a strong support for the presence of He I lines comes from the good fit to the IR He I 10830Å. Furthermore, in figure 20 the fit is extended beyond 1 micron. The good match to other He I-IR lines, adopting equal (He I) and (He I) as in the optical part of the spectrum, is clear and provides unambiguous evidence for the presence of helium in this event. The OI 7773Å line with =0.5, on the other hand, is found to be not so strong and deep as is the case in most Type Ic events (Matheson et al. 2001). These two facts point to a Type Ib nature, more than a Type Ic class.
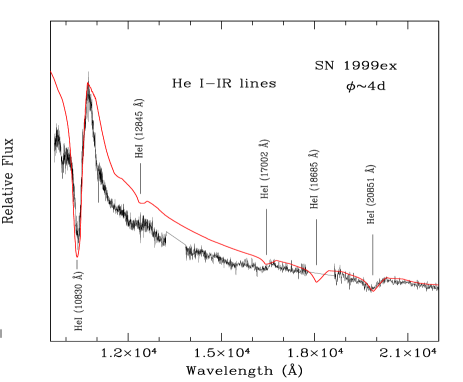
In the lower panel of Figure 19 we test the exponential case (see details in the “SN 1984L” part; Sect 3.1). We assign two components to the He I lines: one above = 11000 km s-1 with 3000 km s-1 and one below = 11000 km s-1 with negative (2000 km s-1), such that is continuous at the detachment velocity (i.e. at 11000 km s-1). The fit is slightly improved for He I lines at 5876Å and 10830Å and also for the IR triplet Ca II.
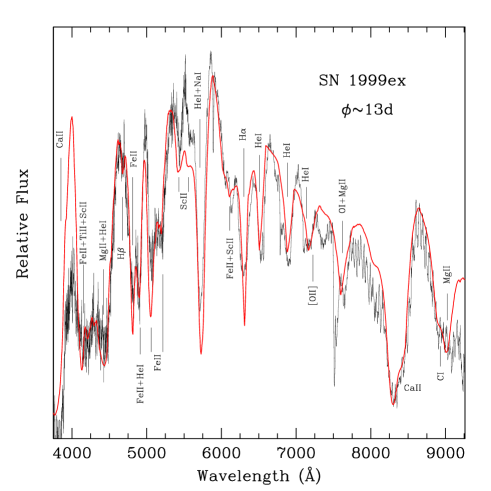
As far as the trough around 6250Å is concerned, we checked the Si II identification attributed by Hamuy et al.(2002). We test as well the Ne I possibility. The closer view in Figure 21 illustrates the two possibilities. In the upper panel undetached Ne I lines can fit the feature, however they would introduce unwanted features in the rest of the spectrum. Furthermore, because of the depth of the observed trough, a good match with Ne I 6402Å would require an optical depth of 4, indicating a departure factor from “LTE” of 40 (Hatano et al. 1999), highly improbable although non-thermal excitation of Ne I needs to be more thoroughly investigated (i.e. through NLTE and hydrodynamic SSp codes). The Si II possibility is shown in the bottom of Figure 21. The undetached Si II 6355Å, with 2.5, is rather blue to account for the feature. We note here that if one adopts C II 6580Å, then one needs to assign it a very high velocity, about 8000 km s-1 higher than the one of He I. The most likely identification therefore remains H. In fact the best fit in Figure 19 is achieved using (H)= 8000 km s-1 and (H)=1.45, while for day 13 H has (H)= 5000 km s-1 and (H)=1.6 (Fig. 22). The match at both phases is quite good. The other lines responsible for shaping the spectra are labeled in the figures. In addition to the convincing match to lines of He I, IR-Ca II, O I, Fe II we note the presence of a weak absorption near 4680Å that is well accounted for by H in our 13days SSp (Fig. 22). This can be taken as support for the presence of hydrogen expelled at high velocities in this supernova.
It would have been of great interest to look at later spectra of this object, in order to see how the trough assigned to H would evolve with time.
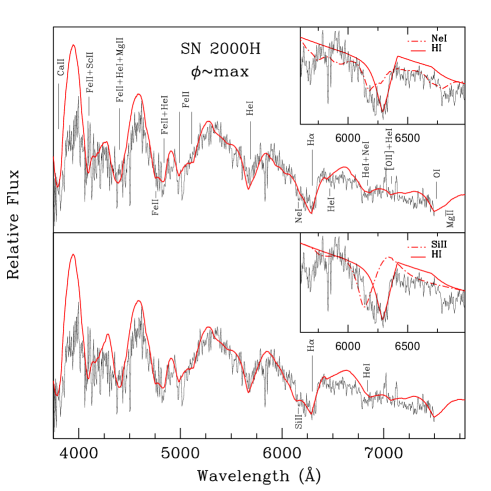
SN 2000H:
The Type Ib SN 2000H is considered one of the more interesting Ib-c objects, especially with a strong and deep trough near 6300Å (Benetti et al. 2000; Branch et al. 2002). Here we analyze three spectra at different epochs, namely at maximum light, 19days and 30days. Figure 23 compares the observed spectrum around maximum with the resulting best fit SSp which has km s-1 and T10000 K. The overall match is quite good. Undetached He I lines, with 2, provide a good fit with the He I 5876Å, while features assigned to He I lines 6678Å and 7065Å are very weak. The absorption trough near 6280Å is exceptionally broad and cannot be accounted for only by H. We identify two possibilities for which we obtain a broad absorption in agreement with the observed feature. The upper panel in Figure 23 shows the “H+Ne I” combination, while in the lower panel the “H+Si II” combination is illustrated. In both panels a closer view of the 6280Å region is displayed in the window. In the first case, undetached NeI with 1.5, a contribution blueward of He I 7065Å improves the fit with the observed feature, however the He I 5876Å emission component is under-estimated. Note that the narrow absorption in the emission peak is attributed to Na ID interstellar line originating in the parent galaxy. In the lower panel, undetached Si II (3) improves the match with the observed absorption trough without altering the resulting SSp at the emission part of the He I 5876Å P-Cygni profile. As a result we believe that the“H+Si II” combination is the most probable.
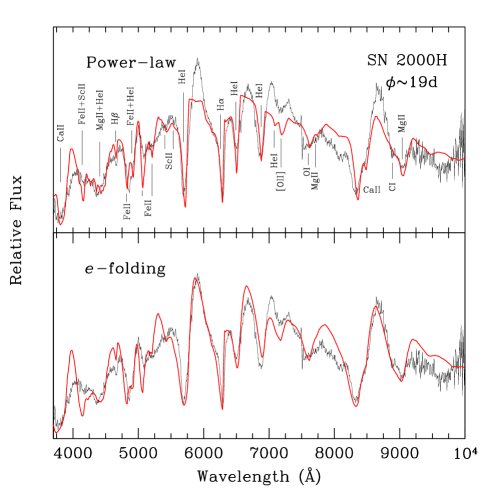
Figures 24 and 25 compare spectra at 19 and 30 days with their corresponding best fit SSp. These have km s-1 and T4600 K (Fig. 24) and km s-1 and T6000 K (Fig. 25). The two spectra are similar in having narrower features than the maximum light spectrum, resulting from observing at smaller radii where expulsion velocities are lower. Lines of Ca II, [O II], O I, Mg II are seen to develop. Introducing Sc II lines helps to form a feature blueward of the strong He I 5876Å P-Cygni profile. A distinct feature appears redward of the IR Ca II profile, more evident in the 30day spectrum, and is accounted for by C I (0.2 at 19days and 0.8 at 30days). The noticeable change compared to the spectrum at maximum is the development of the He I 6678Å and 7065Å troughs. The He I reference line has (He I)= 2000 km s-1 and (He I)=5 at day 19, while at day 30 the corresponding He I parameters are (He I)= 2000 km s-1 and (He I)=3.4.
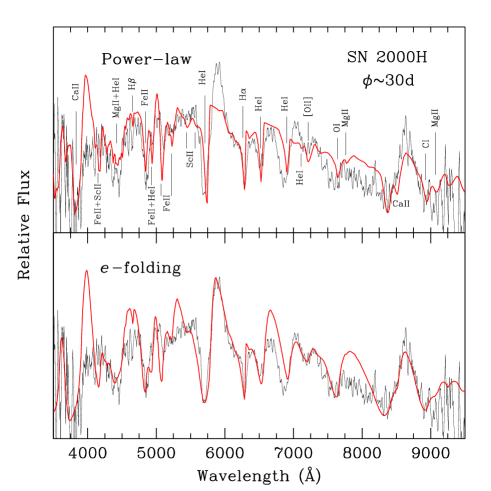
Similarly to what is seen in the case of SN 1984L, the He I profiles retain rounded emission components that cannot be matched by a power-law SSp. We tried to improve the He I fits by switching to the folding assumption for the optical depth, introducing a continuous two-component behaviour of the He I optical depth: one above = 8000 km s-1 with 3000 km s-1 and a second component with negative (2000 km s-1), such that is continuous at the detachment velocity (i.e. at 8000 km s-1 for the 19day spectrum and 7000 km s-1 for the 30days one). It is important to recall here that the line should not be said to be “detached”. It has however a maximum value of that is not at the photosphere as is ordinarily the case for an undetached line. The bottom panels in Figures 24 and 25 illustrate the resulting synthetic spectra in the folding cases. The fit is somewhat improved compared to the power-law case. The noticeable improvements concern in particular the He I features and the infra-red Ca II profile. We note the good match to the 6250Å trough with H. The best fit is achieved using (H)= 7000 km s-1 and (H)=2.5 at day 19 (Fig. 24), while for day 30 H has (H)= 8000 km s-1 and (H)=1.45 (Fig. 25). No alternative identification to H, that would be logically acceptable, has been found. In addition, the H identification is strongly supported by the presence of the absorption notch near 4660Å, well accounted for by H in our resulting synthetic spectra.
3.2 Type Ic SNe: the representatives
SN 1987M:
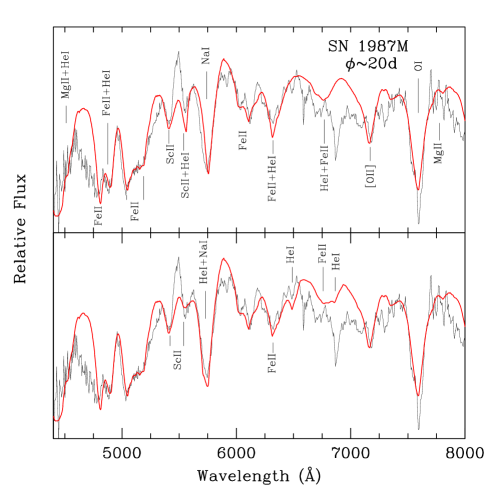
In Figure 26 the observed spectrum of SN Ic 1987M, near day 20, is compared to the generated SSp with km s-1 and T4500 K. The OI 7773Å trough is clearly deep and is well matched with our SSp (5). Identifying He I lines in this object is problematic and was a subject of different investigations (Jeffery et al. 1991; Clocchiatti et al. 1996b). In fact, Jeffery et al. (1991) have presented a synthetic-spectrum analysis around maximum and came to the conclusion that He I lines may be present. In addition they also claimed the presence of a weak H trough. In our SSp-LTE approach applied to the 20day spectrum, we tested two possibilities for He I identification, namely He I lines at high velocity ((He I)= 10000 km s-1; (He I)=0.16) and a lower velocity case ((He I)= 2000 km s-1; (He I)=0.6). The upper panel in Figure 26 corresponds to the first case, in which the strong P-Cygni profile at 5750Å is due to Na I line alone. The high velocity He I 5876Å then contributes to the trough blueward of the Na I profile. The undetached Sc II lines are in part responsible for the two absorption features indicated in the plot ((ScII)=0.7). The other He I optical lines, at 6678Å and 7056Å, both contribute to the strong Fe II features ((FeII)=22). In the low velocity case (Fig. 26; lower panel) a weak He I absorption at 6500Å appears, which provides a better match to the observed spectrum, as does “He I+Na I D” at 5750Å. It is not simple to decide which fit to adopt from analyzing only one spectrum. The two possibilities seem plausible and both indicate the presence of He I lines in SN 1987M at the age of 20 days.
We find no need to include either Si II and/or C II or H. We note however that Si I lines may help to fit
the deep trough around 6900Å, but they would introduce then various unwanted features in
the rest of the spectrum.
SN 1994I:
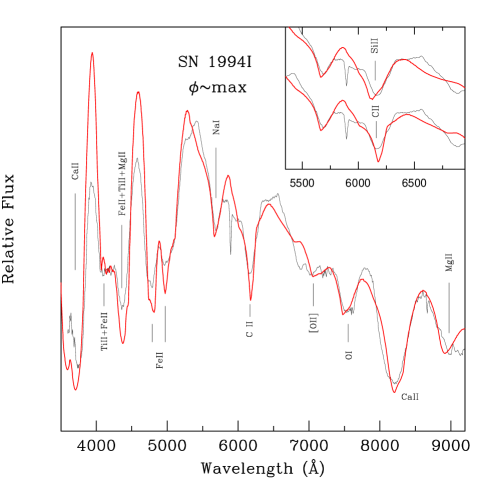
SN 1994I is considered the best observed “normal” Type Ic event. Various works have presented detailed analysis of line identifications in this object (Wheeler et al. 1994; Filippenko et al. 1995; Clocchiatti et al. 1996b; Millard et al. 1999). The most controversial issues concerned traces of H and He in the early spectra. Filippenko et al. (1995) have attributed the observed absorption feature near 10250Å to the infrared He I 10830Å, arguing for the presence of helium in the ejecta of SN 1994I. Millard et al. 1999, however, clarified the related issues by means of synthetic spectra. One of the most important results was the incompatibility of the simultaneous fit of the 10250Å observed feature with He I 10830Å and with the optical He I lines. Contrary to the case of SN 1999ex (see Fig. 19), trying to account for the observed absorption near 10250Å with He I 10830Å introduces too strong He I features in the optical region (Millard et al. 1999). Even with a NLTE synthetic spectra analysis, Baron et al. (1999) were not able to reproduce the 10250Å infrared feature assuming it to be the He I 10830Å line. Instead, the feature in question may be accounted for by lines of C I and/or Si I (Baron et al. 1999; Millard et al. 1999).
Figure 27 compares the observed spectrum around maximum with an SSp that has km s-1 and T7000 K. The match is quite good. The trough near 5700Å is accounted for by the undetached Na ID line (). The other prominent features are well described by lines of Fe II(), Ca II(), O I(), [O II](). Lines of Mg II, , have been introduced to help the fit blueward the IR-Ca II P-Cygni profile. Lines of Ti II, , are also considered to help the fit in the 40004500Å region.
Concerning the feature near 6180Å, it was difficult at some epochs in the spectra presented by Millard et al.
(1999), to decide between detached C II 6580Å and undetached Si II 6355Å. Moreover, at -2days and -4days, the
authors obtained a better fit with a combination of the two. In the spectrum
displayed in Figure 27 we test the two possibilities, namely undetached Si II () and detached C II
(= 8000 km s-1; =1.710-3). A closer view of the region of interest is
displayed in the window. We found Si II somewhat too blue to account for the observed feature. There is no need
at this epoch to combine the two lines. Therefore we prefer detached C II as the more probable.
SN 1996aq:
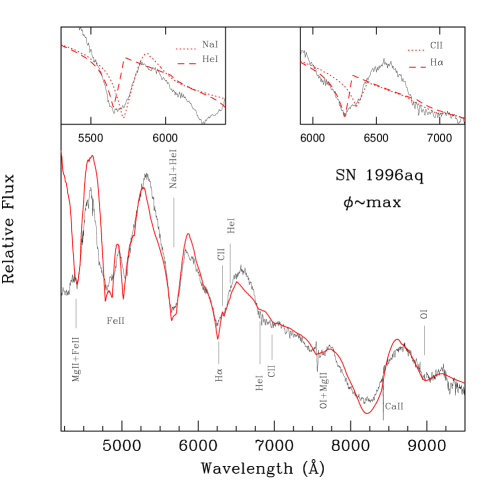
We analyzed two photospheric spectra of SN 1996aq, namely one near maximum light and one at 24days. The supernova has been classified as Type Ic SN near maximum when first observed (Nakano et al. 1996). The observed spectrum near maximum is compared, in Figure 28, with a synthetic spectrum that has km s-1 and T9000 K. The SSp accounts for almost all the conspicuous features, namely IR-Ca II, Fe II, O I and Mg II. The trough near 5680Å appears broader than usual. To account for this absorption feature we use a combination of undetached Na ID () and detached He I (= 3000 km s-1; ). The resulting profile fits nicely the broad trough (left window in Fig. 28). The absorption features due to the He I lines 6678Å and 7065Å are too weak to be clearly seen as indicated in Figure 28. Concerning the 6300Å feature, while Si II is found to be too blue, we find that a combination of C II (= 2500 km s-1; ) and H (= 6000 km s-1; ) provide a satisfactory fit. On the one hand, the weak feature near 6330Å is produced by the minimum of the C II 6580Å absorption. This possibility is illustrated in the right window of Fig. 28. On the other hand, a weak absorption in the emission feature near 4560Å could be due to H although the H optical depth seems too small for H to be plausible.
Alternatively, if we try to fit the 6300Å feature by only C II, then this latter should be expelled at very high velocity, even more than helium. Moreover, in this way we could not produce the notch near 6330Å. We regard the “C II+H” combination as the more probable. However a final confirmation of this is still not beyond doubt. The identification of H in Type Ic was a subject of different discussions (Jeffery et al. 1991; Filippenko 1992; Swartz et al. 1993; Wheeler et al. 1994; Branch 2003). Generally the identification of H in early spectra of some SNe Ic objects (exp. SN 1987M and SN 1994I) has not been accepted. In SN 1987M for example the measured velocity for H was suspiciously low compared to calcium and oxygen. In the case of SN 1996aq we find a different situation, since the expansion velocity attributed to H is the highest (i.e. higher than C II and He I while the other lines are all undetached). It would be interesting to have more detail for this object and to have a larger sample of early spectra of Type Ic objects.
Figure 29 compares the 24day spectrum to the SSp that has km s-1 and T5000 K. Ions that are responsible for the most conspicuous supernova absorption features are indicated. The match is good. Note both the strong Ca II infrared triplet and Ca II HK are well produced in the SSp. Ni II helps the fit longward of the Ca II HK profile. The double absorption feature near 9000Å is well produced by undetached lines of C I() and Mg II(). Lines of O I and [O II](at 7321Å) are also introduced to account for features near 7640Å and 7220Å, respectively. A noticeable feature of the SN at this phase is the clear appearance of He I lines, that question the classification of SN 1996aq as Type Ic object. The broad P-Cygni profile with the absorption minimum near 5720Å cannot be accounted for by Na ID alone. We favour He I 5876Å because it implies other observed features, especially the He I lines at 6678Å and 7065Å. He I lines in the SSp are produced adopting = 2400 km s-1 and .
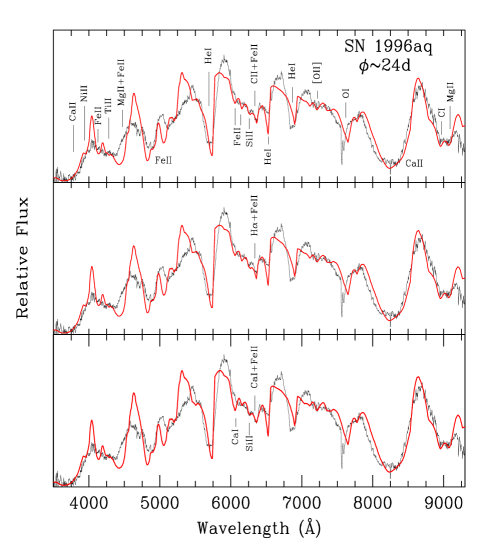
The slope in the 59506450Å wavelength range does not contain conspicuous features although it has some weak absorptions, reminiscent of what is seen for example in SNe 1984L and 1998T at similar phases. We regard SN 1996aq as a transition object between Ib and Ic, rather than a Type Ic event. We have checked different line combinations in order to decide which ions to introduce to fit the 59506450Å region, and especially the feature near 6355Å. The different panels in Figure 29 illustrate these possibilities. In fact, while lines of Fe II and Si II(undetached) provide a good fit to the observed features, we find it difficult to decide between C II, H and Ca I to account for the absorption near 6355Å. The three cases correspond respectively to: C II with = 5400 km s-1 and (upper panel); H with = 4900 km s-1 and (middle panel); undetached Ca I with (lower panel). The Ca I case, lower panel, produces an unwanted absorption trough near 6060Å. For the C II case, upper panel, the element is assigned a velocity 3000 km s-1 greater than the one of helium, which is hard to accept. Therefore the most probable situation remains the case of the high velocity hydrogen (middle panel).
3.3 Type IIb SNe: the representative
SN 1993J:
The discovery of the Type IIb SN 1993J has created a link between SN Ib-c and Type II objects, creating and extending our understanding of the physics of core-collapse. At early phases, this SN displays conspicuous hydrogen Balmer features similar to Type II SNe. At the nebular phase however, the spectrum shows many signatures of Type Ib-c SNe, namely strong oxygen and calcium lines (Filippenko et al. 1994; Lewis et al. 1994; Matheson et al. 2000). Furthermore, the analysis of late epoch spectra reveals that traces of hydrogen (i.e. H in emission were still present (Patat et al. 1995). Another well observed SN belonging to Type IIb class is SN 1996cb. By comparison with SN 1993J, SN 1996cb showed Balmer lines with stronger P-Cygni profiles. In addition, the photosphere of SN 1996cb receded faster than its counterpart in SN 1993J and the He I features (in absorption) appeared earlier, around day 24 in SN 1993J and near maximum light in SN 1996cb (Qiu et al. 1999; Deng et al. 2001).
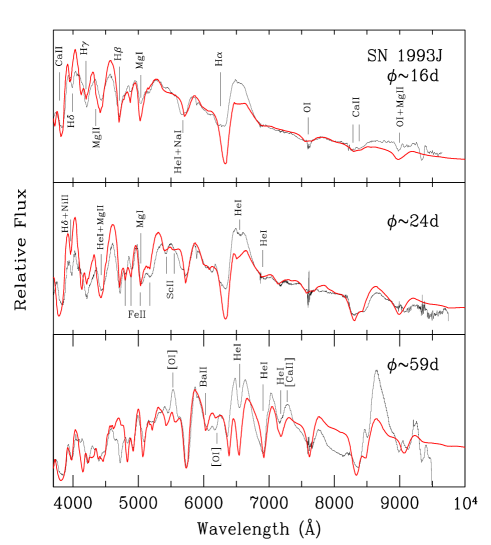
We have analyzed spectra at three different epochs for SN 1993J, namely at 16, 24 and 59 days. Figure 30 displays our best fit spectra compared to the observe ones. The plotted synthetic spectra have km s-1 and T7800 K (16days; upper panel), km s-1 and T7000 K (24days; middle panel) and km s-1 and T5000 K (59days; lower panel). The fit to the 16day spectrum is good, except the H profile. The corresponding strong and broad P-Cygni feature cannot be produced completely by the “SYNOW” code. This is because in our SSp treatment we are adopting a resonance scattering source function. The hydrogen reference line has = 1000 km s-1, while an optical depth of is used. Profiles of H, H and H are clearly discernible. The P-Cygni profile around 5700Å is assigned to He I 5876Å, with a small contribution from Na ID. The other optical He I lines are not visible at this phase. The helium is found to be undetached and has a moderate optical depth of 0.6. The shallow IR-Ca II triplet is fitted adopting . The observed Ca II HK is nicely reproduced in the SSp.
As the supernova evolves, the IR-Ca II profile becomes clearer (Fig. 30; middle panel). At this phase an optical depth of is used. Fe II lines are also clearer compared to the 16day spectrum ( at 16days and at 24days). The notch appearing on the emission component of H is attributed to He I 6678Å. Helium is still undetached with an optical depth of 1.5. SN 1996cb at a similar phase, near 25days, has more evident He I lines compared to SN 1993J, especially the lines at 6678 and 7056 (Fig 2; Deng et al. 2001). In fact, its 25day spectrum resembles the 59day spectrum of SN 1993J rather than the 24days one. The He I lines at day 59 are prominent (Fig. 30; bottom panel). The He I reference line is undetached and has . The corresponding SSp fit is quite good for the 5876Å line, while it is difficult to obtain a good match with the other optical He I lines.
Hydrogen Balmer lines become weak at this phase. Ba II lines are introduced to improve the fit just blueward of He I 5876Å (). At this phase, forbidden emission lines develop, indicating the transition to the nebular phase (exp. [O I] 5577Å , [O I] 6300,64Å and [Ca II] 7291,7324Å; bottom panel). The O I 7773Å absorption profile is reproduced at the three different epochs by (at 16days), (at 24days) and (59days). Ni II lines are also introduced in the 24days and 59days synthetic spectra, blended with H, to improve the match with the observed weak absorption on the Ca II HK emission component.
3.4 Type II SNe: the representative
SN 1999em:
As a representative of the Type II class, we have analyzed SN 1999em. The well sampled observations, spectra and photometry, have been presented and studied by Elmhamdi et al. (2003). The event shows characteristics typical of a Type II-P object, namely clear and broad Balmer P-Cygni profiles and a plateau phase of almost constant luminosity in the optical.
Figure 31 displays two spectra during the photospheric phase. For comparison with other events of our CCSNe sample, the phases are normalized to maximum light in Type Ib-c SNe, adopting 16 days as the rise time to reach maximum. The observed spectra are compared to the best fit synthetic ones that have km s-1 and T10000 K (-6days; upper panel) and km s-1 and T6400 K (25days; lower panel). Synthetic line features are designated according to the ion whose line gives rise to the feature (Fig. 31). At the earliest phase, i.e. -6days, only three elements are introduced in the SSp model. Indeed undetached lines of Balmer hydrogen, He I and a weak contribution from Ca II are almost sufficient to reproduce the most conspicuous features superimposed on the “hot” continuum. The fit with Na I D, at this phase, is poor compared to He I 5876Å. Moreover He I contribution, in Type II SNe, is found to be important shortly after the explosion. In fact in SN 1987A, the He I 5876Å feature was clearly present during the first few days, then owing to the decreasing envelope-temperature it rapidly faded and disappeared completely around 1 week after the explosion, when Na I D starts to emerge (Hanuschik Dachs, 1988). Baron et al. (2000), in analyzing very early spectra of SN 1999em, have found evidence for helium enhanced by at least a factor of 2 over the solar value. The interpretation of the He I strength in terms of helium-overabundance is however premature, since freeze-out effects were not considered and could lead to the enhanced helium-excitation compared to the steady-state model (Utrobin & Chugai 2002).
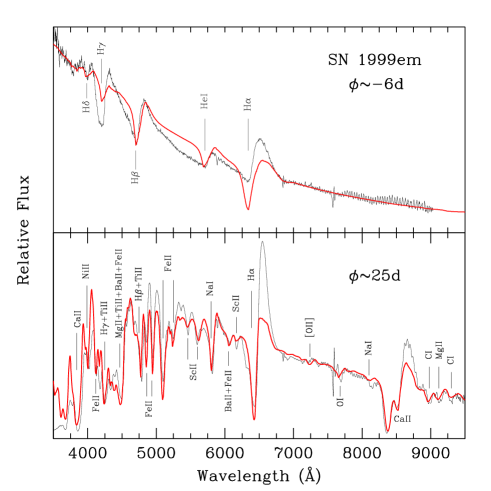
Balmer hydrogen features, with , are clearly evident. As in the case of SN 1993J, we cannot reproduce the full observed H profile for the same reason. At day 25, H P-Cygni profile becomes narrower because of the decrease in the expansion velocity (Fig. 31; bottom panel). H in the SSp has now = 1000 km s-1 and . The envelope temperature decreases and many lines emerge at this phase. Apart from the hydrogen lines (slightly detached), all the lines are undetached. The match with almost all observed features is good. The Ca II HK and IR-Ca II are nicely reproduced. A few distinct absorption lines redward of the near infrared Ca II triplet are identified as C I, , through our spectral synthesis. Sc II lines, , account rather well for features near 5450, 5600 and 6170Å. The blue part of the spectrum, Å, is subject to severe line blending, but it seems well matched with contributions from lines of Fe II(), Ni II(), Ti II(), Ba II(), Mg II(), Ca II and hydrogen. The feature near 7670Å is attributed to O I 7773Å(), while there may be a contribution from [O II] around 7230Å.
4 Spectroscopic mass estimates
In the following we adopt two methods in order to obtain rough estimates of some ejecta masses (i.e. the total ejecta mass and/or a given element mass). The methods use the results from our spectral best-fits.
4.1 Method 1
We compare the optical depths derived from our best-fits to the optical depth plots for different compositions presented in the work by Hatano et al.(1999), making sure of course that the same reference lines are used. In that paper the authors presented a systematic survey of ions that could be responsible for supernova features in six different compositions. The LTE optical depth of each reference line, of a given ion, is computed and then plotted against temperature. We focus on the ratio of hydrogen to helium optical depths, i.e (H I)/(He I), attempting thereafter to translate this ratio into a relative abundance of the two elements. This is important as it can give us a rough idea about the amount of hydrogen present in these objects. The optical depth ratio is assumed to trace the abundance ratio of the two elements. This is essentially due to the fact that the -calculations of Hatano et al. (1999) adopted a fixed electron density. The (H I)/(He I) ratio, indeed, depends on electron density, temperature and hydrogen to helium abundance ratio. Therefore for a given temperature, the (H I)/(He I) ratio depends in principle only on the abundance ratio. We must remember however that the “-plots” are for LTE, with no allowance for non-thermal excitation is made. For helium, for example, non-thermal excitation effects are significant in developing He I features (Lucy 1991). More detailed estimates might take this effect into account, if one has a clearer understanding of outward mixing of radioactive material.
For SN 1990I around maximum and according to our best SSp fit, the optical depth ratio, evaluated
at the same velocity333The optical depths reported in Table 2 are evaluated at the detachment
velocity of the corresponding reference lines (e.g. for SN 1990I at maximum (H I) at
16000 km s-1and (He I) at 14000 km s-1).
For a “” power-law, the optical depth of He I evaluated at the same velocity of H I is then:
(HeI)= 2.9(14/16) 1.0,
is measured to be
(H I)/(He I)0.6. At similar high temperatures (i.e. 14000 K), one obtains a value of about
40 for that ratio according to the optical depth plots of different ion reference lines for
a hydrogen-rich composition in Hatano et al. (1999) (see their Fig. 2). In addition, in the cited work the
(H I)/(He I) ratio remains
almost constant at high temperatures, then it starts increasing once the temperature decreases. For example
around T10000 K, the ratio is about 80. Near 9000 K, however the ratio reaches a value of about 1000.
These values (i.e. 40, 80 and 1000 at their corresponding temperatures)
correspond to a factor of 10.23 in abundances between hydrogen and helium (Table 1; Hatano et al. 1999).
Assuming proportionality, we obtain then a rough estimate of the hydrogen to helium relative-abundance for the
case of SN 1990I around maximum. In fact a relative abundance of 0.15 is found.
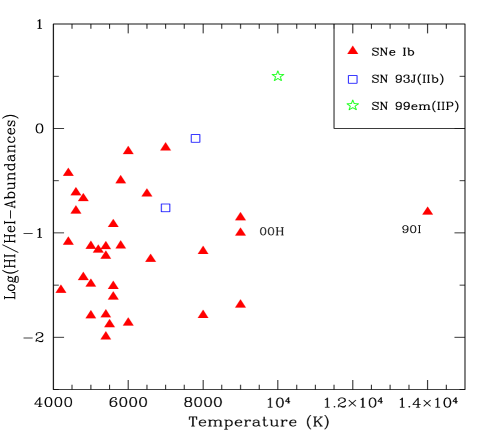
For SN 2000H in which H is clearly deep (5 at maximum; Fig. 23), an abundance ratio
(i.e. H/He) is estimated to be 0.23. SN IIb 1993J, around day 16, has a ratio 0.8. We estimate
an even higher ratio for SN 1999em, namely 3.2. These estimates, although rough, are in accord with
our impression that the hydrogen mass
increases as we go from Type Ib to IIb to Type II SNe. Figure 32 displays the logarithmic hydrogen to
helium abundance ratios against temperature for the events of our sample. Note here that
for low temperatures, T 9000,
the reported values in Figure 32 can be taken as upper limits. This is because we used a value of 1000 for the
ratio (H I)/(He I). At low temperatures, however, the ratio
becomes significantly larger than this adopted
value (Fig. 2a; Hatano et al. 1999). An additional source of uncertainty may be related
to the continuum temperature estimates owing to the total reddening effects.
Furthermore, according to our fit experience on the sample spectra, an uncertainty of about 10
is assigned to the derived values of the optical depths. In the case of SN IIP 1999em and SN IIb 1993J, with
their complete H P-Cygni profiles, greater optical depth uncertainties should be expected, although
in these events we got good fits to the H profiles. It is worth noting however that the enormous NLTE effects
in the He I lines lead to very inaccurate determination of helium abundances.
Making use of the derived photospheric velocities “”, from our synthetic spectra modeling, it is possible to recover “” estimates of the kinetic energy and mass above the photosphere. In fact, Millard et al. (1999) have shown that for spherical symmetry and an“” density distribution, the mass (in ) and energy (in ergs) above the electron-scattering optical depth “ ” can be expressed as:
| (1) |
| (2) |
where and , is time after explosion in days, is in units of 104 km s-1 and is the mean molecular weight per free electron.
In applying the above equations to our supernova sample, we adopt and . For the mean molecular weight per free electron we have different values for each case, namely: SNe Ib: for half ionized helium or doubly ionized oxygen; SNe Ic: for a mixture of carbon and oxygen, both singly ionized; SNe II: to for fully ionized or half ionized hydrogen. For the case of “” IIb SNe we assume a mixture of hydrogen and helium, both half ionized and hence .
Figure 33 displays results for five events. Filled symbols refer to the mass (in units of ; upper panel), while the open ones indicate the kinetic energy (in units of ergs; lower panel). For each supernova, the estimated masses for different epochs are connected by a dotted line. The short-dashed line connects the derived energies in order to clarify trends. For a given phase, the reported amounts indicate the mass moving above the photospheric velocity, carrying a corresponding kinetic energy. The events displayed in Fig. 33 have been selected on the basis of their type and velocity. SN 1990I, being an object with high velocities, appears to have high kinetic energy, while SN 1991D with its lower velocity structure lies at the bottom of the plot. For a significant comparison, we choose data at similar phases, around day 38. At that epoch, the mass moving faster than “” and the corresponding energy are estimated to be: (1.1) for SN 1990I; (0.45) for SN 2000H; (0.3) for SN 1991D; (0.6) for SN 1993J and (0.95) for SN 1994I. SN Ib 1984L has behaviour similar to SN 2000H. These derived quantities suffer, of course, from some uncertainties, namely those incurred with the derived photospheric velocities444A mean fitting uncertainty of 500 km s-1 is assigned to the derived velocities. The uncertainty in the velocity would affect more the uncertainties in the derived energies than those of the derived masses. from our best fits and the adopted value for the power-index “”. However, they seem to give reasonable and meaningful values that are not in disagreement with other methods (e.g. light curve modeling ; NLTE treatment of early and late spectra), especially for the well studied objects such as SNe 1990I, 1994I and 1993J. The oxygen-mass estimates could be a further check of the trend in the derived photospheric outflow mass. Elmhamdi et al. (2004), on the basis of [O I] 6300, 6364Å line analysis at nebular phases, have estimated a lower limit on the oxygen mass to fall in the range 0.71.35 . The available estimated amounts for the other objects are as follows: 0.3 for SN 1984L (Filippenko et al. 1990); 0.5 for SN 1993J (Houck Fransson 1996) and 0.4 for SN 1994I (Woosley et al. 1995). These estimates follow the trend seen in the masses above the photosphere.
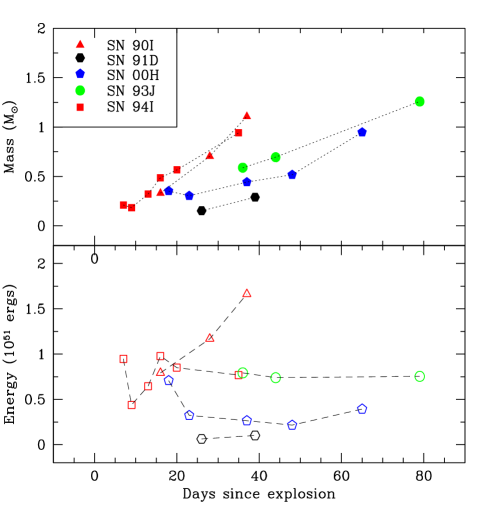
We emphasize here that this simple approach, using equations 1 and 2, does not provide “reasonable” estimates in the case of Type II SNe. In fact when this method is used for both SNe 1987A and 1999em, the estimated “” and “” above the photosphere seem to be very small, in contradiction with what we may expect. Two possible effects might invalidate the method for Type II objects. First, because the method cannot be used whenever the power index “” value falls below 5 (i.e. to keep and positive and convergent). For SN 1987A, indeed, Jeffery Branch (1990) had found “” falling below 5 already within a week after the explosion (see their Figures 15 and 19). Second, in Type II SNe and after the earliest times, the electron-scattering optical depth for the photosphere comes from a thin layer of ionized hydrogen at the recombination front. Farther out, there can be a lot of neutral hydrogen (and helium) that is not accounted for in the “Millard et al.” equations adopted in our simple analysis. When, for instance, “” is set to one, the equations are only giving the mass and energy of the matter near the photosphere. Consequently one may question why they should be taken seriously for the other CCSNe classes. Some carbon and oxygen could be neutral too. One simple explanation could be that because of the large hydrogen envelope, these effects seem to be more “” in Type II events rather than the rest of SNe. In summary, the simple method does not apply to SNe II because it does not take into account the recombined hydrogen.
By adopting the estimate of the outflow mass above “” as an upper limit of the helium mass in Type Ib and IIb events, and using the derived constraints on the hydrogen to helium abundances ratio, one can thus recover an upper and rough estimate of the mass of expelled hydrogen. Around maximum light, the hydrogen amount in SN 1990I is found to be 0.16. At similar phase, an amount of about 0.1 is computed for SN 2000H. SN 1993J, however, seems to eject a quantity as high as 0.7. SN 1993J indeed serves as a control case for our adopted methodology. Different studies argued that a low-mass hydrogen envelope on a helium core is the most likely scenario for the progenitor of SN 1993J. On the one hand, light curve modeling demonstrates a compatibility fit with a 4 helium core and hydrogen envelope of 0.2 (Woosley et al. 1994). A similar analysis invoked a helium core 4, with a residual hydrogen mass less than 0.9 (Nomoto et al. 1993; Shigeyama et al. 1994). On the other hand, best fit models of spectra lead to similar progenitor properties, namely 3.2 for the helium core with a 0.20.4 hydrogen envelope (Houck Fransson 1996). Our estimate is therefore in good agreement with the previous cited studies. For the rest of Type Ib objects, an upper limit of the hydrogen mass of the order 0.1 is estimated.
4.2 Method 2
Alternatively, an approximate way to estimate the hydrogen mass invokes the amount needed to fill a uniform density sphere of radius “” at an epoch since explosion. Adopting a value of “10-9” for the hydrogen Balmer fraction (within the LTE context), the required ion mass can be given by:
| (3) |
This comes from the equation for the Sobolev optical depth for an expanding envelope (see e.g. Castor 1970; Jeffery Branch 1990). where in days and is in 104 km s-1. This equation is then used to determine the amount filling a spherical shell of an inner radius “” and an outer edge of radius “”. Constraints on the shell widths, “”, are approximated using Gaussian fits to the observed H absorption troughs by means of the corresponding FWHM. It is worth noting here that constraints on “” from this method, i.e. Gaussian fit, can be considered as a lower limit to the “real” maximum velocity.
Although non-thermal excitation and “NLTE” effects may be also important for hydrogen, the method seems to give reasonable estimates. For SN 1990I around maximum light a value of 0.02 is computed, while at similar phase SNe 1983N and 2000H have, respectively, 0.008 and 0.08 . For type IIb SN 1993J, at day 16 since maximum, the method gives an approximate amount as high as 1.7 . This amount is of course very sensitive to the assumed optical depth. In fact SN 1993J has an optical depth similar to Type IIP 1999em (i.e. at 25days). However the fit is more “convincing” in SN 1999em than in SN 1993J, especially in the H absorption troughs (see Fig. 30-middle panel and Fig. 31-lower panel). This might be indicative of an overestimated optical depth in SN 1993J and/or a larger departure from “LTE” compared to SN 1999em.
A rise time of days has been adopted in this class of object. Moreover, if we adopt a representative H optical depth of 0.5 at day 20 with an H velocity restriction similar to SN 1990I, the estimated hydrogen mass is of the order 0.015 . Events with higher velocity widths and/or deeper H troughs would eject larger amounts.
5 Discussion and conclusion
One of our main goals was to identify traces of hydrogen in Type Ib-c, and to identify any systematic similarities and differences correlating with other physical properties. Consequently, guided by modeling early spectra of SN Ib 1990I, we have explored different combinations of ions and shaping the Å wavelength range. Special attention has been devoted to the feature seen near 6300Å. Even though the number of events with spectra well sampled in wavelength, is limited, it appears that hydrogen in varying amounts is identifiable in most Type Ib objects especially at very early times. Only in two cases, namely SNe 1991D and 1991L, does the Ne I 6402Å line remain as an alternative possibility with large departure from LTE. Even in SN 1996aq, that we classified as a transition Type Ib/c event, and SN 1999ex the presence of the H trough seems highly preferred.
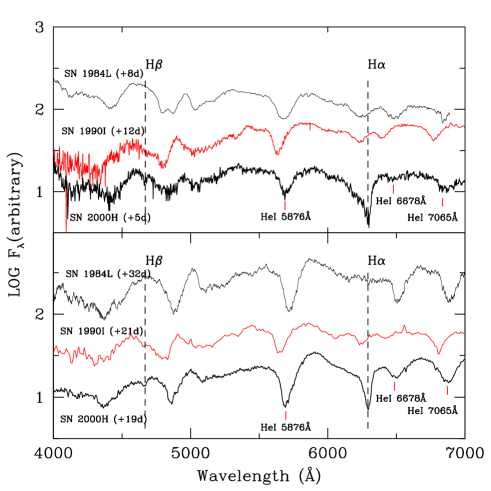
At later phases, more than 3 weeks, SNe 1984L, 1988L, 1991ar, 1998dt, 1998T and 1999dn behave quite similarly, namely still showing evident He I lines and a “” Å region of the spectrum, with a weak H absorption feature. Even SN 1991D with its particularly low photospheric velocity and narrow lines belongs to this class. SN 1991L appears to be similar to SN 1991D in having shallow He I optical features. SNe 1999di and 2000H are the unique events among the sample that display obvious He I lines, together with a pronounced and deep H absorption line. It is interesting to note here the peculiar behaviour of SN 1997dc. The event has He I troughs as deep as in SNe 1999di and 2000H, however it has a flat Å region. SN 1990I at this phase shows distinct He I lines and a moderate H trough. Figure 34 compares SN 1990I with SNe 1984L and 2000H at two different phases of evolution. The vertical dashed lines indicate the locations of H and H troughs in SN 2000H. On the one hand, while at early phases (upper panel) the trough assigned to H is clear in all the three SNe, it disappears later on in SN 1984L (lower panel). On the other hand, H appears clearly in SN 2000H and absent in SNe 1984L and 1990I. Moreover, the comparison emphasizes the high velocity behaviour of SN 1990I as is evident from the blueshifted features in SN 1990I compared to the others. He I optical lines are also shown. For the three events the He I troughs at 5876Å, and 7065Å are clearly identified and get narrower with time. At early phase the He I 6678Å is recognized in SNe 1990I and 1984L while it is just hinted in SN 2000H. Later on, Fig.34-bottom panel, the He I 6678Å line grows in strength in SNe 1984L and 2000H while it fades in SN 1990I. The comparison of these three events, in terms of changes in line visibility and velocity, demonstrates the complexity involved in demonstrating any thing like a continuous sequence.
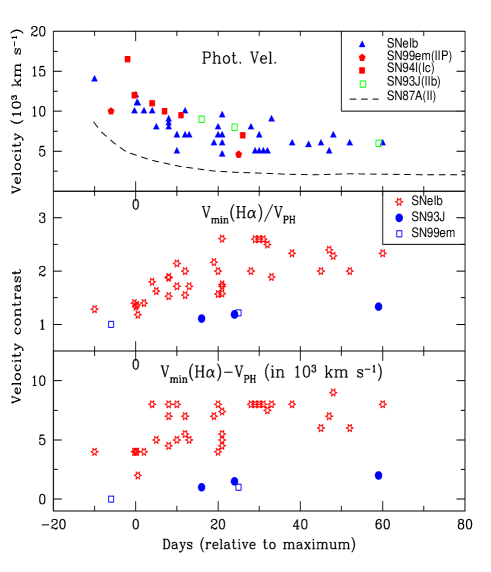
Hydrogen manifests its presence in a different way in the other CCSNe types. A part from SN 1996aq that we re-classify as a transient Ib/c event rather than a pure Type Ic SN, there is no evidence for the presence of hydrogen in Type Ic objects analyzed here (i.e. SNe 1987M and 1994I). The “” SN IIb 1993J displays typical Type II features at early phases, such as strong and broad H P-Cygni emission component, which is absent in Type Ib objects. This can be explained within the context of the “detachment” concept. In fact, H P-Cygni profile would lose its obvious emission component when it is highly detached. At early epochs, both SN IIb 1993J and SN II 1999em show clear evidence of the other H I Balmer lines since the corresponding optical depths are too large to allow them to be distinctly visible, contrary to normal Type Ib objects, with the exception of some cases with deep and conspicuous H troughs that present signature of H too (e.g. SNe 1999di and 2000H). Two factors make H barely discernible in Type Ib: the optical depth found to fit H is small and the contrast velocity of H is high. The opposite is seen in Type II and IIb events. As time goes on, the H emission peak in SN 1993J changes to a double-peaked structure which we recognized as the emergence of the He I 6678Å, with more clearer He I optical lines. These laters disappear at the nebular phase and the spectrum is dominated by typical Ib features such as [O I], [Ca II] and Ca II in emission. The situation in SN 1999em, and in Type II in general, is different. The He I lines are found to disappear very early, about one weak after explosion, and even at later nebular epochs the H is still the most prominent feature in the spectrum.
In Figure 35, upper panel, we report the resulting photospheric velocities from our best fits for the CCSNe sample. Data for SN 1987A, corresponding to Fe II 5018Å absorption, are also shown for comparison (dashed line; Phillips et al. 1988). Additional points for SN 1994I are taken from Millard et al. 1999. The plot indicates the low velocity behaviour of Type II SNe, both 1987A and 1999em, at early as well as intermediate epochs. SN IIb 1993J follows somewhat similar behaviour as SN Ic 1994I in having higher velocities. As far as Type Ib SNe are concerned, they appear to display a different velocity evolution. The scatter seems to increase at intermediate phases (around 2030 days). This fact can be simply due to the paucity of available observations outside that range. Around day 20, for example, a scatter as high as 5000 km s-1 is measured. SNe 1990I and 1998dt belong to a class with the higher “”, while objects such as SNe 1991D and 1996aq have the lowest estimated velocities, approaching even Type II objects. The remainder of the Ib events follow a similar trend, namely the one described by Branch et al. (2002). SN 1999ex is found to belong to this class. Surely more data are needed to obtain meaningful statitical conclusions.
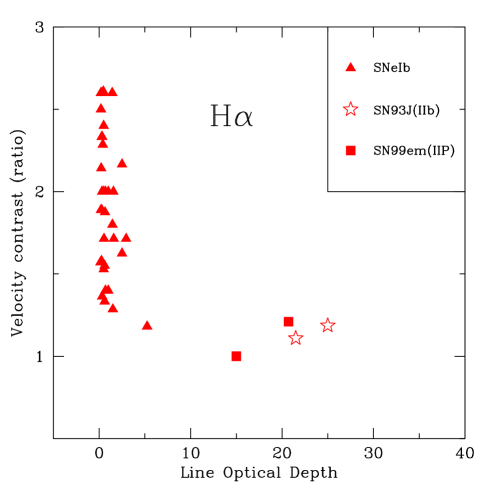
The middle and bottom panels in Fig. 35 display the evolution the of H contrast velocities, “” and “” respectively, for the sample. As discussed before, when discussing differences in the H profile in CCSNe, we would expect an increasing value of “(H)” going from Type II to IIb to Ib SNe. This trend is in fact illustrated in the plot (bottom panel). A similar trend is seen in the “(H)” evolution as indicated by the middle panel. While in SN IIb 1993J and SN IIP 1999em the line is found to be either undetached or slightly detached, it is highly detached in Type Ib events. Moreover, the “(H)” is found to increase within the first 15 days, reaching values as high as 8000 km s-1, and then follows an almost constant evolution. According to Table 2 and up to 60 days, Type Ib SNe have hydrogen down to 11000-12000 km s-1, while in SN 1993J hydrogen is down to 8000 km s-1. SNe II appear to have hydrogen down to even lower velocities (5000 km s-1 in SN 1999em). In addition, hydrogen in Type Ib SNe is found to have very small optical depths independently of the contrast velocity (also independently of the phase). This is shown by Figure 36. In fact, Type Ib objects populate the region of extremely low optical depths, although the “(H)” spans a large range, contrary to SNe 1993J and 1999em.
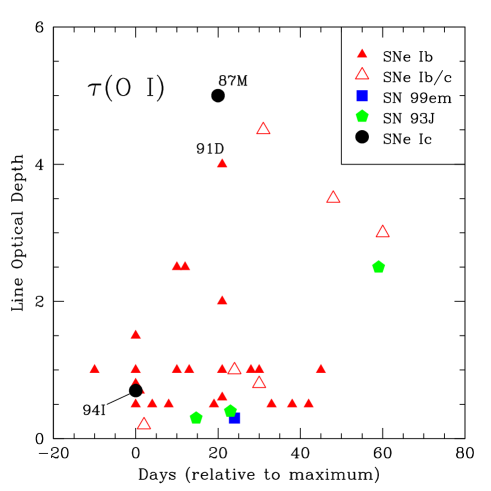
Table 2 also displays properties of the helium line. In Type Ib SNe, He I lines are found to be not always detached as is the case for hydrogen. The He I 5876Å line is found to be clearly distinguishable in Type Ib objects. A contribution from Na ID is argued for in some cases, such as the broad feature in SN 1996aq and cases with an observed bump shortward of the minimum absorption as seen in SNe 1990B and 1997dc. It is important to recall here that in some cases we obtained a better fit to the He I optical lines adopting an folding SSp, which allows a two-component treatment of the line and a gradually decreasing optical depth below the detachment velocity, rather than a discontinuity in it. In the case of SN 1999ex, we extend our He I line fits beyond 1 micron, confirming the presence of various IR lines, namely at 1.083, 1.284, 1.700(?), and 2.085 microns (Fig. 20), in accord with optical He I parameters. In our analysis, we also pointed to some interesting line identifications. For example the contribution of Sc II lines in nearly all the CCSNe spectra, especially for reproducing the double absorption features blueward of the He I 5876Å line. We note here that except for He I and H I, almost all the lines in the CCSNe synthetic spectra are undetached.
Another important study is the behaviour of the O I 7773Å line. Figure 38 reports the resulting optical depths corresponding to our best synthetic spectra fits. It is not easy to draw clear-cut conclusions from this figure since one needs, for instance, to populate the figure with more Type Ic objects. However, at intermediate phases, it seems that Type Ib objects tend to concentrate in the low optical depth region, while SN Ic 1987M is found to display the deepest profile. SNe 1993J and 1999em, at similar phases, are the objects with the lowest O I 7773Å optical depth. At somewhat later epochs, transient Type Ib/c objects display deep O I 7773Å troughs. The stronger and deeper permitted oxygen lines at early phases of SNe Ic and Ib/c spectra might imply that they are less diluted by the presence of a helium envelope. Indeed one might expect oxygen lines to be more prominent for a “naked” C/O progenitor core. Despite the paucity of well sampled CCSNe observations, two observational aspects tend to reinforce this belief: , the forbidden lines, especially [OI]6300, 6364Å, seem to appear earlier following a SNe sequence “IcIbIIbII”. In fact the oxygen line emerges at an age of 1-2 months in Type Ic SN 1987M (Filippenko 1997). SN Ic 1994I displayed evidence for the line at an age of 50 days, although some hints may even be seen in the 36day spectrum (Clocchiatti et al. 1996b). While in SN Ib 1990I it was hinted at the 70day spectrum (Elmhamdi et al. 2004). In other Type Ib SNe it appears earlier than in SN 1990I. In SN IIb 1993J, a transition object, the line was visible in the 62day spectrum (Barbon et al. 1995). SN 1996cb, another well observed IIb event, showed evidence of the [OI]6300, 6364Å line around day 80 (Qiu et al. 1999). In SNe II, however, the line appears later: around day 150 in SN 1987A (Catchpole et al. 1988) and after day 138 in SN 1992H (Clocchiatti et al. 1996a). In SN II 1999em it is suggested at a somewhat earlier phase compared to SNe 1987A and 1992H, namely at day 114. Whether all this can be understood in terms of the lower progenitor mass of SN 1999em and its presumed lower oxygen mass remains to be investigated (Elmhamdi et al. 2003). , it seems that the nebular emission line decreases in breadth following the SNe sequence above. Of course much work is still needed in this respect based on larger CCSNe samples at both photospheric and nebular phases, relating them to the photometry of the CCSNe variety (Elmhamdi Danziger, in preparation). Furthermore, one important point is to check for any possible correlations between the oxygen minimum velocity (at early epochs), their line widths, and to relate this to a progenitor mass indicator [Ca II]/[O I] ratio (at nebular phases; Fransson Chevalier 1989), the progenitor properties (i.e. masses, energies). Other factors such as mixing, variation in envelope densities and metallicity may play an additional complicating role.
Finally we presented two methods to determine the ejecta and hydrogen mass in CCSNe and especially in Type Ib events. Although the methods are very approximate555“Method 2” is a direct method, while “Method 1” is undirect and gives upper limits on the hydrogen mass., our results do not conflict with more detailed estimates, those based on hydrodynamical and NLTE models. A thin layer of hydrogen, ejected at high velocities down to 11000-12000 km s-1, appears to be present in almost all the Type Ib events studied here. These results suggest possible directions for further more sophisticated work. The necessity to introduce lines of Ne I, Sc II, Ba II, Ca I, Fe II in some cases but not in others must inevitably raise concerns about the identifications and other reasons for these variations.
Acknowledgements.
A. Elmhamdi is grateful to the ESO (European Southern Observatory) support that allowed his stay at Garching where part of the work has been done. I.J. Danziger was supported in this work by MIUR with a grant for PRIN 2004 from the Italian Ministry of Education. Research on supernovae at Harvard University is supported by NSF Grant AST-0205808. Supernova research at Oklahoma University is supported by NSF grants AST-0204771 and AST-0506028, and NASA LTSA grant NNG04GD36G.References
- Barbon et al. (1995) Barbon R., Benetti S., Cappellaro E. et al. 1995, AAS, 110, 513
- Baron et al. (1999) Baron E., Branch D., Hauschildt P. H., Filippenko A. V., Kirshner R. P. 1999, ApJ, 527, 739
- Baron et al. (2000) Baron E., Branch D., Hauschildt P. H. et al. 2000, ApJ, 545, 444
- Benetti et al. (2002) Benetti S., Branch D., Turatto M. et al. 2002, MNRAS, 336, 91
- Branch (1972) Branch D. 1972, AA, 16, 247
- Branch (2001) Branch D. 2001, in “Supernovae and GRBs: The Largest Explosions in the Univers”, ed. M. Livio (Cambridge Univ. Press), 96
- Branch et al. (2002) Branch D., Benetti S., Kasen D. et al. 2002, ApJ, 566, 1005
- Branch (2003) Branch D. 2003, in “A Massive Star Odyssey: From Main Sequence to Supernova”, ed. K. van der Hucht, A. Herraro, & C. Esteban (San Francisco: Astronomical Society of the Pacific), 346
- (9) Castor J. I., 1970 , MNRAS, 149, 111
- (10) Catchpole R. M., Whitelock P. A., Feast M. W. et al. 1988, MNRAS, 231, 75
- Clocchiatti (1996) Clocchiatti A., Benetti S., Wheeler J. C. al. 1996a, 111, 1286
- Clocchiatti (1996) Clocchiatti A., Wheeler J. C., Brotherton M. S. et al. 1996b, ApJ, 462, 462
- Clocchiatti and wheeler (1997) Clocchiatti A. Wheeler J. C. 1997, ApJ, 491, 375
- Clocchiatti (01) Clocchiatti A., Suntzeff N. B., Phillips M. M. et al. 2001, ApJ, 553, 886
- Deng et al. (2000) Deng J. S., Qiu Y. L., Hu J. Y., Hatano K. Branch D. 2000, ApJ, 540, 452
- Deng et al. (2001) Deng J. S., Qiu Y. L Hu J. Y. 2001, (astro-ph/0106404)
- Elmhamdi et al. (2003) Elmhamdi A., Danziger I. J., Chugai N. N. et al. 2003, MNRAS, 338, 939
- Elmhamdi et al. (2004) Elmhamdi A., Danziger I. J., Cappellaro E. et al. 2004, AA, 426, 963
- Filippenko. (1988) Filippenko A. V. 1988, AJ, 96, 1941
- Filippenko. (1990) Filippenko A. V., Porter A. C. Sargent W. 1990, AJ, 100, 1575
- Filippenko. (1992) Filippenko A. V. 1992, ApJ, 384, L37
- Filippenko. (1994) Filippenko A. V., Matheson T., Barth A. J. 1994, AJ, 108, 2220
- Filippenko. (1995) Filippenko A. V., Barth A. J., Matheson T. et al. 1995, ApJ, 450, L11
- Filippenko. (1997) Filippenko A. V. 1997, ARAA, 35, 309
- Fisher (2000) Fisher A. 2000, Ph.D thesis, Univ. Oklahoma
- Fransson chevalier (89) Fransson C. Chevalier R. A., 1989, ApJ, 343, 323
- Galyam (2005) Gal-Yam A., Fox D. B., Kulkarni S. R. et al. 2005, AJ, 630, 29
- Gomez (2002) Gomez G. Lopez R. 2002, AJ, 123, 328
- Hamuy et al. (2002) Hamuy M., Maza J., Pinto P. A. et al. 2002, AJ, 124, 417
- Hanuschik (1988) Hanuschik R. W. Dachs J. 1988, AA, 205, 135
- Harkness et al. (1987) Harkness R. P., Wheeler J. C., Margon B. et al. 1987, ApJ, 317, 355
- Hatano et al. (1999) Hatano K., Branch D., Fisher A., Millard J. Baron E. 1999, ApJS, 121, 233
- Houck and Fransson. (96) Houck J. C. Fransson C. 1996, ApJ, 456, 811
- Jeffery (90) Jeffery D. J. Branch D. 1990, in: J.C. Wheeler, T. Piran, S. Weinberg (eds.), “Supernovae”, Sixth Jerusalem Winte School for Theoretical Physics (Singapore: World Scientific), 149
- Jeffery (91) Jeffery D. J., Branch D., Filippenko A. V. Nomoto K. 1991, ApJ, 377, 89
- (36) Kidger M. 1988, IAU Circ. 4614
- Kirshner (90) Kirshner R.P., Leibundgut B. Horine E. 1990, IAU Circ. 4953
- (38) Kurucz R. L. 1993, CD-ROM 1, Atomic Data for opacity Calculations (Cambridge: Smithsonian Astrophysical Observatory)
- Lewis. (1994) Lewis J. R., Walton N. A., Meikle W. P. S. et al. 1994, MNRAS, 266, 27
- Lucy. (1991) Lucy L. B. 1991, ApJ, 383, 308
- Matheson et al. (2000) Matheson T., Filippenko A. V., Ho L. C., Barth A. J. Leonard D. C. 2000, AJ, 120, 1499
- Matheson et al. (2001) Matheson T., Filippenko A. V., Li W., Leonard D. C. Shields J. C. 2001, AJ, 121, 1648
- Millard et al. (1999) Millard J., Branch D., Baron E. et al. 1999, AJ, 527, 756
- Nakano (96) Nakano S., Aoki M., Kushida R. et al. 1996, IAU Circ. 6454
- Nomoto (93) Nomoto K., Suzuki T., Shigeyama T. et al. 1993, Nature, 364, 507
- Patat et al. (1995) Patat F., Chugai N. Mazzali P., 1995, AA, 299, 715
- Patat et al. (2001) Patat F., Cappellaro E., Danziger J. et al. 2001, ApJ, 555, 900
- Phillips et al. (1988) Phillips M. M., Heathcote S. R., Hamuy M. Navarrete M. 1988, AJ, 95, 1087
- Qiu et al. (1999) Qiu Y., Li W., Qiao Q. Hu J. 1999, AJ, 117, 736
- Schlegel et al. (1989) Schlegel E. M. Kirshner R. P. 1989, AJ, 98, 577
- Schlegel et al. (1998) Schlegel D. J., Finkbeiner D. P. Davis M. 1998, 500, 525
- Shigeyama et al. (1994) Shigeyama T., Suzuki T., Kumagai S. et al. 1994, AJ, 420, 341
- Stritzinger et al. (2002) Stritzinger M., Hamuy M., Suntzeff N. B. et al. 2002, AJ, 124, 2100
- Swartz (1993) Swartz D. A., Clocchiatti A., Benjamin R., Lester D. F. Wheeler J. C. 1993, Nature, 365, 232
- Utrobin (2002) Utrobin V. P. Chugai N. N. 2002, AstL, 28, 386
- Wheeler et al. (1994) Wheeler J. C., Harkness R. P., Clocchiatti A. et al. 1994, ApJ, 436, 135
- Woosley et al. (1994) Woosley S. E., Eastman R. G., Weaver T. A., Pinto P. A. 1994, AJ, 429, 300
- Woosley et al. (1995) Woosley S. E., Langer N. Weaver T. A., 1995, ApJ, 448, 315
| Supernova | Host Galaxy | Phases | 1 | Nbr(ions) | ||||||
| (Type) | () | (days) | () | () | () | () | ||||
| SN1990I (Ib) | NGC 4650A | 2902 | max | 12000 | 14000 | 0.6 | 2.9 | 16000 | 14000 | 7 |
| 12 | 10000 | 5500 | 0.6 | 1.85 | 15500 | 13000 | 7 | |||
| 21 | 9500 | 5400 | 0.26 | 0.94 | 15000 | 12000 | 7 | |||
| SN1983N (Ib) | NGC 5236 | 513 | max | 11000 | 8000 | 0.34 | 2.5 | 15000 | 8 | |
| 10 | 7000 | 5000 | 0.55 | 3.4 | 12000 | 9000 | 11 | |||
| SN1984L (Ib) | NGC 991 | 1534 | 8 | 8000 | 8000 | 0.65 | 2.5 | 15000 | 10000 | 5 |
| 32 | 5000 | 5600 | 0.2 | 6.7 | 12500 | 7000 | 5 | |||
| SN1987M2 (Ic) | NGC 2715 | 1339 | 20 | 7000 | 4500 | 0.6 | 9000 | 7 | ||
| SN1988L (Ib/c) | NGC 5480 | 1856 | 20 | 8000 | 9000 | 0.7 | 1 | 16000 | 11000 | 9 |
| SN1990B (Ib/c) | NGC 4568 | 2320 | 8 | 8500 | 5400 | 0.5 | 0.55 | 13000 | 10000 | 7 |
| 30 | 7000 | 4000 | 0.8 | 10000 | 9 | |||||
| SN1991ar (Ib) | IC 49 | 4562 | 28 | 8000 | 4400 | 0.32 | 10 | 16000 | 10 | |
| 48 | 7000 | 4800 | 0.4 | 4.8 | 16000 | 8000 | 10 | |||
| 60 | 6000 | 4600 | 0.28 | 4.4 | 14000 | 7000 | 12 | |||
| SN1991D (Ib) | PGC 84044 | 12500 | 21 | 4600 | 7000 | 0.46 | 1.8 | 12000 | 6000 | 11 |
| SN1991L (Ib/c) | M 7-34-134 | 9050 | 31 | 5000 | 6000 | 0.34 | 2 | 13000 | 12 | |
| SN1993J (IIb) | M 81 | 35 | 16 | 9000 | 7800 | 21 | 0.6 | 10000 | 10 | |
| 24 | 8000 | 7000 | 25 | 1.5 | 9500 | 10 | ||||
| 59 | 6000 | 5000 | 2 | 30 | 8000 | 11 | ||||
| SN1994I (Ic) | NGC 5194 | 461 | max | 12000 | 7000 | 9 | ||||
| SN1996aq (Ib/c) | NGC 5584 | 1602 | 2 | 9000 | 9000 | 0.12 | 0.35 | 15000 | 12000 | 8 |
| 24 | 4600 | 5000 | 0.25 | 7000 | 11 | |||||
| SN1997dc (Ib) | NGC 7678 | 3480 | 28 | 5000 | 4200 | 0.2 | 10 | 13000 | 7000 | 10 |
| SN1998dt (Ib) | NGC 945 | 4580 | 8 | 9000 | 5600 | 0.3 | 4 | 17000 | 11000 | 6 |
| 33 | 9000 | 5000 | 0.2 | 10 | 17000 | 9 | ||||
| SN1998T (Ib) | NGC 3690 | 3080 | 21 | 6000 | 5400 | 0.34 | 1.15 | 10500 | 9000 | 9 |
| 42 | 5800 | 5200 | 0.75 | 8000 | 9 | |||||
| SN1999di (Ib) | NGC 776 | 4920 | 21 | 7000 | 4800 | 3 | 12.6 | 12000 | 8500 | 8 |
| 45 | 6000 | 5200 | 1.6 | 10 | 12000 | 7500 | 9 | |||
| 52 | 6000 | 5000 | 1 | 10 | 12000 | 7000 | 9 | |||
| SN1999dn (Ib) | NGC 7714 | 4920 | -10 | 14000 | 6600 | 1.5 | 2 | 18000 | 5 | |
| max | 10000 | 6000 | 1 | 5 | 14000 | 11000 | 6 | |||
| 10 | 7000 | 5800 | 0.24 | 1.9 | 15000 | 9000 | 10 | |||
| 38 | 6000 | 5400 | 0.34 | 14.5 | 14000 | 7000 | 10 | |||
| SN1999ex (Ib) | IC 5179 | 3498 | 4 | 10000 | 5800 | 1.45 | 2.35 | 18000 | 11000 | 7 |
| 13 | 7000 | 5600 | 1.6 | 3.4 | 12000 | 8000 | 12 | |||
| SN1999em (IIP) | NGC 1637 | 717 | -6 | 10000 | 10000 | 15 | 0.6 | 3 | ||
| 25 | 4600 | 6400 | 21 | 5600 | 13 | |||||
| SN2000H (Ib) | IC 454 | 3894 | max | 11000 | 9000 | 5.25 | 2 | 13000 | 9 | |
| 5 | 8000 | 6500 | 2.5 | 2 | 13000 | 9000 | 9 | |||
| 19 | 6000 | 4600 | 2.5 | 5 | 13000 | 8000 | 9 | |||
| 30 | 5000 | 6000 | 1.45 | 3.4 | 13000 | 7000 | 11 | |||
| 47 | 5000 | 4400 | 0.5 | 1 | 12000 | 7000 | 9 |
- The events are corrected for the galactic reddening effect (Schelegel et al. 1998). Additional
host galaxy
extinction is corrected for only in two objects, namely SNe 1990I and 1999em.
- The reported data corresponds to the low He I velocity case (see Sect. 3.2)