Irradiated atmospheres of accreting magnetic white dwarfs with an application to the polar AM Herculis
We present a pilot study of atmospheres of accreting magnetic white dwarfs irradiated by intense fluxes at ultraviolet to infrared wavelengths. The model uses a standard LTE stellar atmosphere code which is expanded by introducing an angle-dependent external radiation source. The present results are obtained for an external source with the spectral shape of a 10000 K blackbody and a freely adjustable spectral flux. The model provides an explanation for the observed largely filled-up Lyman lines in the prototype polar AM Herculis during its high states. It also confirms the hypotheses (i) that irradiation by cyclotron radiation and other radiation sources is the principle cause for the large heated polar caps surrounding the accretion spots on white dwarfs in polars and (ii) that much of the reprocessed light appears in the far ultraviolet and not in the soft X-ray regime as suggested in the original simple theories. We also briefly discuss the role played by hard X-rays in heating the polar cap.
Key Words.:
radiative transfer – stars: atmospheres – (stars:) novae, cataclysmic variables – (stars:) white dwarfs – stars: individual (AM Herculis)1 Introduction
The white dwarfs in magnetic cataclysmic variables (mCVs, more specifically polars) accrete in restricted regions near their magnetic poles. In most of them, the infalling matter is heated in a free-standing shock above the surface of the white dwarf and cools by the emission of X-rays and cyclotron radiation. Early models assumed that the stand-off distance of the shock is small and much of the emission by the post-shock plasma is absorbed by the atmosphere below and immediately around the accretion spot. The implied irradiation of this small section of the atmosphere by intense fluxes of hard X-ray bremsstrahlung and cylotron radiation leads to an expected temperature of the heated atmosphere of eV ( K), to re-emission in the soft X-ray regime with a quasi-blackbody spectrum, and to an energy balance (King & Lasota 1979; Lamb & Masters 1979), where the three luminosity components refer to soft X-rays (sx), hard X-rays (hx), and cyclotron radiation (cyc), the geometry factor accounts for the fraction of the luminosity intercepted by the white dwarf, and the hard X-ray albedo reduces the efficiency of X-ray heating (van Teeseling et al. 1994). Later on, it was realized that the accretion region is highly structured (Kuijpers & Pringle 1982; Frank et al. 1988) with individual sections receiving vastly different mass flow densities and displaying substantially different emission characteristics. The plasma in tenuous tall shocks cools preferentially by cyclotron radiation, the plasma in dense low-lying shocks by hard X-ray bremsstrahlung, and for the highest mass flow densities, the shocks are buried in the atmosphere and the primary bremsstrahlung is reprocessed into soft X-rays, a component physically different from but observationally difficult to distinguish from the originally suggested soft X-ray blackbody component. This “soft X-ray puzzle” was the subject of an extended debate over more than two decades (e.g., Beuermann 2004; Ramsay & Cropper 2004, and references therein).
Quite unexpectedly, observational support for the reprocessing scenario came from studies of the far ultraviolet spectra of the prototype polar AM Herculis, which showed that photospheric emission of the white dwarf dominates the FUV (Heise & Verbunt 1988; Gänsicke et al. 1995, 1998; Mauche & Raymond 1998; Greeley et al. 1999; Gänsicke et al. 2005). The pronounced orbital modulation of the FUV flux indicates a large heated polar cap, which covers % of the white dwarf surface. The cap reaches a peak temperature of K in low states when accretion nearly ceases and becomes much hotter in high states. Gänsicke et al. (1995) demonstrated that the excess FUV flux of the polar cap quantitatively agrees with the sum of cyclotron and X-ray fluxes from AM Her, both in the high and the low states, thus confirming the energy balance predicted by the simple models, with the decisive difference, however, that the heated polar cap covers a much larger area than the proper accretion spot and the reprocessed flux emerges in the FUV and not at soft X-ray wavelengths. AM Her is the best observed polar, but FUV studies of other polars suggest that the situation encountered in AM Her is quite typical of the class (e.g., Araujo-Betancor et al. 2005).
The dominant FUV spectral feature of white dwarfs in polars are the Lyman absorption lines, which are deep and broad in low states, mimicking the pure hydrogen spectra of DA white dwarfs, but become filled up almost entirely in states of high accretion (Heise & Verbunt 1988; Gänsicke et al. 1995, 1998; Mauche & Raymond 1998; Greeley et al. 1999; Gänsicke et al. 2005). Gänsicke et al. (1998) first tried to model the filled-up Lyman lines using a simple toy model and concluded that the temperature stratification in the white dwarf atmosphere is severely affected over the entire irradiated polar cap.
A spot due to reprocessing covering 10% of the white dwarf surface requires a point-like source at a height of 0.25 white dwarf radii or an extended source at a lower height. The best candidates are optical/infrared cyclotron and to some extent hard X-ray emission from tall shocks, supplemented by the FUV to optical emission from the pre-shock accretion stream. A further potential source is shockless accretion at very low mass flow densities, . The infalling particles do not directly heat the lower atmosphere but create a hot corona and the atmosphere below is again heated radiatively (Thomson & Cawthorne 1987; Woelk & Beuermann 1992). The task is, therefore, to consider the properties of atmospheres heated by a large external flux of ultraviolet/optical/infrared radiation. Modeling the UV-emitting spots in polars requires us to consider incoming radiation fluxes that exceed the flux emerging from the unheated atmosphere of the white dwarf by factors up to in the high state. Irradiated stellar atmospheres have been studied by several authors for a variety of conditions which differ, however, from those considered here (e.g., London et al. 1981; van Teeseling et al. 1994; Brett & Smith 1993; Barman et al. 2004). In this paper, we present a pilot study of the structure and the angle-dependent spectra of white dwarfs irradiated by an intense source of infrared to ultraviolet radiation.
The paper is arranged as follows. In Sect. 2 we describe the stellar atmosphere code used to calculate the irradiated atmosphere models, Sect. 3 introduces the essential parameters of the accretion regions in polars, in Sect. 4 we report the results for simple irradiation geometries, which are applied to the prototype polar AM Her in Sect. 5. In Sect. 6, we discuss the limitations of the approach and lines for future research.
2 Radiation transfer in irradiated atmospheres
We assume a pure hydrogen elemental composition, as appropriate for DA white dwarfs and for the sections of the atmosphere of accreting white dwarfs in mCVs that far away from the main accretion spot. We introduce the external flux as a boundary condition and neglect any other disturbance of the atmosphere as, e.g., an external pressure exerted by low-level accretion outside the main accretion spot.
We use a standard LTE atmosphere code to solve the radiative transfer in a plane parallel geometry with an incoming flux at optical depth , prescribed as a function of wavelength and zenith angle via the direction cosine cos. The radiative transfer equation
| (1) |
accounts for absorption and isotropic electron scattering via the source function
| (2) |
where is the absorption coefficient, is the Thomson scattering cross section, the Planck function, the angle-averaged intensity, and the dependencies on and have been suppressed. Line opacity is included in the form of the Lyman, Balmer, Paschen, and Brackett series of hydrogen, including excited levels up to . For the hot atmospheres considered here, molecular absorption is unimportant. Although we apply the results to magnetic white dwarfs in CVs we neglect Zeeman splitting of the Lyman lines. This is appropriate for the moderate field strengths considered here ( MG), because the Lyman lines are split by the normal Zeeman effect with , where is the elementary charge, the electron mass. and the speed of light. Specifically, for the polar AM Her considered below, the observed field strength MG implies Å for , which is small compared with the 90Å contributed by the Stark effect to the width of at the white dwarf effective temparature of 20000 K.
The radiative transfer equation is solved by a standard Rybicki (1971) elimination scheme. To this end, the quantities
| (3) | |||||
| (4) |
are introduced for . With their help, Eq. (1) is transformed to a second order differential equation
| (5) |
which is solved numerically. At large optical depths, the diffusion approximation provides the standard boundary condition. The angle-dependent incident intensity is implemented by modifying the upper boundary condition
| (6) |
For isotropic irradiation, is independent of , for irradiation at a single angle with cos, is described by a delta-function . The incoming and outgoing fluxes at are denoted by
| (7) | |||||
| (8) |
Independent of the magnitude of the incoming flux, the integral quantities
| (9) |
are related by , where
| (10) |
is the flux emerging from the unheated white dwarf atmosphere with effective temperature .
The condition of radiative equilibrium,
| (11) |
with the Eddington flux, is achieved by appropriate depth-dependent adjustment of the temperature. We use a correction method that is based on solving the momentum equations
| (12) |
with Eq. (11) as a constraint. Here, and are the Eddington factors with the scalar radiation pressure. A correction to is obtained by substituting B with
| (13) |
3 Irradiated polar caps in AM Her stars

The frequency-integrated bremsstrahlung and cyclotron emissivities vary as and , respectively, with the electron (and ion) number density of the plasma, its electron temperature, and the field strength. The plasma temperature is of the order of K at the shock and the plasma cools at nearly constant pressure () as it moves down. Since is also approximately constant throughout the post-shock region, the emissivities vary approximately as and , i.e., bremsstrahlung emission is concentrated near the white dwarf surface, while cyclotron emission originates throughout the column and, on the average, high above the surface. For a shock-heated plasma dominated by cyclotron cooling, the stand-off distance of the shock is given by
| (14) |
where is the field strength in units of G and is the white dwarf mass in solar units (Fischer & Beuermann 2001, their Eq. 21). Equation (14) remains valid as long as stays small compared with the radius of the white dwarf. For a 0.6 white dwarf with MG, amounts to a minute cm, while for MG, Eq. (14) yields cm or about 20% of the white dwarf radius. Large irradiated polar caps are, therefore, expected to exist preferentially in low-field mCVs.
The angle-dependent spectra emitted by the accretion regions on magnetic white dwarfs have been calculated by Fischer & Beuermann (2001, see also Woelk & Beuermann, 1996). Figure 1 shows an example of the emitted spectral energy distribution in a direction almost perpendicular to the magnetic field. Cyclotron emission is largely optically thick in the infrared and assumes a quasi Rayleigh-Jeans spectrum with harmonic structure superimposed. The cyclotron spectrum breaks off in the optical/UV, where the emission region becomes optically thin. At high frequencies, the X-ray bremsstrahlung tail is seen, which contains negligible flux if the mass flow density is sufficiently low. This is a consequence of the dependence of on . For comparison, we show a blackbody for a temperature of K with the same emitting area. Naturally, its spectral flux in the infrared is lower by a factor of about compared with the K cyclotron source. The comparison shows that the general spectral shape of the cyclotron emission mimics that of a blackbody of about K. For the purpose of the present pilot study, the exact shape and angle dependence of the cyclotron emission is not critical. We, therefore, approximate the shape of the irradiation spectrum by a K blackbody and scale the flux to match that of the cyclotron spectrum at the surface element in question. The reader should realize that the irradiation spectrum belongs to the plasma temperature of K and that the irradiation flux can, therefore, substantially exceed that of a K blackbody.
4 Results
All results presented in this paper have been obtained for irradiation by a source that emits a spectrum with the shape of a blackbody of K. Test calculations for various values of between 3000 K and 25000 K suggest that the spectrum emerging from the heated atmosphere is insensitive to as long as the fraction of the emitted energy shortward of the Lyman edge is small (König 2005).
In a first step, we consider single surface elements irradiated (1) isotropically and (2) at a single zenith angle . With respect to case 2, we note that our atmosphere code treats the intensity as azimuthally symmetric and, hence, interpretes the incoming intensity at as given on a cone with opening angle rather than at a single direction with azimuth angle . As a consequence, the code neglects the azimuthal asymmetry in the outgoing intensity that occurs in nature for a single surface element irradiated unidirectionally from . In a second step, we use case-2 models to calculate the integrated intensity from all surface elements of the white dwarf visible from a given direction , which indicates the direction towards the observer. We expect that the asymmetries present in the emissions from the individual elements largely cancel in the integral over all surface elements. With this caveat, we calculate the integrated spectrum received from an entire white dwarf, which possesses a large hot spot produced by either a point source or an extended source of total luminosity located at a height above the photosphere.
We describe the wavelength-integrated irradiation flux of Eq. (9) in units of of Eq. (10) by
| (15) |
and consider irradiation parameters up to 200. We use an unheated white dwarf atmosphere with effective temperature K and log , the approximate parameters of the white dwarf in AM Her (Gänsicke et al. 1995, 2005). The chosen effective temperature is typical also of the white dwarfs in other polars (Araujo-Betancor et al. 2005). Note that with K and K, for and amounts to 16 times and 1600 times the nominal blackbody flux, respectively.

4.1 Case 1: Isotropic irradiation of a plane-parallel atmosphere
In Figure 2, we show an example of the relation between the incoming and outgoing flux for , i.e., the outgoing flux and the effective temperature of the heated surface element is K. The optical/infrared irradiation is reprocessed into the outgoing ultraviolet flux sufficiently high up in the atmosphere to cause an inversion in the temperature stratification and the formation of emission line cores.
In Figure 3, we show the emitted spectral flux and the temperature stratification for five selected values of with and 30.5. Our calculations cover a range of to , with a model for a lower value of acting as a start model for the next higher . For large , instabilities in the temperature stratification develop (see e.g. the model for in Fig. 3, right panel), which ultimately limit the manageable irradiation level. Since we are still far from the Eddington limit, we think that this deficiency can be mended in future applications.
For moderate irradiation with , the temperature inversion (Fig. 3, right panel) is barely noticeable and the temperature stays essentially constant as a function of the Rosseland optical depth until it merges into the temperature profile of the unheated white dwarf at large optical depths. For , a pronounced temperature inversion evolves and for still higher values, , a hot corona develops at optical depths . As a consequence, the outgoing spectra display filled-up Lyman lines for and emission cores beyond. The toy model devised by Gänsicke et al. (1998) for AM Her assumed a temperature independent of in the outer atmosphere and yielded filled up lines very similar to the situation obtained here for .


4.2 Case 2: Irradiation of a plane-parallel atmosphere at a fixed angle
We have calculated a 2-D grid of model atmospheres for the same range of incident fluxes as above, to 200, and for direction cosines to in steps of 0.1, with the angle under which the irradiation occurs. For each atmosphere with irradiation parameters , our database contains the intensities as a function of wavelength for a range of emission angles , with cos to 1.0 in steps of 0.1. Selected results for and 6.7 and and 1.0 are shown in Fig. 4. The left panel is for (looking perpendicular into the irradiated atmosphere), the right one for (looking under a grazing angle into the atmosphere). In both panels, the solid curves are for vertical irradiation () and the dashed curves for grazing irradiation (). Finally, in both panels, the lower and upper pair of curves are for irradiation parameters and 6.7, respectively. The individual curves show that irradiation incident vertically on the atmosphere leads to weaker emission cores than grazing irradiation, which is reprocessed high up in the atmosphere. Radiation leaving the atmosphere vertically originates at larger depths and displays broader absorption lines compared with the radiation leaving the atmosphere at large . Low-level irradiation () preserves the limb darkening of the un-irradiated atmosphere, whereas grazing irradiation at the higher irradiation level () leads to limb brightening in the continuum and even more so in the lines. While this is what one might expect intuitively, the quantitative results allow us to construct models of accretion-induced irradiation for more complicated geometries.
4.3 External point source and extended source
We consider two models of the radiation received from the entire white dwarf irradiated by a source of luminosity . The simpler model assumes a point source located at a height above the surface and the more involved one assumes an extended source at the same height, consisting of an array of point sources of equal luminosity , with to . Fig. 5 illustrates the irradiation geometry.
For irradiation by a point source, the spectral flux observed at Earth is given by the sum over the contributions from the surface elements visible for a given orientation of the spotted white dwarf from the direction of the observer,
| (16) |
Here, is the distance between the observer and the source, and cos the area and the cosine of the viewing angle of the -th surface element with the angle between the normal to this element and the direction to the observer, and and the irradiation parameters of the element as defined above, of which is given by
| (17) |
with the distance between the irradiation source and the -th surface element as depicted in the central graph in Fig. 5. Since each surface element is characterized by uniquely defined values of and , can readily be calculated using the spectral intensities from the database.

The situation differs for an extended source as depicted in Fig. 5. The right-hand graph shows a schematic and the left-hand graphs the actual model in which the extended source is approximated by a set of subsources of luminosity with . Because of the curvature of the white dwarf surface, only a subset contributes to the irradiation of the -th surface element. The element is irradiated by each subsource with index under its own angle of incidence with . The irradiation parameter for the -th element is given by the first summation term
| (18) |
A complication arises from the fact that the in the sum cover a finite range preventing the direct use of the database spectra. The exact solution would require us to calculate for each single surface element a custom-tailored atmosphere model taking into account the irradiation fluxes from all subsources visible to that surface element, which would be extremely time consuming. For simplicity, we have opted, therefore, to replace the actual distribution of for the -th surface element by a flux weighted mean , as defined by the right-hand equality in Eq. (18), and use the database spectra to calculate the observed spectral flux as
| (19) |
The radial temperature profiles of the spot created by irradiation from a point source and an extended source differ substantially. As an example, we compare in Fig. 6 the temperature distributions over the polar cap of a white dwarf irradiated by an isotropically emitting point source of luminosity at a height (solid curves) and by an extended source of the same total luminosity represented by an array of subsources at the same height and distributed over an area with a radius (dashed curves). We use cm appropriate to a 0.6 white dwarf. The upper and lower set of curves are for and , respectively. The abscissa is the angular separation from the center of the source, as defined in Fig. 5 (center graph). The extended source is seen to heat a larger area to a lower peak temperature. These temperature distributions do not account for cyclotron beaming, which would broaden them, nor for contributions from the stream or the X-ray source, which would narrow them.
5 Application to HST/GHRS observations of AM Her
AM Her, the bright prototype of polars, oscillates irregularly between states of high and low (or possibly zero) accretion on time scales of months to years and represents, therefore, an ideal laboratory in which to study the irradiation-heated white dwarf. Since the discovery that the far ultraviolet continuum of AM Her is dominated by the white dwarf (Heise & Verbunt 1988), numerous spectroscopic studies have added to our knowledge of the response of its atmosphere to accretion and accretion-induced irradiation. In the low state, a deep absorption line is observed at all orbital ( rotational) phases, which becomes largely filled-up in the high state (Gänsicke et al. 1995, 1998, 2005). The same holds for the higher Lyman lines (Mauche & Raymond 1998). The lack of absorption is illustrated by the conclusion of Greeley et al. (1999) that the continuum is surprisingly well represented by a blackbody. Our calculations add to an understanding of the atmospheric structure of the white dwarf in AM Her and provide an internally consistent explanation for the lack of deep Lyman absorption lines. Since AM Her is typical of the class of polars, they add to our understanding of polars, in general.
For our specific model calculations, we use a distance of AM Her pc (Thorstensen 2003), a radius of the white dwarf cm appropriate for a mass of 0.6 (Gänsicke et al. 1995), and an inclination , which is within the range of reported for AM Her (Gänsicke et al. 2001). We add interstellar absorption in the cores of the Lyman lines using an interstellar column density of atomic hydrogen, H-atoms cm-2, which reproduces the width of the narrow absorption core observed in the line of AM Her (Gänsicke et al. 1998). The continuum spectral shape is not affected noticeably by the observational uncertainty in the column density. The height and radius of the irradiation source are taken as and , respectively, which yield the observed spot size of % of the white dwarf surface area (Gänsicke et al. 1995; Mauche & Raymond 1998; Gänsicke et al. 2005). With these assumptions, we calculated the observed spectrum as a function of orbital phase . The two left-hand graphs in Fig. 5 illustrate the aspect of the white dwarf at two orbital phases, (best visibility of the spot) and (spot near the horizon, source located above the white dwarf).
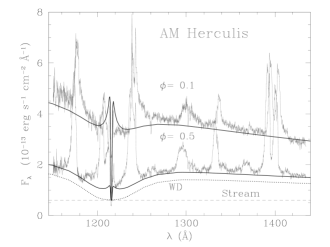
Fig. 7 shows the January 1997 high state Hubble Space Telescope GHRS spectra of AM Her at orbital phases and from Gänsicke et al. (1998) as grey curves (compare the illustrations in Fig. 5). The spectra display strong Doppler-broadened asymmetric emission lines of CIII, SiIII, , NV, SiIII, CII/CII, and SiIV, which originate in the accretion stream. We estimate the continuum flux associated with the stream emission as follows. Gänsicke et al. (2005) have compared the spectra of AM Her at different accretion levels and find a wavelength-independent stream contribution to the continuum flux for the June 2000 high state of . Converted to the brighter January 1997 high state, this contribution is about . Priedhorsky et al. (1978, their Fig. 1) observed this component with U-band and V-band fluxes of 0.6 and , respectively, and noted that it decreases in the infrared as . Fig. 7 shows the calculated spectra at and with the stream contribution (dashed line) added. The resulting model spectra are seen to provide an adequate fit to the observed continuum specta at both orbital phases simultaneously (Fig. 7, solid curves). The eye fit fixes the fractional luminosity intercepted and reemitted by the extended spot to , of the order of 10% of the bolometric luminosity. At a height of 0.1 , the white dwarf subtends a solid angle of and the implied total luminosity of the irradiation source would be , but this number may be misleading because it depends on the actual height of the source and its angular emission characteristics. Presently, we prefer simply to compare the integrated model flux for at Earth with the observed fluxes of the potential irradiation sources, which contribute to the heating of the polar cap. The model flux longward of 912 Å at is , but an additional or 65% of the total is hidden in the Lyman continuum. This large fraction of the Lyman continuum flux has not so far been considered in the energy balace of AM Her, but its existence is supported by the observed pronounced Balmer and Paschen jumps in emission in AM Her’s high state (Schachter et al. 1991). The fluxes of the irradiation sources at Earth appropriate for the January 1997 high state include a cyclotron flux of (Bailey et al. 1988, see also Gänsicke et al. 1995), a stream contribution for Å of plus probably a substantial Lyman continuum flux, and a hard X-ray flux converted from the April 1991 high state value of (Gänsicke et al. 1995) to , assuming that the conversion factor is the same as in the FUV. The cyclotron flux complemented by fractions of the stream and hard X-ray components can account for the observed flux of the heated polar cap longward of 912 Å. The predicted Lyman continuum flux from the polar cap requires an additional source. Candidates are the Lyman continuum emission from the lower section of the optically translucent accretion stream and the potential soft X-ray emission from a spray of accreted matter lifted above the photosphere of the white dwarf as a reaction to the drastic fluctuations in ram pressure which occur in non-stationary accretion. It is clear that the hard X-ray source can not play a major role because of its limited luminosity and the low conversion efficiency of hard X-rays, as addressed in the next section.
6 Discussion
We have quantitatively reproduced the Å continuum spectra of AM Her in its high state of accretion by a model that considers a large polar cap heated by irradiation from the accretion region. Irradiation strongly affects the temperature stratification of the white dwarf atmosphere in the heated polar cap. Strong heating leads to an inversion of the radial temperature profile in the atmosphere, causes the Lyman absorption lines to fill up completely, and produces substantial emission in the Lyman continuum. The known irradiation sources can account for the observed reprocessed flux longward of the Lyman limit, but an additonal source is needed to account for the predicted Lyman continuum flux. The implied luminosity of the polar cap is larger than considered previously (Gänsicke et al. 1995) and stresses the point that the reprocessed flux emerges primarily in the FUV and not in the soft X-ray regime as predicted by the early simple models of polars (King & Lasota 1979; Lamb & Masters 1979).
Since X-ray heating (van Teeseling et al. 1994) has not been considered here it is appropriate to discuss the potential contribution from that source in some detail. The horizontal temperature profile of the spot vs. distance from the spot center and the vertical atmospheric temperature profile at a given position may both be expected to differ for irradiation with either optical/infrared radiation or hard X-ray bremsstrahlung. Cyclotron radiation will produce a larger spot than bremsstrahlung because it originates higher up in the post-shock region and its beaming properties allow it to reach regions further away from the spot center. This difference is strenghtened by the lower shock heights of the denser, bremsstrahlung-dominated shocks (Eq. 14) and by the fact that bremsstrahlung is emitted isotropically and irradiation is thereby concentrated closer to the spot center. For a given surface element, one can judge the efficiency of heating by cyclotron radiation and by bremsstrahlung as follows. As seen from Fig. 3 (right panel), cyclotron heating is most intense at Rosseland optical depths but reaches down to the photosphere and beyond. Hence, cyclotron radiation is completely reprocessed fairly high in the atmosphere. Estimating the efficiency of bremsstrahlung heating requires us to consider the competition between photoabsorption and Compton scattering. Hydrogen is 99% ionized at the relevant levels of our atmospheres, which still allows atomic transitions to determine and causes the electron scattering optical depth to become . For the typical 10 keV bremsstrahlung photons, on the other hand, photoabsorption is negligible with . Hence, bremsstrahlung photons will penetrate far below the photosphere and are preferentially (back)scattered rather than photoabsorbed with the consequence of ineffective atmospheric heating (van Teeseling et al. 1994). Heating by bremsstrahlung may be important, however, if a finite metalicity of the atmosphere drastically increases the absorption cross section. Since the metalicity of the atmosphere will be enhanced in the inner spot where accretion occurs, X-ray heating may dominate there, while cyclotron heating is expected to dominate further away from the spot center. While a more detailed model should take both irradiation sources into account, we presently lack information on parameters like the mass inflow rate per unit area and the ensuing metalicity as functions of distance from the spot center.
The heating of the extended polar cap from the post-shock source tends to zero for vanishing shock height because then all downward directed emission is intercepted by the atmosphere within the proper accretion spot. Disregarding irradiation by emission from the pre-shock stream for the moment, our model predicts that high-field polars, in which all cyclotron and X-ray emission occurs in low-lying shocks (see Eq. 14), should lack strongly irradiation-heated polar caps. This is, in fact, the case for the 200 MG system AR UMa in its low state with some remnant cyclotron emission and an amplitude of the orbital modulation at 1400Å of only 5% (Gänsicke et al. 2001). An investigation of the temperature distributions of a larger sample of white dwarfs in polars would shed light on some poorly understood aspects of accretion physics. Such a study would have to consider cooling of the deeply heated polar cap as well as the relevent heating processes. Note that accreting white dwarfs are generally hotter than single white dwarfs of the same age (Araujo-Betancor et al. 2005) as a result of compressional heating (Townsley & Bildsten 2003), but this process is rooted in the entire non-degenerate envelope (and to some extent in the core) and heats the entire star and not just the polar cap where accretion takes place.
Finally, a source of uncertainty in the calculated spectra warrants mentioning. Our atmospheric model disregards the compression of the outer atmosphere by accretion and is applicable strictly only outside the region of the extended source, assumed to be fed by accretion. The bombardment of the atmosphere by charged particles adds an external pressure and affects the structure of the upper atmosphere where the emission lines originate. The physics of bombarded atmospheres is complicated and has been treated to a certain extent by Woelk & Beuermann (1992). A simple estimate suggests that the effect may not be negligible. For a mass flow rate g cm-2s-1, which is below present detection techniques, the ram pressure , with the free-fall velocity, amounts to a few percent of the photospheric pressure and severely compresses the atmosphere only outside . A mass flow rate ten times higher, however, reaches down to . Under these circumstances, a more detailed study of the line profiles and the strength of the Lyman continuum in irradiated atmospheres of mCVs, including NLTE effects, requires a substantially larger effort.
Acknowledgements.
MK was supported by the Deutsche Forschungsgemeinschaft DFG within the Graduiertenkolleg “Strömungsinstabilitäten und Turbulenz“. BTG was supported by a PPARC Advanced Fellowship. We thank Sonja Schuh and the anonymous referee for useful comments on the manuscript.References
- Araujo-Betancor et al. (2005) Araujo-Betancor, S., Gänsicke, B. T., Long, K., et al. 2005, ApJ, 622, 589
- Bailey et al. (1988) Bailey, J., Hough, J. H., & Wickramasinghe, D. 1988, MNRAS, 233, 395
- Barman et al. (2004) Barman, T. S., Hauschildt, P. H., & Allard, F. 2004, ApJ, 614, 338
- Beuermann (2004) Beuermann, K. 2004, in ASP Conf. Ser. 315: IAU Colloq. 190: Magnetic Cataclysmic Variables, 187
- Brett & Smith (1993) Brett, J. M. & Smith, R. C. 1993, MNRAS, 264, 641
- Fischer & Beuermann (2001) Fischer, A. & Beuermann, K. 2001, A&A, 373, 211
- Frank et al. (1988) Frank, J., King, A. R., & Lasota, J.-P. 1988, A&A, 193, 113
- Gänsicke et al. (1995) Gänsicke, B. T., Beuermann, K., & de Martino, D. 1995, A&A, 303, 127
- Gänsicke et al. (1998) Gänsicke, B. T., Hoard, D. W., Beuermann, K., Sion, E. M., & Szkody, P. 1998, A&A, 338, 933
- Gänsicke et al. (2001) Gänsicke, B. T., Fischer, A., Silvotti, R., & de Martino, D. 2001, A&A, 372, 557
- Gänsicke et al. (2005) Gänsicke, B. T., Long, K., Barstow, M., & Hubeny, I. 2005, ApJ, in press
- Greeley et al. (1999) Greeley, B. W., Blair, W. P., Long, K. S., & Raymond, J. C. 1999, ApJ, 513, 491
- Heise & Verbunt (1988) Heise, J. & Verbunt, F. 1988, A&A, 189, 112
- King & Lasota (1979) King, A. R. & Lasota, J. P. 1979, MNRAS, 188, 653
- König (2005) König, M. 2005, PhD thesis, University of Göttingen, Germany
- Kuijpers & Pringle (1982) Kuijpers, J. & Pringle, J. E. 1982, A&A, 114, L4
- Lamb & Masters (1979) Lamb, D. Q. & Masters, A. R. 1979, ApJ, 234, L117
- London et al. (1981) London, R., McCray, R., & Auer, L. H. 1981, ApJ, 243, 970
- Mauche & Raymond (1998) Mauche, C. W. & Raymond, J. C. 1998, ApJ, 505, 869
- Priedhorsky et al. (1978) Priedhorsky, W., Matthews, K., Neugebauer, G., Werner, M., & Krzeminski, W. 1978, ApJ, 226, 397
- Ramsay & Cropper (2004) Ramsay, G. & Cropper, M. 2004, MNRAS, 347, 497
- Rybicki (1971) Rybicki, G. B. 1971, JQRST, 11, 589
- Schachter et al. (1991) Schachter, J., Filippenko, A. V., Kahn, S. M., & Paerels, F. B. S. 1991, ApJ, 373, 633
- Thomson & Cawthorne (1987) Thomson, A. M. & Cawthorne, T. V. 1987, MNRAS, 224, 425
- Thorstensen (2003) Thorstensen, J. 2003, AJ, 126, 3017
- Townsley & Bildsten (2003) Townsley, D. M. & Bildsten, L. 2003, ApJ, 596, L227
- van Teeseling et al. (1994) van Teeseling, A., Heise, J., & Paerels, F. 1994, A&A, 281, 119
- Woelk & Beuermann (1992) Woelk, U. & Beuermann, K. 1992, A&A, 256, 498