11email: Bram.Acke@ster.kuleuven.be 22institutetext: European Southern Observatory, Karl-Schwarzschild Strasse 2, D-85748 Garching bei München, Germany
Resolving the disk rotation of HD 97048 and HD 100546 in the [O i] 6300Å line: evidence for a giant planet orbiting HD 100546 ††thanks: Based on observations collected at the European Southern Observatory, Paranal, Chile (program number 075.C-0172).
Abstract
Aims. We intend to spatially and spectrally resolve the [O i] emission region in two nearby Herbig stars.
Methods. We present high-resolution ( = 80,000) VLT/UVES echelle spectra of the [O i] 6300Å line in the Herbig Ae/Be stars HD~97048 and HD~100546. Apart from the spectral signature, also the spatial extent of the [O i] emission region is investigated. For both stars, we have obtained spectra with the slit positioned at different position angles on the sky.
Results. The [O i] emission region of HD 100546 appears to be coinciding with the dust disk, its major axis located at 15011∘ east of north. The SE part of the disk moves towards the observer, while the NW side is redshifted. The [O i] emission region rotates counterclockwise around the central star. For HD 97048, the position angle of the emission region is 16019∘ east of north, which is the first determination of this angle in the literature. The southern parts of the disk are blueshifted, the northern side moves away from us. Our data support the idea that a gap is present at 10 AU in the disk of HD 100546. Such a gap is likely planet-induced. We estimate the mass and orbital radius of this hypothetical companion responsible for this gap to be and 6.5 AU respectively.
Conclusions. Based on temporal changes in the [O i] line profile, we conclude that inhomogeneities are present in the [O i] emission region of HD 100546. These “clumps” could be in resonance with the suggested companion, orbiting the central star in about 11 yr. If confirmed, these observations could point to the existence of an object straddling the line between giant planet and brown dwarf in a system as young as 10 million years.
Key Words.:
circumstellar matter — stars: pre-main-sequence — planetary systems: protoplanetary disks — planetary systems: formation — stars: individual: HD 97048 — stars: individual: HD 1005461 Introduction
HD 97048 and HD 100546 are two of the most famous Herbig Ae/Be stars. The shape of the mid-IR spectral energy distribution (SED) suggests that their circumstellar disks have a flared geometry (Dominik et al. 2003). For HD 100546, broad-band images —sensitive to scattered light— of the disk structure have been obtained in the optical and near-IR (Pantin et al. 2000; Augereau et al. 2001; Grady et al. 2001). Furthermore, the disk around HD 100546 has been spatially resolved at UV–to–mm wavelengths in the continuum as well as in spectral features emanating from the disk (e.g. Wilner et al. 2003; Liu et al. 2003; van Boekel et al. 2004; Leinert et al. 2004; Grady et al. 2005). The disk’s appearance and position on the sky are hence relatively well-established for this source: the inclination of the system is 50∘ and the position angle of the major axis is approximately 150∘ east of north (e.g. Liu et al. 2003). The disk of HD 97048 on the other hand has not been observed in scattered light, although the mid-IR (around 10 m) observations of van Boekel et al. (2004) show that the source is resolved in both the continuum and the PAH bands.
Herbig Ae/Be stars are by definition emission line stars. In a significant fraction of these objects, also forbidden transition lines are observed. In a previous paper (Acke et al. 2005, hereafter AVD05), we have studied the [O i] lines at 6300 and 6363Å. We have shown that for HD 97048 and HD 100546, the spectral line profiles are in agreement with the theoretical profiles emanating from excited neutral oxygen atoms in the surface of a flared, rotating passive disk. We have demonstrated that these atoms cannot be thermally excited, and suggested the excitation may be due to the photodissociation of OH and H2O molecules in the surface layers of the disk by the UV radiation field of the central star.
Since both sources are relatively nearby and the emission region of the [O i] 6300Å line is expected to be spatially extended, we have tried to obtain spatially resolved high-resolution spectra of the targets around this line. We present the data set and reduction method in the following Section. The analysis of the data and the confrontation with the model are described in Sects. 3 and 4. In Sect. 5 we discuss new evidence for the presence of a giant planet around HD 100546, based on the results of the analysis. The mass and orbital radius estimates for this object ( and AU respectively) agree strikingly well with previous studies concerning the gap in HD 100546’s disk (Bouwman et al. 2003; Grady et al. 2005) and the spiral-arm structure in the outer disk (Quillen et al. 2005). The final conclusions are summarized in Sect. 6.
2 Data set and reduction method
We have obtained a number of high-resolution ( =80,000) VLT/UVES111http://www.eso.org/instruments/uves/ spectra for HD 97048 and HD 100546, with the slit positioned at different angles on the sky. For HD 100546 we have taken spectra with the slit aligned with (PA = 150∘ east of north) and perpendicular to (PA = 60∘ E of N) the known major axis of the system, as well as at two intermediate PAs (15∘ and 105∘ E of N). For HD 97048, no information on the disk’s inclination or major axis is present in the literature. Therefore, we have chosen random, equally spaced PAs of 0∘, 45∘, 90∘ and 135∘ E of N. The slit length is 12″, while its width is 0.3″. In Table 1, the observation log is presented.
UVES is an echelle spectrograph, which implies that the raw 2D CCD frames contain one spectral direction (along the different orders, perpendicular to the slit) and one spatial direction (perpendicular to the orders, along the slit). The small width of the slit ensures the high spectral resolution needed to spectrally resolve the [O i] line. In the spatial direction the spectra have a resolution of 0.182″/pixel, or equivalently 64 pixels over the 12″ slit length. In a standard reduction scheme, the spectrum of the target is retrieved by integrating the flux in the spatial direction. However, we intend to use both the spectral and spatial information contained in the echelle orders. Therefore, we have taken the pipeline-reduced 2D echelle frames as our starting point. Spectra obtained with the same slit PA were averaged such that the peak of the spatial profile in the continuum of both frames coincides. In the following, we only consider the small part of the UVES CCD around the 6300Å line in the averaged 2D spectrum at each slit PA.
| Object | Date | UT | Slit PA | Exp. time |
| dd/mm/yy | hh:mm:ss | [∘ E of N] | [s] | |
| HD 97048 | 21/03/05 | 04:41:47 | 0 | 300 |
| 21/03/05 | 04:47:43 | 0 | 300 | |
| 22/03/05 | 02:26:21 | 0 | 300 | |
| 22/03/05 | 02:32:18 | 0 | 300 | |
| 27/03/05 | 00:40:24 | 0 | 450 | |
| 27/03/05 | 00:48:49 | 0 | 450 | |
| 27/03/05 | 01:00:48 | 45 | 450 | |
| 27/03/05 | 01:09:12 | 45 | 450 | |
| 27/03/05 | 01:18:56 | 90 | 450 | |
| 27/03/05 | 01:27:22 | 90 | 450 | |
| 27/03/05 | 01:36:49 | 135 | 450 | |
| 27/03/05 | 01:45:14 | 135 | 450 | |
| HD 100546 | 27/03/05 | 01:58:59 | 150 | 105 |
| 27/03/05 | 02:01:40 | 150 | 105 | |
| 27/03/05 | 02:05:25 | 15 | 105 | |
| 27/03/05 | 02:08:06 | 15 | 105 | |
| 27/03/05 | 02:12:03 | 105 | 105 | |
| 27/03/05 | 02:14:44 | 105 | 105 | |
| 27/03/05 | 02:18:36 | 60 | 105 | |
| 27/03/05 | 02:21:16 | 60 | 105 |
[O i] emission of the Earth’s atmosphere, the so-called airglow, can easily be removed from the spectra. The scientific target only fills a fraction of the slit, while the airglow feature is equally strong in all spatial directions on the sky around the source and hence fills the entire slit homogeneously. We have determined the spectral profile of the airglow feature by averaging 22 spatial rows at the top and bottom edge of the echelle order (i.e. outside the region of the slit which is dominated by the target). This average is then subtracted from all (spatial) rows, which results in a 2D airglow-corrected frame.
Instead of integrating over the spatial direction and achieving the “standard” spectrum, we have determined a normalized spectrum at each sampled spatial position. First we have determined the continuum on the blue and red side of the line. We average the continuum over 5 spectral pixels. Hence we obtain an average spatial profile of the continuum blue- and redward of the [O i] line. To determine the interjacent continuum, a linear interpolation in the spectral direction is done at each spatial pixel row. We end up with a 2D continuum. The normalized spectrum of the source at each sampled spatial position is then retrieved by dividing the flux in each spatial row of the 2D echelle frame by the corresponding row of the 2D continuum. This procedure is the straightforward 2D translation of the “standard” normalizing procedure. Furthermore, a 2D continuum-subtracted spectrum is computed by subtracting the 2D continuum from the 2D airglow-corrected science frame. In Fig. 1 we schematically summarize the airglow-removal and normalizing method described above.
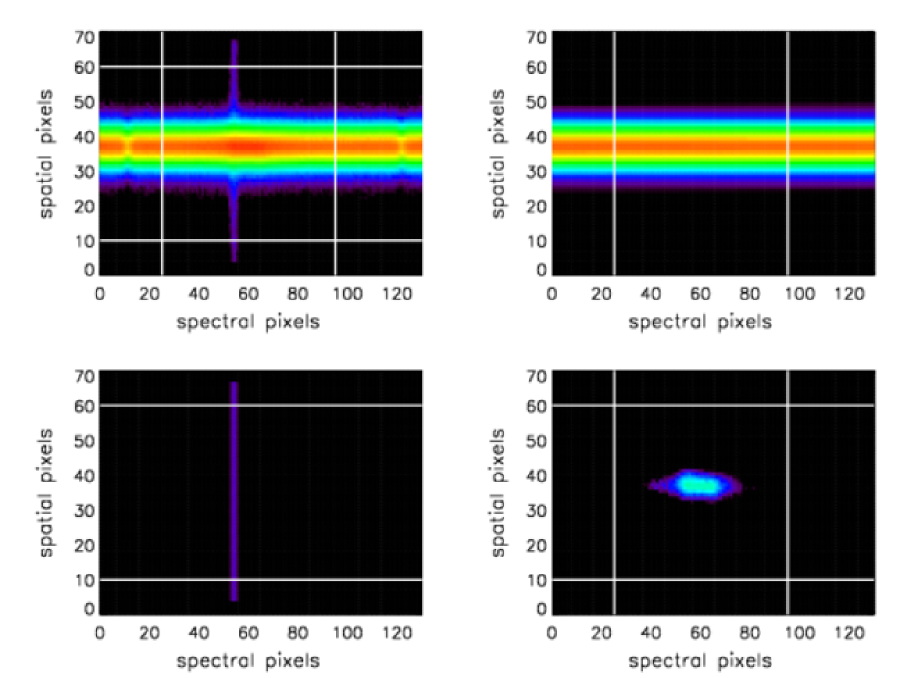
The normalized 2D spectrum, which is not shown in this figure, is retrieved by dividing the airglow-corrected science frame by the 2D continuum.
3 Analysis
AVD05 have shown that the double-peaked profiles observed in the [O i] spectra of many Herbig Ae/Be stars emanate from excited oxygen atoms in the surface layers of an inclined, rotating flared disk. HD 97048 and HD 100546 are two relatively nearby (distances 103 and 180 pc for HD 100546 and HD 97048 respectively, van den Ancker et al. 1998) Herbig stars that were shown to display these double-peaked [O i] emission lines in this study. If the emission region is spatially extended, it is possible to extract spatial information on these objects in the [O i] line. When altering the position angle of the slit on the sky, different spatially dependent spectra are expected to be observed. If the slit is positioned over the target along the major axis of the disk, the normalized spectrum on one spatial side of the order will primarily show the blue peak of the profile, while the spectrum on the other spatial side will predominantly display the red peak. In the case of the slit oriented perpendicular to the disk’s major axis and centered on the star, no change in spectral shape at different spatial positions is expected: the effect is wiped out due to spatial integration in the direction perpendicular to the slit. Intermediate PAs of the slit on the sky lead to intermediate changes in spectral profiles. No effect of slit PA is expected outside the emission line, because the continuum consists of photospheric emission of the central star.
Apart from the normalized spectra at different spatial positions along the slit, we have deduced a second quantity which may help to interpret the observations. As a function of wavelength (or equivalently radial velocity) we have determined the spatial peak position of the echelle order in the continuum-subtracted 2D frame. The quantity is deduced by fitting a Gaussian function to the spatial profile in each spectral column (this technique is called spectro-astrometry, e.g. Takami et al. 2004, and references therein). We have compared these values to the peak position of the underlying continuum. If the slit is positioned along the major axis, one expects to see the spatial peak position shift from one side of the continuum peak position to the other when running through the (spectral) line profile. Together with the spatial peak position, the Gaussian fit delivers a spatial full width at half maximum (FWHM). In the —spatially unresolved— continuum this quantity is a measure for the atmospheric seeing. In the [O i] 6300Å line the FWHM is potentially larger, if the extent of the emission region is significant compared to the atmospheric broadening. As can be derived from Table 2 this is not the case in our observations. The FWHM ratios of the feature and the continuum are within the error bars all equal to unity. We will come back to this point in Sect. 4.
| Object | Slit PA | FWHMcont | FWHMfeat/FWHMcont |
|---|---|---|---|
| [∘ E of N] | [arcsec] | ||
| HD 97048 | 0 | 1.00 | 1.00 0.04 |
| 45 | 0.93 | 1.00 0.04 | |
| 90 | 0.98 | 1.01 0.04 | |
| 135 | 1.13 | 1.00 0.04 | |
| HD 100546 | 15 | 1.32 | 1.01 0.04 |
| 60 | 0.95 | 1.02 0.03 | |
| 105 | 0.98 | 1.01 0.03 | |
| 150 | 1.05 | 1.02 0.03 | |
| AVD05 180pc | 0 | 1.00 | 1.03 |
| 45 | 1.00 | 1.02 | |
| 90 | 1.00 | 1.03 | |
| 135 | 1.00 | 1.02 | |
| AVD05 103pc | 0 | 1.00 | 1.08 |
| 45 | 1.00 | 1.06 | |
| 90 | 1.00 | 1.08 | |
| 135 | 1.00 | 1.06 |
In Figs. 2 and 3 we have shown the (spatially integrated) spectra of HD 100546 and HD 97048 at each slit PA (upper panels). The small differences in spectral shape are likely due to the small slit width (0.3″) and the extended targets, which implies that only a part of the disk falls inside the slit. The second row of figures contains the normalized spectra at different spatial rows around the central spatial position of the order. The latter is the pixel row which contains the peak of the spatial profile of the continuum. Note that, due to limited seeing, the spatial information is blurred out over different spatial rows. Nonetheless, when moving away from the central spatial row, the wings may become more pronounced compared to the rest of the feature, if a small offset of the blue or red emission region on the sky relative to the central star is present. The bottom panels display the spatial peak position of the continuum-subtracted [O i] feature relative to the peak position of the continuum. We have included this plot because it is insensitive to asymmetry in the spectral line profile: for each velocity, the determined central peak position is independent of the total flux at that spectral position. These plots give a more precise view on the spatial peak position of the blue and red wing of the feature than the normalized spectra, in which the relative peak flux of the wings influences the spectral shape at all spatial rows due to atmospheric blurring.
The normalized spectra and spatial peak positions in Figs. 2 and 3 show the signature of an emission region which is linked to the rotating circumstellar disk. For HD 100546, the closest of both targets, this fingerprint is clearest. With the slit positioned 150∘ east of north, i.e. along the disk major axis, the normalized spectra at the NW side of the star show the red wing more pronounced than in the total spectrum, while the blue wing is clearly dominant on the SE side. The same behaviour is seen in the shift in spatial peak position in the feature relative to the continuum: the photocenter of the red wing lies NW, and that of the blue wing SE of the star. The same characteristics are seen in the spectrum at PA 105∘, although less strong. Due to the differential angle of 45∘ between the slit and major axis PA, the spatial extent of the [O i] emission region translates only partially into a spectral effect. At slit PA 60∘, no difference in spatial peak position between the blue and red wing is noted. The normalized spectra show no trend from SW to NE either. However, the entire [O i] feature seems to be shifted to the NE side of the star. We will come back to this in Sect. 5. At PA 15∘ east of north, the spatial profile is reversed: the slit is turned 135∘ on the sky and the north now appears on the top side of the order. The peak position of the red wing is clearly on the N side, confirming the conclusion derived from the spectra at slit PA 105 and 150∘. The blue wing in the PA 15∘ spectrum on the other hand does not shift significantly to the S of the central star. In Sect. 5, we discuss this anomaly.
The distance to HD 97048 is estimated to be 180 pc (van den Ancker et al. 1998). The extent of the [O i] emission region is therefore less clearly present in the data. Nonetheless the spatial peak position in the spectra with PA=0∘ suggests that the red peak is located northward of the central star, while the blue peak lies to the south. This behaviour is confirmed by the spatial peak positions in the PA=135∘ spectrum: the blue wing appears on the SE side, the red wing on the NW side. The two spectra in between (at PA 45∘ and 90∘ east of north) do not display a clear spatial effect.

Middle panels: The normalized spectra at each spatial pixel row around the central spatial position. The spectra are shifted for clarity. The formal spatial distance between two adjacent spectra is 0.182″, but atmospheric seeing blurs the spectra in spatial direction.
Lower panels: The spatial peak position of the continuum-subtracted feature at each spectral row are plotted. The offset is relative to the spatial peak position of the underlying continuum. The scale is in arcsec. The curves are independent of the peak flux in each spectral row and hence give a clear view on the spatial position of each (spectral) part of the line profile. In the top and bottom right of the figures, the positions on the sky —in the direction of the slit PA— are indicated.
The vertical dotted lines indicate the spectral position of the blue and red wings.


4 Discussion: confronting the AVD05 model
4.1 The model as starting point
In AVD05 we have overplotted the spectral profiles of the [O i] lines of HD 100546 and HD 97048 with our model results (Fig. 26 in that paper). In this Section we go back to these models and confront not only their spectral profile, but also their spatial extent with the UVES observations. The parameters of the model which we consider here include a stellar mass of 2.4 , inclination = 45∘ and a surface-density profile R-2.5. 80% of the [O i] emission in our model emanates from the region between 0.8 and 20 AU. For details on the modeling, see AVD05.
To simulate the effects of atmospheric blurring and instrumental spectral broadening of UVES, we have convolved the theoretical (spatially extended) emission line with Gaussian profiles. In spatial direction, we have taken a FWHM equal to 1″—a typical value derived from the UVES observations, see Table 2— while in spectral direction we take the instrumental width to be equal to the average width of six (unresolved) telluric absorption lines near the [O i] feature (3.7 ). The results are presented in Fig. 4. The four top-panel spectra are identical, since we did not simulate the small slit width, but just integrated over the entire disk. The middle panels display the normalized spectra at each spectral row. The shape of the spectrum changes depending on the relative position angle between slit and disk major axis (PA) and the spatial distance to the center of the target. The bottom panels show the theoretical peak position throughout the feature.
Focusing on the bottom row of panels, the following remarks can be made. Qualitatively, the effects seen in the modeled line profile agree with the observations, indicating that the rotation of the disk indeed causes the double-peaked [O i] 6300Å lines in HD 97048 and HD 100546. Nevertheless, there is a anomaly in the magnitude of the spatial effect: the shift of the peak positions in the modeled profile is approximately three times larger than the observed shift. The presented model is however not a fit to our data, but an ad hoc solution. As we have shown in AVD05, this solution is far from unique in explaining the observed (spectral) profiles. Moreover, the effects of atmospheric and instrumental broadening have been mimicked by convolving the profile with Gaussian curves. This is a first-order approximation. The real point spread function may blur out the shift in spatial peak position even more or at least differently.
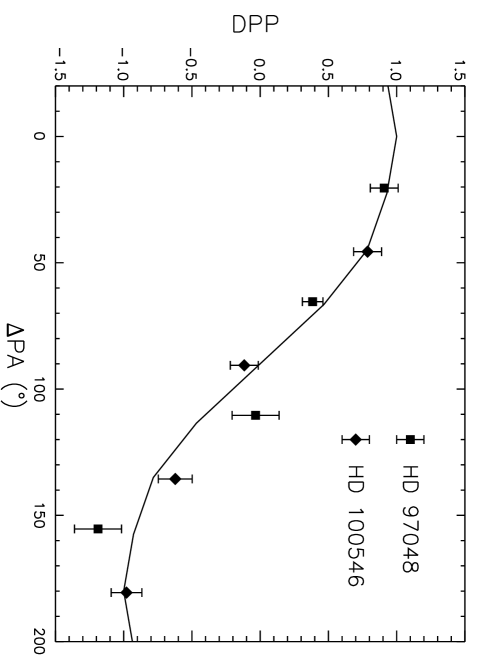
To show that the shift in spatial peak position in both targets is in qualitative agreement with the models, we have calculated the relative difference in peak position (DPP) between the red and blue wing. The spectral position of the wings is indicated with the vertical lines in Figs. 2, 3 and 4. The relative peak position is computed for each slit PA. For the models the values are normalized to unity by dividing them by the maximum DPP (at PA = 0∘). For HD 97048 and HD 100546, we have fitted the DPPs with a cosine function with and fit parameters. The best-fit () amplitude is used to normalize the DPPs to unity. The best-fit PA offset indicates the position angle of the major axis of the disk. In Fig. 5, the modeled and observed DPPs are displayed. From the fit, we can derive that the PAs of the disk major axis in HD 97048 and HD 100546 are respectively 16019∘ and 15011∘ east of north222As a convention we have defined the PA of the disk major axis in the direction of the blueshifted part of the disk.. Note that the —independently determined— PA value for HD 100546’s disk is in perfect agreement with the known PA of this system (150∘ E of N, e.g. Liu et al. 2003). We conclude that the S–SE parts of the disks around HD 97048 and HD 100546 rotate toward us, while the N–NW side moves away from us.
Note that the spatial peak position of the feature in HD 100546 is not symmetric. In the [O i] line, the NE side of the order seems to be brighter than the SW side, pulling the peak position —which is a measure for the photocenter— in this direction. This asymmetry may be due to the fact that the disk around HD 100546 is a flared disk: the surface of the side of the disk closest to the observer is seen under a more acute angle than the surface of the opposite side. Therefore, the projected surface of the nearest side of the disk is smaller than the projected surface of the opposite side. The modeling of this effect is beyond the scope of the present paper. However, to give an idea about its magnitude, we can make a simple estimate. Assuming a typical, homogeneous flared disk with an opening angle of 20∘ and an inclination of 50∘, the viewing angle between the line of sight and the normal to the surface of the nearest side of the disk is about 70∘ (i.e. almost “edge-on”). The viewing angle on the opposite side is approximately 30∘. The projected surface of the nearest side of the disk is under these assumptions only 30% of the projected surface of the other side of the disk. As opposed to the spatial shift of the blue- and redshifted side of the disk, which is maximal when slit and disk major axis are aligned, this effect influences the spatial peak positions in a spectrum most when the slit and major axis are perpendicular. When slit and major axis are aligned, the spatial integral —perpendicular to the slit— wipes out the signature of the differences in projected surface. This is consistent with the observations of HD 100546: at PA 15∘ and 60∘, the effect may play a role. This would indicate that the NE side of the disk is further away from the observer than the SW side. If so, our knowledge on the rotation of the [O i] emission region can be further refined: not only can we deduce that the blue wing is located on the SE side of the disk, but also that the rotation occurs counterclockwise around the central star.
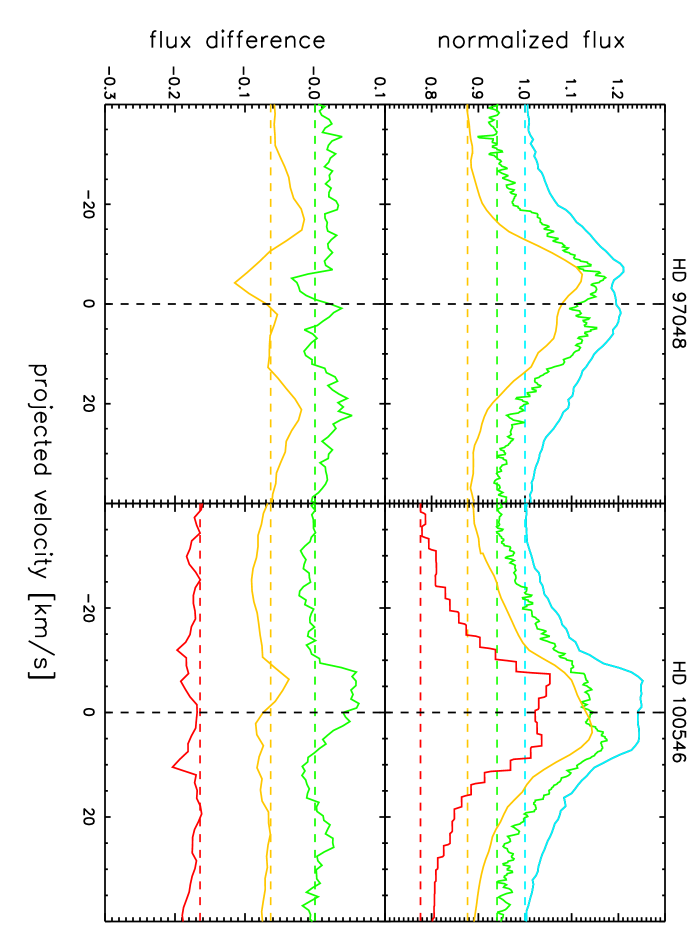
A second effect which is not taken into account in our model is possible inhomogeneity in the [O i] emission region. Obviously, deviations from homogeneity do occur: the spectral [O i] feature is not symmetric and temporal changes in the line profiles are observed. For both targets, we have other medium-to-high resolution 6300Å spectra at our disposal (ESO 3.6m CES and ESO 1.5m FEROS, and CAT CES for HD 100546 only). These spectra are described in detail in AVD05. In Fig. 6 the spectra are displayed. The plot allow us to take a first glimpse at the temporal behaviour of the [O i] line in Herbig Ae/Be disks. The CAT spectrum ( = 65,000) is taken in 1994, the FEROS spectra ( = 45,000) in 1999 and the ESO 3.6m spectra ( = 120,000) in 2002 (see AVD05 for the exact dates). Assuming that emitting gaseous “clumps” survive in the disk surface over multiple orbital periods, the temporal changes in the spectral shape of the [O i] line must display periodic behaviour, linked to the disk’s rotation. The respectively 3 and 4 spectra of HD 97048 and HD 100546 are hardly sufficient to describe potential periodicity in the [O i] 6300Å line, but some conclusions can nevertheless be drawn. First of all, the equivalent width () of the [O i] 6300Å line changes with time. For HD 97048, this change is small (=0.141, 0.135 and 0.160Å in the FEROS, ESO 3.6m and UVES spectrum) while it is larger for HD 100546 (=0.183, 0.180, 0.152 and 0.161Å in the CAT, FEROS, ESO 3.6m and UVES spectrum). Also the variations in spectral shape are larger in HD 100546. Due to the short time base of the observations —6 and 11 yr for HD 97048 and HD 100546 respectively— only the influence of fast orbiting clumps can potentially be detected: for a 2.4 star, 6 and 11 yr correspond to the orbital period at 4.5 and 7 AU respectively. Inhomogeneities closer in orbit the star at least once in this time span. Due to the fact that spectroscopic observations are only sensitive to the projected velocity, non-homogeneous emission from the high-velocity part of the disk influences the spectral shape of the feature over the entire velocity range, and not only at high projected velocities. For HD 100546, the double-peaked profile seems to alternate between a blue-wing dominated (CAT, UVES) and a red-wing dominated feature (FEROS, ESO 3.6m). We interpret this as additional evidence for an [O i] emission region which corotates with the circumstellar disk. Furthermore, the presence of clumpy emission provides an alternative explanation for the observed spatial peak positions at different slit PAs. We come back to this point in Sect. 5, when we discuss the possible origin of the clumps.
4.2 The observations as starting point
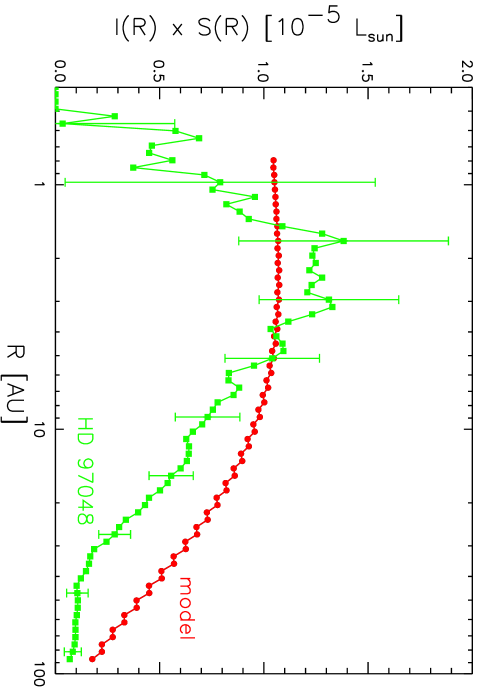
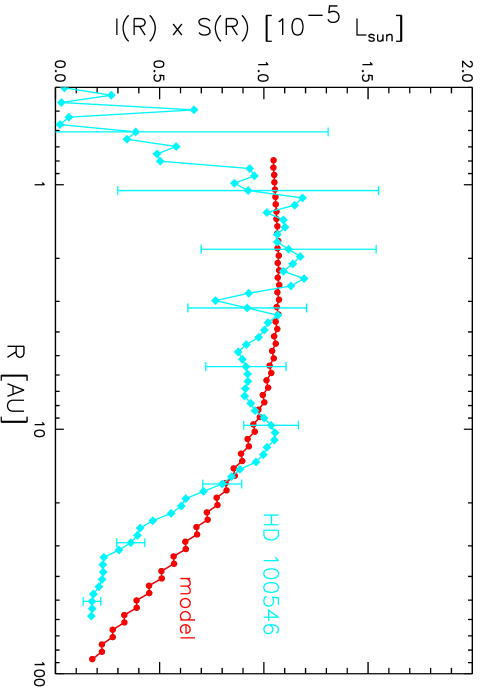
The accuracy of our model can also be tested starting from the observations. The spectral profile of the [O i] 6300Å line contains information on the velocity field of the [O i] emission region. Assuming a Keplerian velocity field, a disk inclination and a distance to the target, the spatial extent of the [O i] emission region can be calculated from the emission line. First we have averaged the blue- and red wing of the spectral profile in order to construct a symmetric 6300Å line. The highest-velocity () bin which contains [O i] flux (i.e. where the wing starts to stand out above the continuum) can be linked to the innermost part of the [O i] emission region. The observed flux in this bin is attributed to a ring at radius . Only this inner ring contributes to the flux in the bin, because the Keplerian velocity is smaller at larger radii and because no [O i] emission is detected at higher velocities. We subtract the theoretical emission profile of this ring, which covers all projected velocities from to , from the total spectral line profile. The spectral bin at of the residual is now empty and we continue with the next high-velocity bin. The method is repeated until the spectral profile is completely dismantled down to = 0 . In this way the observed intensity-versus-radius profile can be reconstructed. For both HD 97048 and HD 100546 we have taken and = 45∘. In Fig. 7 we display the observed intensity-versus-radius curves, , deduced from the spectral data of HD 97048 and HD 100546, and our modeled intensity distribution. We have multiplied the curves with the surface of the ring at radius R. In this way, the relative contribution at each radius can readily be compared. Since the modeled flared disk is truncated at the dust destruction radius (0.8 AU in the case of an A0V star), in our models the [O i] emission region also starts at this distance to the star. The outer limit is chosen to be 100 AU. Beyond this limit, the modeled intensity drops quickly and is insignificant compared to the [O i] intensity closer to the star. The observed curve of HD 97048 has one prominent peak. Under the current assumptions of stellar mass and inclination, 80% of the total [O i] emission emanates from the region between 0.9 and 12 AU. The curve of HD 100546 is qualitatively equal to that of HD 97048 out to 5 AU, but shows a strong second “bump” further out, around 15 AU. 80% of the total [O i] emission emanates from the region between 1.2 and 23 AU, with 25% emanating from the bump. The observations suggest that the [O i] emission regions of HD 97048 and HD 100546 are more concentrated around the central star than in our model. The drop-off at large radii is significantly stronger than predicted in both sources. The inner edge of the model (0.8 AU) on the other hand is in agreement with the observed intensity-versus-radius curve: no significant [O i] flux is detected at high velocities.
We have confronted the observational intensity-versus-radius curves derived from the spectral line profiles to the spatial extent deduced from the spatial information contained in the UVES spectra. Assuming a stellar mass of 2.4 , an inclination of 45∘ and a distance of 180 pc for HD 97048, the spatial peak positions throughout the [O i] line derived from the spatial and spectral information agree. The maximum value of the ratio FWHMfeat/FWHMcont derived from the observed intensity-versus-radius curve is 1.01. This value is in agreement with the values in Table 2: the spatial extent is not resolved in the spatial FWHM of the feature. Adopting the same stellar mass and inclination for HD 100546 and a distance of 103 pc leads to a significant difference in spatial peak position as derived from the spectrum-based intensity curve and the spatial UVES information. The spatial peak position estimated from the intensity curve is 1.5 times larger than the measured UVES peak position. The ratio of the FWHM in the feature and in the continuum is 1.05. This is on the verge of the spatial resolution of our UVES observations (see Table 2). This factor may arise from an erroneous distance to the source. The latter is needed to convert the radial scale to the angular scale on the sky. The possibility that the distance to HD 100546 is underestimated by a factor of 1.5 seems however unlikely, considering the small error bars (7 pc) given by van den Ancker et al. (1998). In order to reconcile both measurements, either the stellar mass of HD 100546 has to be increased to 3.6 or the inclination must be increased to 60∘, or a combination of both proportional to . When incorporating the 1.5 factor, the maximum ratio of the FWHM in feature and continuum decreases to 1.03, undetectable in the current UVES observations. The first peak in would then shift from 1.5–5 AU to 1–3 AU and the second [O i] emission “bump” at 10–25 AU to 7–17 AU.
5 A massive planet orbiting HD 100546?
5.1 The presence of a gap reconfirmed
Bouwman et al. (2003) have suggested that the mid-IR continuum emission in the SED of HD 100546 points to the presence of a dust-poor cavity around 10 AU. This cavity is believed to be planet-induced. Due to lack of dust at 10 AU, the far-side rim of the gap is directly irradiated by the central star. The mid-plane temperature is therefore high and the vertical scale height of the disk at the far side of the gap is more than a factor of two that of a standard flared disk at the same radius. The suggested gap and wall explain the relative lack of mid-IR continuum flux shortward of 10 m and the strong excess flux at longer wavelengths. The presence of this gap has been confirmed by mid-IR nulling interferometric measurements (Liu et al. 2003) and Hubble Space Telescope (HST) STIS observations (Grady et al. 2005). The latter authors have observed HD 100546 in the far-UV wavelength range, obtaining long-slit spectra. They suggest that the gap has an outer radius of 13 AU and is not centered on the star but rather on a region 5 AU southeast of the star. They exclude that an earlier-than-M5-type stellar companion is present within 2.5-10 AU of HD 100546.
The intensity-versus-radius profile derived from the [O i] feature in HD 100546 (Fig. 7) may also be interpreted in this framework. The curve in HD 100546 a local maximum at short radii and declines furtherout up to 5 AU. The curve of HD 97048 displays the same behaviour in this region, which suggests that the inner parts of the [O i] emission region are similar in both sources. Further out however, the disk structure of HD 100546 appears to be significantly different than that of other Herbig Ae/Be stars such as HD 97048. Exactly where Bouwman et al. (2003) and Grady et al. (2005) locate the outer edge of the gap, there is a significant excess in [O i] emission in HD 100546. Note moreover that the curve of HD 100546 is continuous and has a local minimum at 6–10 AU. The [O i] emission region is suggested to be located in the disk surface layer (AVD05). If an additional “wall” (apart from the inner rim at 0.8 AU) is present in the disk, the irradiated disk surface is significantly larger than in the standard flared-disk geometry. More [O i] emission than in a standard flared disk would be observed. Although the dust disk may be mostly cleared at 10 AU, the gas disk is very likely still present around this radius (Bouwman et al. 2003; Grady et al. 2005). Therefore, the continuity of the [O i] intensity-versus-radius curve is not in disagreement with the possible presence of a dust-free gap in the disk. The local minimum in the intensity curve is located at the radius where the “standard” [O i] emission region ends and the “additional” wall emission begins.
The gap in the disk around HD 100546 is likely planet-induced. The mass of the planet can in principle be deduced from the size of the gap, the planet’s orbital radius and the stellar mass: according to Artymowicz (1987) the diameter of the gap cleared by a planet is equal to , where is the radius of the planet’s Roche lobe. An additional constraint on the planetary mass can be obtained from Lin & Papaloizou (1993). The authors state that a gap can only be created if the radius of the planet’s Hill sphere (Hill 1878) is larger than the vertical scale height of the disk. In their estimate of the planet’s mass, Bouwman et al. (2003) assume a relative scale height at 10 AU, based on the Dullemond et al. (2001) model for AB Aur. In our Chiang & Goldreich (1997) flared-disk model for HD 100546, is equal to at 10 AU (AVD05). Bouwman et al. (2003) double the value arguing that the vertical scale height of the wall at 10 AU must be twice as large as predicted by the flared-disk models in order to explain the mid-IR continuum fluxes. However, the suggested wall develops due to the direct radiation of the central star. The stellar photons can only reach the edge on the far side of the gap if a gap is already present. In our opinion it is therefore not necessary to assume a larger vertical scale height of the disk than in the original flared-disk model. The lower limit to the companion’s mass is then or depending on the chosen flared-disk model.
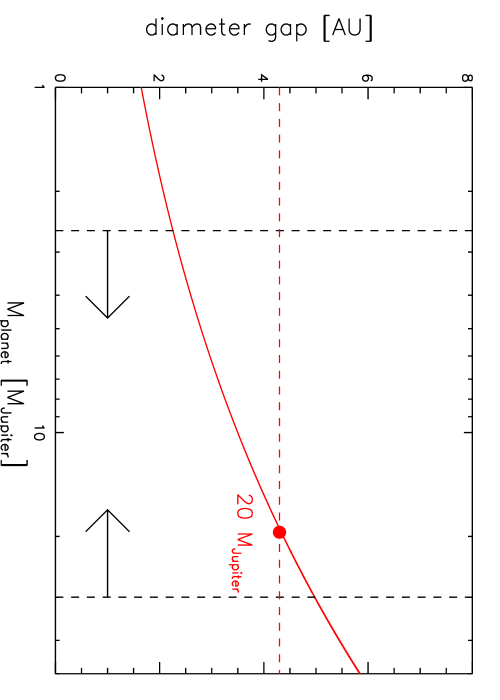
In Fig. 8 the expected diameter of the gap is shown as a function of the planet’s mass. The curve is based on the approximation for the Roche lobe radius described by Eggleton (1983). The radius of the planet’s orbit is assumed to be the location of the local minimum in the curve of HD 100546, about 10 AU. We have estimated the size of the gap by determining the FWHM around the local minimum. The gap diameter we derive is 6.5 AU. Comparing the theoretical and observed gap diameter, a mass of is deduced for the companion. An object with a mass exceeding lies beyond the deuterium-burning threshold (Oppenheimer et al. 2000) and thus the companion of HD 100546 is a brown dwarf. Note that the spatial extent of the [O i] emission region in HD 100546 estimated from the curve —based on the spectral information in the UVES data— differs by a factor 1.5 from the extent derived from the spatial information in the UVES data. If we apply this factor, the distance between planet and star becomes 6.5 AU and the gap diameter 4.3 AU. The estimated mass remains however, since also reduces by a factor of 1.5 in this case. An upper limit to the companion’s mass can be derived from the observational constraints set by Grady et al. (2005). They exclude the possibility of an earlier-than-M5 type stellar companion. According to Schmidt-Kaler (1982), an M4-type star has a mass of or equivalently . We have indicated this upper limit in Fig. 8. As a reference, the total disk mass derived from the 1.3mm flux of HD 100546 is also (Acke et al. 2004).
5.2 Implications of the presence of a companion
The rough estimates derived in the previous paragraph shed a new light on other measurements of HD 100546. A massive companion disrupts the original density distribution of the circumstellar disk, stirring up the surrounding matter. Spots of over- and underdensities are bound to form, their orbits synchronized with that of the companion. The [O i] emission region in the environment of the companion is therefore expected to deviate from axisymmetry. The temporal changes in the line profile of [O i] 6300Å line shown in Fig. 6 appear to display variability with a typical timescale of 11 yr. The suggested giant planet at 6.5 AU orbits the central star in close to 11 yr. The “clumps” in the [O i] emission region of HD 100546 mentioned in Sect. 4.1 may thus very well be in resonance with the orbiting planet. Grady et al. (2005) derived from the HST STIS long-slit spectra that the cavity is centered 5 AU southeast of the star. The spectra were obtained on September 22, 2001 and June 23, 2002, i.e. approximately 6 months before and 3 months after our ESO 3.6m CES spectrum of HD 100546. The latter spectrum shows a [O i] 6300Å profile with a dominant red wing. Combining this information with the newly obtained knowledge on the disk’s rotation, most of the [O i] emission emanated from the northwest part of the disk at that time. Assuming that the cavity is centered on the giant planet’s position hence leads to the conclusion that the gaseous clump which causes the temporal changes in the [O i] profile is located on the opposite side of the star as seen from the companion.
From the shape of the [O i] 6300Å line in the 2005 UVES spectrum of HD 100546, the clump must mainly be located in the blueshifted part of the disk. Nevertheless, the blue wing is not so dominant as the red wing in the 2002 ESO 3.6m spectrum. This may indicate that the clump has not reached its highest projected velocity or equivalently has not yet arrived on the disk’s major axis at PA=150∘ east of north. This image is reinforced by the shape of the spatial peak position through the feature at different slit PAs (see bottom panels Fig. 2). The spatial peak position throughout the profiles at PA=15∘ and 60∘ east of north appear to be oriented more to the northeast/east than expected, especially in the blue wing. The deviation of the spatial peak positions from the modeled peak positions at these PAs can be readily explained by the presence of a [O i] emitting clump between position angles 60∘ and 105∘ east of north. The reasoning outlined above predicts that the planet is at present (i.e. 2005) to the southwest/west of the star, between PA=240∘ and 285∘ east of north. The spectral shape of the [O i] 6300Å emission line thus provides a powerful tool to prognosticate the companion’s position on the sky.
The fact that the [O i] emitting clump in the disk of HD 100546 is at the time of the UVES observations (2005) to the northeast/east of the star, and that the spectral profile was red-wing dominated in the ESO 3.6m spectrum (2002) provides further knowledge on the rotation of the [O i] emission region and thus of the disk. In three years time, i.e. approximately one quarter of the estimated orbital period, the clump has moved from the redshifted region of the disk (i.e. the north/northwest) to the north/northeast of the star. This indicates that the emission region orbits the central star counterclockwise. Note that we have already reached a similar conclusion for the entire disk in Sect. 4.1. However, the argumentation in that Section was based on the assumption that the flaring of the disk’s geometry causes the deviation in the spatial peak positions of the UVES data. In the present Section we have suggested that the signature in spatial peak position can also be attributed to the presence of a clump in the [O i] emission. Even though both arguments may not be valid side by side, the resulting conclusion (i.e. the disk’s rotation occurs counterclockwise) is the same. We believe that the presence of an emitting clump provides the best explanation for the whole of phenomena which give the [O i] 6300Å line its (temporal, spectral and spatial) shape. The influence of the flaring of the disk is probably less important.
The outer parts ( 300 AU) of the disk around HD 100546 display spiral-arm structure (Grady et al. 2001). In an effort to explain this structure, Quillen et al. (2005) have modeled the effects of a massive gravitationally bound object circling HD 100546. They conclude that the mass of such an object needs to be of the order of or larger to explain the observed impact on the disk structure. They argue that the presence of such a massive companion at 300 AU is unlikely, because it would have been detected in the HST images. They conclude that a recent fly-by of a nearby star is preferentially the best explanation for the spiral arms, although they cannot find a good candidate in the field. It is striking however that our simple estimates for the companion’s mass and orbital radius agree with the boundary conditions set by Quillen et al. (2005): the mass of the companion is sufficiently high to cause the spiral pattern in the outer disk. Furthermore, the companion’s orbit is so close to the central star that the residuals of the stellar point spread function (PSF) would easily cover up its presence in all existing observations (e.g. Augereau et al. 2001).
The presence of the companion described in this Section leaves a signature in the radial velocities of the central star. The mass center of the star-planet system lies at a distance of 0.12 AU from the star. The amplitude of the stellar radial-velocity variations caused by the massive planet hence is assuming = 50∘. This amplitude is rather small, considering the observational difficulties. The optical spectrum of HD 100546 displays very few photospheric lines. Furthermore, these absorption lines are broadened due to the stellar rotation ( = 55 , Acke & Waelkens 2004). Therefore such a companion would easily go undetected in the existing spectroscopic data on HD 100546.
With the current instrumentation available, it seems impossible to directly observe the companion of HD 100546. The orbital radius of 6.5 AU corresponds to an angular separation of 65 mas at 103 pc. Space-based telescopes have diffraction limits which do reach this kind of high-angular resolution. Adaptive Optics (AO) instruments on ground-based 10 m telescopes are able to obtain this spatial resolution. The main problem however is the large brightness contrast between star and planet. Even in more favorable parts of the near-IR spectrum (e.g. in a methane band), this brightness ratio is out of reach for the present-day instruments. However, the companion should be readily detectable with high-contrast AO instruments on future ground-based Extremely Large Telescopes (ELTs).
6 Conclusions and discussion
In this paper we have provided further evidence that the [O i] 6300Å emission in the disks around HD 97048 and HD 100546 emanates from the disk surface, as was first suggested in AVD05. Thanks to the combination of high spectral resolution and spatial information on the [O i] emission region contained in the UVES spectra, we are able to determine the the blue- and redshifted part of the disk in the two targets. Although the emission region was not resolved in the sense that the FWHM in the feature is larger than the continuum FWHM, the observations clearly show a variation in spatial peak position in the feature. The dependence of that variation on the slit position angle agrees qualitatively with our [O i] 6300Å emitting flared-disk model. Based on the observed intensity-versus-radius curve of HD 97048 and HD 100546, we find that the [O i] emission region in our model is more extended than the emission region in the targets.
The major axis of the well-studied circumstellar dust disk around HD 100546 has a known position angle of 150∘ east of north. We have independently determined the same PA from our data. Note that two different diagnostics (the scattering dust particles and the oxygen gas responsible for the [O i] line) lead to the same angle. This indicates that the [O i] emission region is linked to the geometrical distribution of the dust, in agreement with the conclusions of AVD05. For HD 97048 we find a major axis PA of 160∘ east of north, which is the first determination of this angle in the literature.
Furthermore, we have obtained knowledge on the rotational direction of both disks. The disk of HD 97048 is oriented approximately north-south with the south part rotating towards us and the north part redshifted. The disk of HD 100546 is positioned following a NW–SE line, with the SE part blueshifted and the NW part moving away. For the latter object we have shown that the rotation occurs counterclockwise around the central star. The data for HD 97048 do not allow us to make a similar statement.
For HD 100546, we find evidence for the presence of a gap in the circumstellar disk at about 10 AU, as was first suggested by Bouwman et al. (2003) and later confirmed by Grady et al. (2005). The radial intensity distribution of the [O i] emission region indicates the presence of excess emission at AU in comparison to HD 97048. We suggest that this additional emission emanates from the region on the far side of the gap in the dust disk, where a wall has formed. The gap is likely induced by a massive planet. Based on simple assumptions, we derive a diameter for the gap of 4 AU and an orbital radius of 6.5 AU for the planet. The mass of this object is estimated to be . The companion’s orbital period (11 yr) is synchronized with the temporal changes observed in the [O i] line profile. We suggest that the deviations from axisymmetry in HD 100546’s [O i] emission region are also planet-induced. The [O i] line profile variations in HD 97048, which displays no evidence for the presence of a massive planet, are far less pronounced. The derived mass and orbital elements of the companion of HD 100546 are in agreement with the conclusions of Quillen et al. (2005). The object cannot be directly detected in HST images, and is massive enough to produce the large-scale spiral-arm structure observed in the outer disk of HD 100546. The estimates derived in the present paper can serve future efforts to detect the companion orbiting HD 100546 by direct imaging with ground-based Extremely Large Telescopes.
The [O i] 6300Å emission line in HD 100546 may prove to be a valuable tool to probe the companion’s orbital parameters. We will set up a long-term monitoring campaign on the Swiss Euler 1.2m telescope in La Silla (ESO) to study the variability of the line in more detail. The results of this study can provide further refinements in our knowledge of the giant planet’s orbital period and hence distance to the star. Monitoring the temporal changes of the [O i] line may also lead to a first estimate of the eccentricity of the planet’s orbit.
The observations of HD 100546 mentioned in the present paper all point to the presence of a massive object orbiting this target. Although the estimated mass of the companion suggests that it is a brown dwarf, it appears to have a formation history very alike that of a planet. First, the object is expected to be close to HD 100546, which is surrounded by a massive disk. Second, based on the mass estimate () the companion would appear in the “brown dwarf desert”: a lack of binary companions in the mass range between and late-M-type stars (e.g. McCarthy & Zuckerman 2004, and references therein). Armitage & Bonnell (2002) propose that brown-dwarf companions form contemporaneously with the primary. If the disk mass is sufficiently high compared to the brown dwarf mass, disk-companion interactions make the brown dwarf migrate inward. This occurs rather rapidly ( yr for a massive disk). Given that the observed mass of the disk around HD 100546 is at present still (e.g. Acke et al. 2004), the initial disk mass should have been high enough to ensure rapid inward migration of the companion. Furthermore, there does not seem to be an underabundance of single stars throughout the brown dwarf mass range. Single stars form due to self-gravitational contraction. Given the discrepancy between the presence of single and long-lived companion brown dwarfs, is unlikely that brown dwarfs in disk-dominated environments are formed following the same mechanism of self-gravitation.
On the other hand, a object in a massive disk may have a similar formation history as a giant planet. Due to gravitational instabilities in the disk, the object can gain mass and grow (e.g. Boss 2005). If this mechanism is indeed at work in massive protoplanetary disks, it appears logical that it favors low-mass, planet-like objects over somewhat higher-mass brown dwarfs. Together with the fast removal of initially formed brown dwarf companions, this would explain the brown dwarf desert which is observed in multiple systems. The HD 100546 system is at least 10 million years old (van den Ancker et al. 1998). The presence of a massive object is therefore more logical under the assumption of a formation which occured in the disk (long) after the formation of the central star. We conclude that the object orbiting HD 100546 is a rare specimen of a brown dwarf companion with a formation history which is similar to that of a regular planet.
The disk of HD 100546 is peculiar and extraordinary in many ways. The longevity of the disk is striking in comparison with other pre-main-sequence stars. Most disks dissipate within a few yr, while the disk around HD 100546 is still clearly present. Also the presence of relatively strong accretion is exceptional in such an old system (Balmer line emission and accretion events detected in the UV, e.g. Deleuil et al. 2004; Grady et al. 2005). The presence of a planet in the inner parts of the disk would cause a flow of gas which is “funneled” towards the central star. Furthermore, the solid-state features observed in the near-to-mid-IR suggest a highly processed dust component, quite similar to the spectra of comets in our solar system (see e.g. the Infrared Space Observatory data described by Malfait et al. 1998). The degree of crystallinity of the dust disk makes HD 100546 an outlier in the group of Herbig Ae/Be stars (Acke & van den Ancker 2004). The grain size distribution deduced from the (sub-)mm slope of the spectral energy distribution indicates the majority of the emitting dust grains have small sizes (1 mm), while the dust particles in a lot of younger systems underwent substantial grain growth (1 mm, Acke et al. 2004). Now that it becomes more and more clear that a companion is present, it is likely that the characteristics which make HD 100546 special all find their roots in the interactions between the disk and this companion. Such interactions clearly maintain the disk. Based on the presence of small and highly crystalline dust particles, we suggest however that the observed disk is not pristine, but rather more evolved. The interactions of the companion and the larger grains and planetesimals in the disk —which are expected to have formed in an earlier stage— could tear apart the latter. The small grains which emanate from such destructive interferences then replenish the small grain population in the disk. The occurance of events like these can provide a satisfying solution to the unusual longevity of the disk in some young stellar systems.
A final pecularity which is worth mentioning in this context concerns the unusual photospheric abundances of HD 100546. HD 100546 appears to be a so-called Boo star: the photosphere displays a deficit in metals (Mg, Si, Fe and Cr), while nitrogen and oxygen have approximately solar abundances (Acke & Waelkens 2004). HD 100546 is the only Herbig star in the sample of Acke & Waelkens which clearly displays this behaviour. Selective accretion of metal-depleted gas is commonly inferred to explain this selective depletion pattern. The metals condense into dust particles at much higher temperatures than the CNO elements. The radiation pressure on dust grains prevents the latter to fall in, while the gas-state elements are accreted. The gas and dust should however be decoupled in order to prevent the dust to be dragged along onto the star. The presence of a giant planet in the inner parts of the disk around HD 100546 could create the specific conditions needed to produce the selective accretion and consequent photospheric depletion pattern. If most metals are locked inside dust particles (or even planetesimals), the gas that is “funneled” by the planet from the disk onto the central star is metal poor. Intriguingly, a deficit of metals in the stellar photosphere is opposite to what is typical of most giant planet systems found to date, in which the stars are primarily metal rich.
Many observational characteristics of HD 100546 can be explained by the presence of a giant, nearby planet. If the argumentation in the present paper is confirmed by future observations, the companion of HD 100546 is the youngest exo-planet discovered until today. The constraints deduced from a study of such a young planet+disk system will prove to be extremely valuable in both the modeling of disk-planet interactions, as well as in improving our comprehension of disk evolution and planet formation.
Acknowledgements.
The authors want to thank the ESO User Support Department, in particular F. Primas and B. Wolff, for their accurate and quick response to our questions concerning the UVES data. We also thank J. Bouwman, C. Dullemond, C. Waelkens and L. Waters for useful discussions. The referee, dr. S. Edwards, is acknowledged for her constructive comments which helped to improve the clarity of the paper.References
- Acke & van den Ancker (2004) Acke, B. & van den Ancker, M. E. 2004, A&A, 426, 151
- Acke et al. (2005) Acke, B., van den Ancker, M. E., & Dullemond, C. P. 2005, A&A, 436, 209
- Acke et al. (2004) Acke, B., van den Ancker, M. E., Dullemond, C. P., van Boekel, R., & Waters, L. B. F. M. 2004, A&A, 422, 621
- Acke & Waelkens (2004) Acke, B. & Waelkens, C. 2004, A&A, 427, 1009
- Armitage & Bonnell (2002) Armitage, P. J. & Bonnell, I. A. 2002, MNRAS, 330, L11
- Artymowicz (1987) Artymowicz, P. 1987, Icarus, 70, 303
- Augereau et al. (2001) Augereau, J. C., Lagrange, A. M., Mouillet, D., & Ménard, F. 2001, A&A, 365, 78
- Boss (2005) Boss, A. P. 2005, ApJ, 629, 535
- Bouwman et al. (2003) Bouwman, J., de Koter, A., Dominik, C., & Waters, L. B. F. M. 2003, A&A, 401, 577
- Chiang & Goldreich (1997) Chiang, E. I. & Goldreich, P. 1997, ApJ, 490, 368
- Deleuil et al. (2004) Deleuil, M., Lecavelier des Etangs, A., Bouret, J.-C., et al. 2004, A&A, 418, 577
- Dominik et al. (2003) Dominik, C., Dullemond, C. P., Waters, L. B. F. M., & Walch, S. 2003, A&A, 398, 607
- Dullemond et al. (2001) Dullemond, C. P., Dominik, C., & Natta, A. 2001, ApJ, 560, 957
- Eggleton (1983) Eggleton, P. P. 1983, ApJ, 268, 368
- Grady et al. (2001) Grady, C. A., Polomski, E. F., Henning, T., et al. 2001, AJ, 122, 3396
- Grady et al. (2005) Grady, C. A., Woodgate, B., Heap, S. R., et al. 2005, ApJ, 620, 470
- Hill (1878) Hill, G. 1878, American J. Math., 1, 5
- Leinert et al. (2004) Leinert, C., van Boekel, R., Waters, L. B. F. M., et al. 2004, A&A, 423, 537
- Lin & Papaloizou (1993) Lin, D. N. C. & Papaloizou, J. C. B. 1993, in Protostars and Planets III, 749–835
- Liu et al. (2003) Liu, W. M., Hinz, P. M., Meyer, M. R., et al. 2003, ApJ, 598, L111
- Malfait et al. (1998) Malfait, K., Waelkens, C., Waters, L. B. F. M., et al. 1998, A&A, 332, L25
- McCarthy & Zuckerman (2004) McCarthy, C. & Zuckerman, B. 2004, AJ, 127, 2871
- Oppenheimer et al. (2000) Oppenheimer, B. R., Kulkarni, S. R., & Stauffer, J. R. 2000, Protostars and Planets IV, 1313
- Pantin et al. (2000) Pantin, E., Waelkens, C., & Lagage, P. O. 2000, A&A, 361, L9
- Quillen et al. (2005) Quillen, A. C., Varnière, P., Minchev, I., & Frank, A. 2005, AJ, 129, 2481
- Schmidt-Kaler (1982) Schmidt-Kaler, T. 1982, ”Landölt-Bornstein Catalogue”, VI/2b, Springer Verlag, Heidelberg
- Takami et al. (2004) Takami, M., Bailey, J., Chrysostomou, A., Tamura, M., & Terada, H. 2004, in IAU Symposium, 417
- van Boekel et al. (2004) van Boekel, R., Waters, L. B. F. M., Dominik, C., et al. 2004, A&A, 418, 177
- van den Ancker et al. (1998) van den Ancker, M. E., de Winter, D., & Tjin A Djie, H. R. E. 1998, A&A, 330, 145
- Wilner et al. (2003) Wilner, D. J., Bourke, T. L., Wright, C. M., et al. 2003, ApJ, 596, 597