22email: anne.poncelet@obspm.fr
A new analysis of the nucleus of NGC 1068
with MIDI observations
We present a new analysis of the very first mid-infrared N-band long-baseline interferometric observations of an extragalactic source: the nucleus of the Seyfert 2 galaxy NGC 1068, obtained with MIDI (Mid-InfrareD Interferometer), the mid-infrared beamcombiner at the European Southern Observatory (ESO) Very Large Telescope Interferometer (VLTI). The resolution of /B = 10 mas allows to study the compact central core of the galaxy between 8 and 13 m. Both visibility measurements and MIDI spectrum are well reproduced with a simple radiative transfer model with two concentric spherical components. The derived angular sizes and temperatures are about 35 and 83 mas, and 361 K and 226 K for these two components respectively. Some other evidences strongly support such low temperatures. This modeling also provides the variation of optical depth as a function of wavelength for the extended component across the N-band pointing towards the presence of amorphous silicate grains. This shows that MIDI actually carried out the first direct observations of the distribution of dust around the central engine. Together with other observational pieces, we are able to move a step forward in the reconstruction of the picture drawn for AGNs.
Key Words.:
galaxies: NGC 1068 – galaxies: Seyfert – galaxies: nuclei – radiative transfer – infrared: galaxies –techniques: interferometic
1 Introduction
NGC 1068 is one of the brightest and nearest Seyfert 2 galaxies. Located at a distance of 14.4 Mpc, it is unique for the study of the active galactic nucleus (AGN) it harbours. The nucleus of NGC 1068 has been well studied in the entire spectrum, from X-rays and UV to radio wavelengths, including the optical, near- and mid-infrared wavelength ranges. The location of all the components emitting at different wavelengths has been revisited in Galliano et al. (Galliano (2003)). NGC 1068 was classified as a Seyfert 2 with respect to the narrow emission lines it emits. However, Antonucci & Miller (Antonucci (1985)) have discovered broad, polarized emission lines, which suggest the presence of a Seyfert 1 nucleus, hidden by a geometrically and optically thick dusty torus surrounding it. Thus, they laid the foundation stone of the unified scheme of AGN. Several theoretical studies of AGN tori were reported by Pier & Krolik (PierKrolik1 (1992, 1993)), Granato & Danese (Granato (1993)), Efstathiou et al. (Efstathiou (1995)). All these models consider radiative transfer in an anisotropic, but homogenous dusty torus. Nenkova et al. (Nenkova (2002)) considered radiative transfer between several clouds of dust along radial rays through the torus, and overcame some difficulties of the former homogeneous models for the description of the spectral energy distributions. More recently, Schartmann et al. (Schartmann (2005)) describe the three dimensional treatment of transfer radiative through dusty tori at hydrostatic equilibrium and succeed in reproducing both the mean large aperture spectra from UV to far-IR of several Seyfert type 1 galaxies, and the recent MIDI observations of two specified Seyfert type 2: Circinus and NGC 1068, except for the 9.7 m silicate feature. Geometrical and dynamical properties of dusty tori are theoretically investigated, among others, by Krolik & Begelman (K&B (1988)), Zier & Biermann (Zier (2002)), and Beckert & Duschl (Beckert (2004)).
An alternative explanation for the unified scheme of AGNs is given by Elvis (Elvis (2000)), who actually proposes a simple and empirical scenario of funnel-shaped thin shell, warm and highly ionised outflow that could account for all the structures in the inner regions of AGNs with various luminosities. However, this model is not in contradiction with the obscuring torus paradigm since the accelerating bi-conical wind could be itself considered as a form of dusty torus.
In the near-IR, the first , and -band Adaptive Optics (AO) images of NGC 1068, at 0.12” resolution (1” corresponds to 72 pc), were reported by Rouan et al. (Rouan1998 (1998)). They gave an upper limit on the size of the unresolved K-band core of 9 pc, and highlighted an elongated -shaped structure radially extending up to 20 pc, at a position angle (PA) 102. Spectroscopic high angular resolution -band observations obtained with PUEO-GriF at CFHT are presented by Gratadour et al. (Gratadour2003 (2003)). Emission of hot dust seems to be confined in an almost resolved region of 120 mas. Based on , , and -band diffraction-limited images of NGC 1068 obtained with NACO at the VLT, Rouan et al. (Rouan2004 (2004)) reported several emissions around the nucleus being structured in several regions. The and -band emissions are actually resolved with a FWHM of 67 and 122 mas respectively, and are elongated in the NS direction.
First 76 mas resolution -band images of NGC 1068 obtained from bispectrum speckle interferometry were interpreted in terms of a resolved gaussian component of FWHM 30 mas (Wittkowski et al. Wittkowski1998 (1998)). Speckle imaging performed by Weinberger et al. (Weinberger (1999)) at the Keck Observatory led to agreeing results.
Then, the first -band long baseline interferometric measurement of NGC 1068 was obtained with VINCI at the VLTI (Wittkowski et al. Wittkowski2004 (2004)). Coupled with -band speckle interferometry measurements (Weigelt et al. Weigelt (2004)), they account for the observations with a two-component model where the small component has an angular size of less than 5 mas and the other one has a size of 40 mas. Weigelt et al. (Weigelt (2004)) present near-IR bispectrum speckle interferometry made with the SAO 6m telescope. The -band FWHM diameter of the observed compact core is 1839 mas, and the PA of the north-western elongation is -16. In the -band, the FWHM diameter of this same component is 1845 mas, and the PA is -18.
First mid-IR images with 0.1” spatial resolution are reported by Bock et al. (Bock (2000)), using the 10 m Keck II telescope. They interpret the northern elongation of the central peak as reprocessed radiation from the AGN. Tomono et al. (Tomono (2001)) also obtained mid-IR images with 0.1” spatial resolution with MIRTOS on the 8.2 m Subaru Telescope and confirm that the central region of NGC 1068 is elongated in the NS direction, with a FWHM of 0.29” 0.18”. They use a modified grey-body radiation, with absorbing silicate features in order to model the spectral energy distribution (SED) of the central peak.
Jaffe et al. (Jaffe (2004)) report the first mid-IR -band long-baseline interferometric measurements using MIDI, the VLTI mid-IR beamcombiner. They consider a model composed of two ellipsoidal gaussian disks. They derive sizes of about 10 2 mas in the NS direction, parallel to the inner radio jet, and 12 mas in the direction transverse to the jet for an inner hot component (T 800K) and sizes of about 30 5 mas 49 4 mas for an outer warm component (T 350 K).
Infrared interferometry clearly has the potential to study the circum-nuclear environment of AGNs to bring evidences for or against the unified sheme to help better understand their nature. In this paper, we report an alternative analysis of the first -band MIDI observations of the nucleus of NGC 1068. First, in Sect. 2, we give a short review of the observations and data processing. Sect. 3 details the models considered in this paper. Then, the results are presented in Sect. 4, and further discussed in Sect. 5. Sect. 6 gives the general conclusions of the study.
2 Observations and data reduction
The observations were performed in 2003 (June 15th, 16th; November 9th, 10th), during four nights of Science Demonstration Time with MIDI, the mid-IR -band (8-13 m) instrument. Observations were carried out with two 8.2 m diameter Unit Telescope (UT) at the European Southern Observatory (ESO) VLTI on Cerro Paranal. A 0.6” 2” slit was used with a low resolution prism, set in the direction perpendicular to the slit, providing a spectral resolution of / 30.
MIDI has two interferometric outputs which are the sum of the flux of NGC 1068 and the fringe modulation, plus the background. The NGC 1068 flux and the modulation were measured separately as the photometric outputs were not operational at the time of the observation. The two interferograms are complementary with opposite phases. Using this property, the two outputs are subtracted to disentangle the modulation from the continuous signals. The amount of continuous flux from NGC 1068 was accurately obtained thanks to the “chopping” technique: both UTs alternatively point to the sky and to the source. Subtraction of the sky sequences from the source sequences yields the source flux. The chopping frequency was 2 Hz during the two nights. Since no spatial filter was used at that time, the flux from NGC 1068 can be considered constant. The modulated part of interferograms is then normalized by the continuous flux. The contrast of individual fringe scans is obtained with a classical method which has been used with precursors of VLTI (Coudé Du Foresto et al. Coude (1997)). Normalized scan sequences are Fourier transformed. The power spectrum is band pass filtered in each MIDI spectral channel. The squared fringe contrast is the integration of the filtered power spectrum from which the photon and read-out noise bias have been subtracted. Statistical errors on squared fringe contrast estimators are set from the dispersion of measurements.
2.1 Visibilities calibration
The entire data reduction has been done with the software developed at LESIA at Paris Observatory for MIDI111This software is now available through the JMMC website: http://mariotti.ujf-grenoble.fr/. It also relies on methods developped for precursors of the VLTI (Perrin Perrin2003 (2003)). This software has been used to reduce data on stars for which visibility functions can be more easily anticipated (Kervella et al. Kervella (2005), accepted).
As the pupils of the UTs are larger than the spatial coherence diameter of the wavefront, and as there was no spatial filtering at the time of the observations, beams are strongly sensitive to turbulence and alignment defects, causing coherence losses. Therefore, visibilities need to be carefully calibrated. To do so, a calibration star is observed before and after the observation of the source. In the case of NGC 1068, the calibrator used was HD 10380 (or Psc), a K3IIIb star whose angular diameter, derived from a photometric scale, is 2.99 0.15 mas (Perrin et al. 1998).
The interferometric response of the instrument, the so-called transfer function, was calculated from the calibrator observations. The transfer function is the ratio of the observed fringe contrast by the expected visibility of the calibrator deduced from the estimated diameter. Plots of the transfer function as a function of wavelength are also informative about the quality of the data with respect to turbulent conditions and background subtraction. Since sensitivity to turbulence decreases with wavelength, the transfer function increases with wavelength. Excessive turbulence or misalignments cause a large gradient between 8 and 13 m. Such data are rejected.
The observations of the source are generally bracketed by observations of the calibrator star. The source fringe contrasts are obtained by normalizing the fringe contrast by the transfer function interpolated at the time the source was observed. A selection is then applied on the histograms of the squared fringe contrasts of NGC 1068 and of the calibration star. Sequences of fringe contrasts should have a rough gaussian distribution under steady turbulence conditions. Sequences of data for which histograms were departing too clearly from gaussian shape were rejected.
Actually, two calibration stars were observed, Eri and HD 10380. A detailed look at the data led us not to use transfer functions derived from Eri since they strongly increase up to 11 m and then saturate. As it was the only calibrator star used during the night of November 10th (except for a single series), and as data obtained on Betelgeuse were also rejected for this same night (see Perrin et al. Perrin2005 (2006)), we did not use the data of November 10th for our present study of NGC 1068. In the same way, we were led to reject the data of June 15th since they most probably have been affected by large turbulence effects. A detailed look at the squared fringe contrast histograms also led us to reject some data from the two remaining nights. Table 1 and Table 2 summarize the observations eventually kept for the present study. The combination of adaptive optics and spatial filtering will eventually solve this issues and improve the quality of the data.
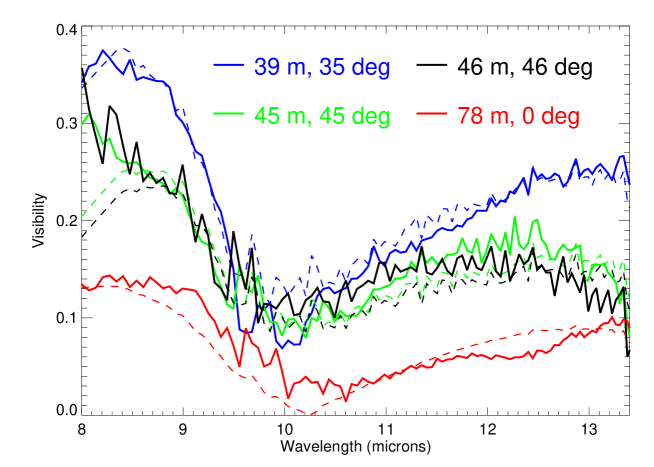
Visibility measurements of NGC 1068 have been averaged by bins of projected baselines. A consistency check has been performed in each bin to assess the quality of error bars. Ad-hoc error bars have been computed to be consistent with the dispersion of visibilities when error bars were initially too small. The four bins are the visibility points used in the following and are presented in Fig.1. The final absolute accuracy on visibility estimates is on the order of 3 percent. Our processing of the data leads to a more extended data set than that of Jaffe et al. (Jaffe (2004)) who kept two visibility points at baselines of 42 and 72 m.
Two main features are striking on Fig.1. First, the visibilities are far smaller than 1, which means that NGC 1068 is well resolved by MIDI. Second, visibilities are obviously wavelength dependent, a property which has to be taken into account in the modeling of the source.
2.2 Spectral Energy Distribution calibration
The Spectral Energy Distribution (SED) as seen by MIDI is of prime importance to model the spectral and spatial properties of the source. The SED of NGC 1068 is derived from the chopping sequences of the source and of the calibrator. However, no observed SED is available for HD 10380 in the literature. Therefore, we made use of the calibrated one computed by Cohen et al. (Cohen (1999)). The integrated flux has been normalized to that of HD 10380. The two SEDs are consistent to within 7%. We eventually used the mean of these two spectra as a SED for HD 10380. The difference between the two SEDs was kept as the error on the final SED of HD 10380. A spectrophotometric response of MIDI was calibrated on HD 10380 using this SED.
Two spectra of NGC 1068 were independently derived from photometries measured on June 16th and November 9th, 2003. Error bars on photometry measurements are set from the difference between the spectra measured with the two UTs. The final MIDI SED of NGC 1068 is derived from the mean of the spectra of June and November and from the spectrophotometric response. The difference between the calibrated SEDs is used as an error estimate.
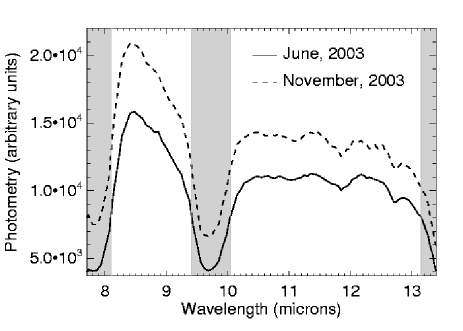
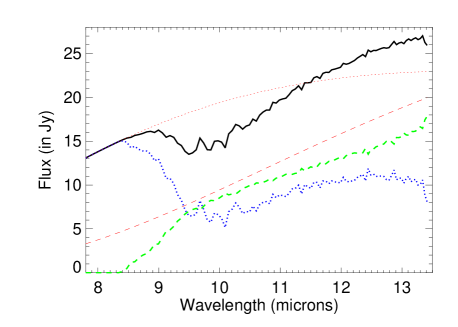
As shown in Fig. 2, the photometric measurements of NGC 1068 and HD 10380 are strongly wavelength-dependent. The characteristic loss of signal around 9.5 m is due to absorption by atmospheric ozone. To avoid too large noise sensitivity, we do not take into account regions where photometry measurements are smaller than half the maximum value. These regions are greyed on our final spectrum of NGC 1068. The SEDs of June, November and the average one are presented on Fig. 3.
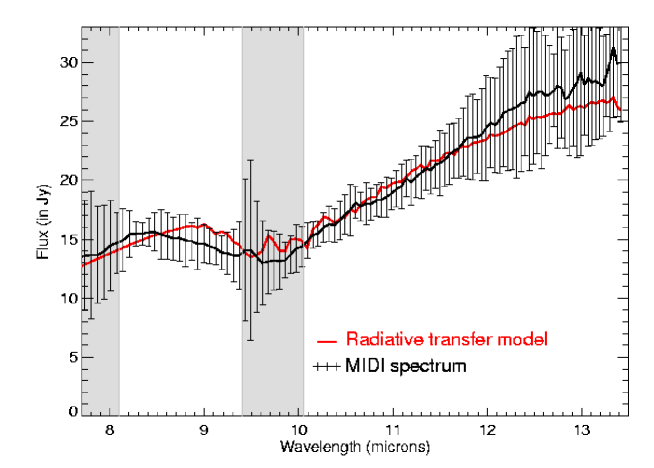
The SED of NGC 1068 we derived from the MIDI data is different from the one presented by Jaffe et al. (Jaffe (2004)): quantitatively, the former is in the range 13 to 30 Jy whereas the latter is rather between 8 and 15 Jy. Moreover the slope of the SED we derived after 11 m is steeper than the one of Jaffe et al. Besides, we have validated our calibration procedure on an independent data set acquired on Betelgeuse. We have checked that we could reproduce the spectrum of Verhoelst et al. (2005) to an excellent accuracy. Besides, we have compared our spectrum to the one available from the ISO database (see Fig. 4). The field of view of ISO is much larger than that of MIDI and ISO is detecting the dust shell whose inner edge starts at 0.5” (Danchi et al. 1994). The emission feature of silicate dust at 9.7 m is therefore present in the ISO spectrum but not in the MIDI spectrum whose field of view is reduced to less than 0.3”. Apart from dust, the continua should however agree. We find a maximum difference of 16% between our calibrated SED and the ISO spectrum outside the silicate dust feature which makes us confident in our calibration.

3 The different steps of data modeling
As only a few MIDI data points on NGC 1068 are available so far, models were computed from a rigorous stepwise approach on the data rather than from a priori knowledges about the source. Models remain also simple to avoid over-interpretations and to keep a reasonnable number of degrees of freedom.
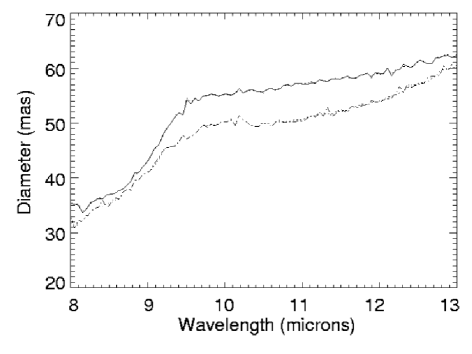
The characteristic apparent size of the object was first gauged by fitting visibilities with a uniform disk model whose diameter is wavelength dependent. The 39 m baseline data on the one hand and the 45-46 m baseline data on the other hand were fitted independently since these two sets of projected baselines are separated by 10 in azimuth. The 78 m data were not used at this stage since they would lay in the second lobe of the uniform disk visibility function, which model has a poor chance to be the right one at high spatial frequency. Therefore, these data would bias the measurement of the characteristic size of the source, which is the main goal of this first procedure.
Fig. 5 clearly shows the wavelength dependency of the apparent size of the object. One may notice that the curves related to the two different baselines do not overlap with a difference ranging from 2 to 7 mas. First, this may be due to the model which is clearly too simple. This discrepancy could then be interpreted as an asymmetry of the nucleus of NGC 1068, which one is well known at larger angular scales. Thus, to possibly highlight some elongation and orientation of the source, an attempt was made to fit all the visibility points at the same time with a uniform elliptical disk. This led to a degeneracy of parameters which means that extracting informations on the shape and orientation of the source is not possible with the present MIDI data set. As a consequence, geometries used in the following modelings were restricted to spherical symmetry. The two typical sizes of 30 mas and 55-60 mas at 8 m and after 9.5 m respectively shown up in Fig. 5 suggest to elaborate a further model by the addition of a second uniform disk. This model counts now three free parameters per wavelength, being the diameters of each disk and the flux ratio between them. Fits of visibilities are improved, which strengthens the validity of the two-disk model. Diameter variations with wavelength are plotted on Fig. 6.

From these previous results, the third step in the modeling is to consider the radiative transfer between the two spherical components, namely a compact inner core (corresponding to the inner disk of diameter ) which radiates as a black body with temperature and a layer (described by the outer disk of diameter ) around the compact core which radiates as a thermal grey-body at . The absorption in the layer and its emission are accounted for by its optical depth . No scattering is considered here. For the sake of simplicity, we used a model in which the layer is geometrically thin. This model was successfully applied to Mira stars and red supergiants in the near-infrared (see e.g. Perrin et al. Perrin2004 (2004)). The interest of this model is that the radiative transfer can be calculated analytically and that there is no major difference with a model for which the base of the layer would be at the edge of the compact inner core.
Thus, if sin (where is the angle between the line of sight and the radius vector of the two spheres), both contributions of the compact core and of the layer are observed. Then the emerging intensity can be expressed as:
In the other case,
where B(,) is the Planck function.
Thus, as the model was chosen to remain rather simple, the number of free parameters was limited to five at each wavelength. Diameters and temperatures are global parameters, while the optical depth, chosen to be wavelength dependent, allows to account for the visibility variations and for the SED. The total number of visibility data is while the number of free parameters is then ( being the number of spectral channels). The diameters are well constrained by the visibilities while the latter only provide a one-to-one relation between the temperatures. Compatibility with the SED allows to determine a unique couple of temperatures.
The criterion to be minimized is the , written as:
where is the modeled squared visibility function, which also depends on the spatial frequency given by: ( being the projected baseline).
There are several local minima on the hyper-surface in parameter space. Therefore the search for optimal parameter values has to be carried out in several steps. To reach the solution diameters, the first step consists in the exploration of a 2-D grid in (;) space. For each point on this grid, the minimization is performed on the temperatures and on a global optical depth (in other words, a mean optical depth non-dependent on wavelength at this point of the minimization). For the second step, the same procedure is applied but on a 2-D grid in (;) space. The third and last step consists in running the minimization on optical depth with respect to wavelength, setting diameters and temperatures at the optimum values found previously. Ideally, steps should have been iterated but this did not turn out to be necessary.
4 Results on the NGC 1068 mid-IR core
Visibility measurements actually well constrain the geometrical parameters since the first step of the minimization rapidly converges to the optimum values of geometrical parameters, which are:
= 35.3 3.7 mas
= 83.1 6.1 mas
However, several local minima appear in the -hypersurface in temperature space, leading to a degeneracy of these parameters. Indeed, visibilities are not sensitive to the absolute flux of each component, but to the relative flux between them.
The degeneracy on temperatures is overcome using the MIDI SED of NGC 1068. The criterion estimating the goodness of a fit of the SED, with a given couple of temperatures, is given by:
The optimal couple of temperatures then obtained is:
= 361 12 K
= 226 8 K
= 33.9
= 16.4
and can be minimized independently as long as minimization of the second one is performed over the local minima of the first one.
To estimate the confidence interval on parameters, we treat the two couples of global parameters (i.e. diameters and temperatures) independently (e.g. Bevington & Robinson Bevington (1992)). For geometrical parameters, we look at the joint confidence interval given by a variation of 1 with respect to , as a function of and , keeping the other parameters fixed at their optimum values. This is equivalent to increase the error bars on visibilities by and to reaccount for the distance to the model.
For temperatures, the confidence interval corresponds to the intersection between the trough in (;) space and the joint confidence interval on temperatures which give a reasonable fit of the SED. In order to obtain this last joint interval, we look at a variation of 1 on the value of as a function of and . Values of relating to the fits of the visibilities and of the spectrum are quite high, leading to an under-estimation of the confidence interval on parameters. Nevertheless, this must be due on the one hand to the simplicity of the model considered and on the other hand to the fits of the 45 and 46 m visbility points between 8 and 8.5 m which are poor compared to eslewhere in the -band (see Fig. 1). Also note on Fig. 1 that the modeled visibility curves have the same kind of wavelength dependent fluctuations as the measurements. This is due to the third step of the minimisation which improves the fit by converging to the optimal value of the optical depth at each wavelength.
Fig. 7 presents several fits of visibility measurements as a function of the projected baseline at different fixed wavelengths. The growing influence of the extended layer with increasing wavelength is highlighted on the one hand by the flatness of the visibility function at high spatial frequencies and on the other hand by the strong slope at low spatial frequencies. Moreover, the figures underline the embarrassing lack of visibility points at low projected baselines. As the slope at low spatial frequencies is really model-dependent, these points are needed to put stronger constrains on the modeling.


The fit of the MIDI spectrum is presented on Fig. 3. This shows that not only the simple radiative transfer model accounts for MIDI visibility measurements, but also it gives a good representation of the SED across the full -band. Fig. 8 presents the contribution of each component to the spectrum. We observe that the inner compact component is the only one to contribute to the SED until 8.5 m while the flux emitted by the layer begins to dominate above 9.4 m. This figure also shows that, in the framework of our model, the gap of the SED around 10 m is not due to the crossing of the two black body emissions, but indeed to a peak in the absorption by the layer.
Therefore, the originality of the present study resides in its capability to provide the evolution of the optical depth of the extended component as a function of wavelength in the -band, without any a priori assumption on it like its variation law or the composition of the extended layer. The optical depth resulting from the whole analysis is plotted as a function of wavelength in Fig. 9 (dark solid line) and will be discussed further in sect. 5.3.
5 Discussion
5.1 Spatial description of the source
As the number of visilitity measurements is extremely small and as the (u,v) plane is not sufficiently covered, models able to fit the MIDI data points are degenerated. This lack of sensitivity in the models highlights the importance of following a stepwise approach from the data.
The MIDI visibility points can be fitted by a different and a priori model that consists in a two gaussian elliptical disk model (Jaffe et al. Jaffe (2004)). The derived sizes are mas for an inner hot, optically thick component and mas for a warm component. The factor of 2 between these values and the ones we derived with our model is actually explained by the differences between the respective geometries considered.
Comparing mid- and near-IR observations, it appears that the largest -band structure corresponds in size to the smallest structure detected in the mid-IR with MIDI. From -band bispectrum speckle interferometry, Wittkowski et al. (Wittkowski1998 (1998)) interpreted the observed central core of NGC 1068 as a slightly resolved gaussian disk of FWHM 30 mas. Speckle imaging from the Keck Observatory also showed that the flux emitted by the core of the AGN may be accounted for by an unresolved point source whose size is smaller than 20 mas and which is surrounded by an emitting region extending up to 10 pc (Weinberger et al. Weinberger (1999)). Wittkowski et al. (Wittkowski2004 (2004)) combined near-IR speckle data with the -band visibility point obtained with VINCI and interpreted the whole dataset with a two-component model: a small one having a size of 5 mas (or 0.4 pc) responsible for 40% of the -band flux and an extended one of 40 mas. In addition, near-IR bispectrum speckle interferometric observations led to a N-W extended structure in -band having a size of mas and a P.A. -16 (Weigelt et al. Weigelt (2004)). With regard to the AO observations performed with NACO at VLT, the -band core is slightly N-S elongated with a FWHM of 67 mas (Rouan et al., Rouan2004 (2004)). The spatial description of the source derived from speckle observations is also fully consistent with the best resolution AO observations performed with NAOS-CONICA which show a resolved structure in the -band, elongated along the same P.A. -16 and of FWHM mas after deconvolution ( mas before deconvolution; Gratadour et al. Gratadour2005 (2005)). The sizes derived from -band and -band observations underline the consistency between the near-IR and the mid-IR observations of the nucleus of NGC 1068.
According to Maloney (Maloney (2002)), the dusty torus has suitable temperatures (T 250 K) and H2 molecules densities ( cm-3), in order to produce the rotational transition at 22 GHz of the H2O masers (e.g., Elitzur Elitzur (1992), chap. 10). H2O masers can be produced by the absorption by a H2O molecule of an X-ray emitted by the central engine of the AGN, and the 22 GHz radio emission is expected to trace the inner edge of the torus. Sub-milliarcsecond angular resolution observations made on NGC 1068 with the Very Long Baseline Interferometer (VLBI) showed that the redshifted emission is divided in four groups, linearly distributed between 6 and 14 mas from the core along a direction at 45 from the radio synchrotron jet axis (Greenhill et al. Greenhill (1996)). Additional observations of the blueshifted emission showed that masers are actually spatially distributed on a thin ring inclined at -45, on scales extending from 0.65 to 1 pc (i.e., 9.3 and 15.7 mas; Greenhill & Gwinn G&G (1997)). Thus, the ring traced by the H2O masers seems to correspond to the inner edge of the dusty torus (Kartje et al. Kartje (1999)). This is actually what we are observing since the masers are located at the same place as the -band structure derived from the VINCI/Speckle observations and also observed with NAOS-CONICA, and just inside the extended component derived from our modeling of the MIDI data.
Moreover, as claimed by Rouan et al. (Rouan2004 (2004)) and Gratadour et al. (Gratadour2005 (2005)), and according to current estimates of the dust sublimation radius, graphite grains are able to survive at such small distances from the core of the nucleus of NGC 1068, so that this dust species could be part of the observed -band structure. Indeed, a theoretical estimate of the dust sublimation radius is given by:
| (1) |
where is the UV luminosity (in units of 1046 erg.s-1) and is the sublimation temperature of the dust species considered (in units of 1500 K; Barvainis Barvainis (1987)). Upper limits are then obtained by setting the UV luminosity of the central source to the observed bolometric luminosity of the nucleus and by considering sublimation temperatures of 1400 K and 1750 K for silicates and graphite grains respectively. Pier et al. (Pier1994 (1994)) investigated the bolometric luminosity of the nucleus of NGC 1068. Depending on the fraction of nuclear flux reflected into our line of sight which has been determined by several different ways, the bolometric luminosity of the nucleus of NGC 1068 ranges from erg.s-1 to erg.s-1, the most probable value being on the order of erg.s-1 (Pier et al. Pier1994 (1994)). These dispersed values lead to a sublimation radius ranging from 0.07 to 0.50 pc (i.e. 1 to 7 mas) for graphite grains and from 0.13 to 0.91 pc (i.e. 1.8 to 12.6 mas) for silicate grains, the most probable values being 0.16 pc and 0.3 pc (or 2.2 mas and 4.2 mas) respectively.
As a conclusion, in spite of the great uncertainties on the estimation of sublimation radii, it is remarkable that H2O masers seem to be confined in an area located between the sublimation radius of silicate grains and the outer edge of the inner component we have inferred from mid-IR data. In addition, according to near-IR observations of the nucleus of NGC 1068, it seems that the dust surrounding the central engine is divided in several layers of which the first one – emitting in -band and probably extending from the sublimation radius of graphite grains up to about 1.2 pc – could be mainly composed of graphite grains and would harbour the observed H2O masers.
5.2 Temperature of the MIDI compact component
The temperatures we derive are much cooler than those of Jaffe et al. (Jaffe (2004)). There are different reasons to these discrepancies. The most important one comes from the difference in the geometries considered that leads to a factor of 2 between the respective sizes derived and consequently to a factor of almost 0.5 on the temperatures. Moreover, our spectral calibration yields twice as much flux. Finally, contrary to Jaffe et al., we do not consider absorption in the inner compact component which we modeled as a pure black body. Indeed, for Jaffe et al., the optical depth associated to silicates in the inner hot component is about 2.1, meaning that the radiation emitted by the central engine is greatly attenuated in this optically thick medium. In this paper, we do not consider this additive parameter and the opacity of the inner component affects the final temperature.
The temperatures we derive from the radiative transfer modeling seem very low with respect to dust sublimation temperatures commonly assumed for graphite grains and silicates which are on the order of 1700 and 1450 K respectively. However, following the approach of Krolik (Krolik (1999)) who, for first rough estimates, assumes thermal emissions by spherical black bodies, the typical angular size of each component inside an AGN is given by the expression:
| (2) |
Hence, for typical sizes of 35 and 83 mas and a flux of 17 Jy at 8 m and 30 Jy at 13 m (according to the MIDI spectrum of NGC 1068), the typical temperatures obtained with this formula are 260 and 160 K. These values are consistent with those we obtain with the radiative transfer model. This shows that considering this simple description, even at small distance from the central engine, temperature falls quickly. Thus, the apparent weakness of temperatures derived from our modeling is finally not surprising.
Furthermore, according to SED measurements of the central elliptical region of mas of the nucleus of NGC 1068 carried out at the Subaru telescopes with a 0.1” spatial resolution, Tomono et al. (Tomono (2001)) derived a temperature of 234 K and an optical depth 0.92, from a model of modified greybody radiation absorbed by silicates. Temperature for such a large area is consistent with those we obtain and the optical depth we are able to derive at 9.7 m is fairly close.
5.3 Dust absorption in the layer
The optical depth as a function of wavelength across the -band is deduced from the optimisation of the fit of visibility measurements. Therefore, it is rather model-dependent.
However, a detailed study of the shape of the optical depth obtained with our model is interesting. Indeed, looking at Fig. 9, it seems that the strong slope between 8.5 and 9.5 m and the bump around 10 m can be the signature of the presence of amorphous silicates in the composition of the layer (in comparison with the absorption features at 10 m associated with the Sgr A* region observed with ISO for instance; Kemper et al. Kemper (2004)). Moreover, given the sublimation radius of silicates which is on the order of 0.64 pc (or 8.9 mas; see sect. 5.1), this type of dust is actually able to survive in the layer. Therefore, to verify the probable presence of silicates, we tried to fit the shape of the derived optical depth with DUSTY, a radiative transfer code into a dusty layer, which includes absorption, emission and scattering by dust (Ivezìc, Nenkova & Elitzur, Ivezic (1999)). This code handles spherical geometry and has been used by Imanishi & Ueno (Imanishi2000 (2000)) to model the Cygnus A nucleus absorption feature at 9.7 m. It is important to underline here that if the torus is viewed almost edge-on (the common assumption for NGC 1068), the use of spherical symmetry in the modeling does not affect the derived optical depth since the thickness of material viewed along the line of sight remains the same as in the case of a torus-like geometry.
Next, Maiolino et al. (2001a , 2001b ) claim that dust in the circumnuclear region of AGNs must have different properties than in the galactic interstellar medium (ISM) and that silicate grain sizes must be larger than 3 m in order to explain the lack of silicate features in ISO spectra of Seyfert II nuclei. This is confirmed by the computation of the ratio which is 0.11 for NGC 1068 (Dartois et al. Dartois (2004)). Indeed, this ratio would be 0.06-0.07 assuming the ratio of both the galactic diffuse interstellar medium (DISM) in the local 3 kpc around the Sun (Roche & Aitken R&A1984 (1984)) and in the direction of the Galactic Centre (Roche & Aitken R&A1985 (1985)), and the ratio in these different directions (Pendleton et al. Pendleton (1994)). In addition to grain sizes, such a difference in extinction laws of the Galactic ISM and Seyfert II AGNs can also result from a temperature gradient in the obscuring dust (Imanishi Imanishi (2000)). Evidences of the flattening of the silicates optical depth with the growth of grain sizes are presented by Bouwman et al. (Bouwman (2001)) and Kemper et al. (Kemper (2004)).
Following these considerations, tentative fits of the derived optical depth with several simple compositions of amorphous silicates and various grain sizes provided with the code DUSTY are presented in Fig. 9 and 10. We are considering the MRN distribution (Mathis, Rumpl & Nordsieck MRN (1977)) which consists in a power law (index = -3.5) distribution of grain sizes ranging from a minimum value of 0.05 micron to various maximum sizes. Species of dust available in DUSTY are “astronomical silicates” and graphite grains from Draine & Lee (D&L (1984); referred as Sil-DL and Grf-DL thereafter), warm oxygen-deficient and cool oxygen-rich silicates – representative of circumstellar and interstellar silicates – from Ossenkopf (Ossenkopf (1992); referred as Sil-Ow and Sil-Oc), Silicon carbid from Pégourié (Pegourie (1988); referred as SiC-Pg), and amorphous carbon (referred as amC). A first remark is that compositions of Sil-Ow or Sil-Oc alone will provide the same optical depth (in shape and amount); the addition of grf-DL or amC in the composition of the dust has no effect on the shape of the optical depth law since absorption or emission features of these species appear around 4 m. We therefore only considered Sil-Ow, Sil-DL and SiC-Pg compounds thereafter.
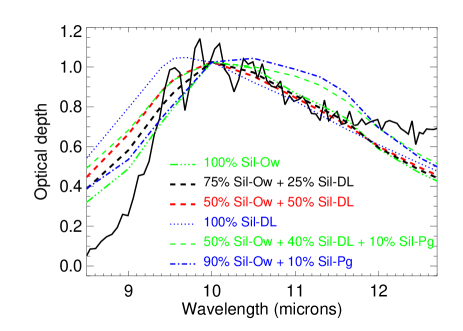
Sil-DL alone provides a good fit of the optical depth after 10 m while the 10 m silicate feature is globally shifted towards lower wavelengths (see Fig 9). On the contrary, when SiC-Pg are added, the bump is shifted to the right and it does not account for the shape around 11 m. Best fits are obtained with a mixture of Sil-Ow with a small amount of Sil-DL.
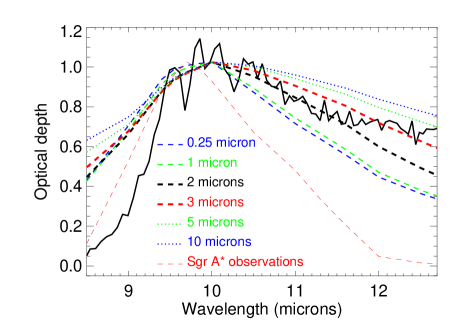
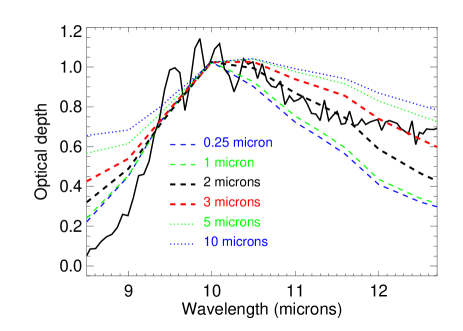
Next, for the study of grain sizes, we considered two of the well fitting compositions: 50% Sil-DL + 50% Sil-Ow and 100% Sil-Ow. We first considered a single grain size distribution. As shown by Kemper at al. (Kemper (2004)), we observed that the silicate feature is significantly shifted towards longer wavelengths as the grain size increases. Best fits are provided by a size of 1 micron. Nevertheless, the MRN distribution provides better fits. According to Fig. 10 which presents comparisons of fits provided by various maximum grain sizes (ranging from 0.25 to 10 microns), distributions of relatively small grains (with sizes smaller than 3 microns) account better for the bump around 10 m while larger grains flatten the optical depth law beyond 10 m.
The quality of the fit of the optical depth is poorer at the edges of the band, and the optical depth derived from the modeling appears to be more asymmetric than what would be expected from DUSTY. There are several reasons for that: first, the model considered here for NGC 1068 is a fairly simple one. Consequently it is not meant to be a real description of the source compared to its a priori complexity. Thus, differences between the real geometry and physical properties of the source and the model will result in inaccuracies in the estimate of the optical depth. Second, differences may arise from the physical properties which are modeled. No scattering is taken into account in the two component radiative transfer model used to fit the MIDI data. Moreover, following Kemper et al. (Kemper (2004)) who assume that the spectra of optical depth are all the narrower as emission by silicates increases, the narrowness of the shape of the optical depth provided by DUSTY beyond 11.5 m could highlight that our model under-estimate silicate emissions in the layer.
However, if we now compare the evolution of optical depth with the one provided by the ISO observations of Sgr A (Kemper et al. Kemper (2004); see Fig. 10), it appears that, although the silicates peak is displaced with respect to wavelength, both plots have similar slopes at low wavelengths. Besides, despite there are no evidences yet of the presence of PAH (Polycyclic Aromatic Hydrocarbon molecules) features in the ISO spectrum of NGC 1068 (at 7.7, 8.6 or 11.3 m; Sturm et al. Sturm (2000)), this trail should be investigated in a further study. Similarly, the strong pure-rotation lines of H2O could significantly contribute to opacity across the -band and could also provide an explanation for the wing in the upper half of the band. Therefore, as these molecules would be able to survive in an environment such as the dusty layer, their presence could also affect the shape of the optical depth and be responsible for the non perfect fit.
Nevertheless, at this point conclusions can already be drawn from the present study of the optical depth. The main features of the dust around the core of NGC 1068 could be:
- •
-
•
small grains, with sizes ranging from 0.05 to 3 microns.
The properties derived from the optical depth deduced from the MIDI observations show that dust around the central engine of the nucleus of NGC 1068 has been detected. This is the first direct evidence of the presence of amorphous silicates in the composition of the dusty environment at radial distances of 1 to 2 pc from the central engine.
5.4 Proposed description of the dust distribution
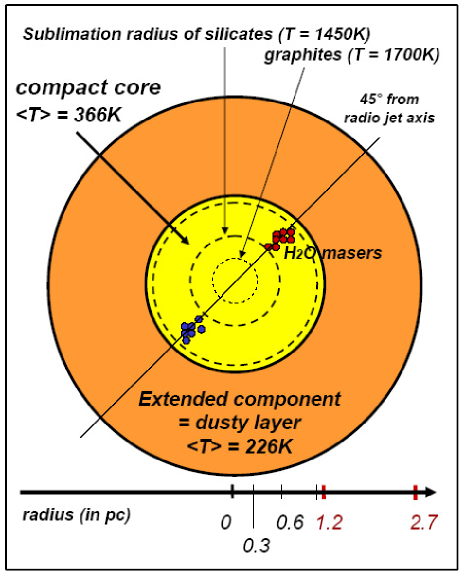
From the above discussion, a picture of the distribution of dust inside the core of NGC 1068 can be drawn (see the scheme in Fig. 11). It is a layered structured. One of the layers is detected in the - and -bands and extends from the sublimation radius of graphite grains up to about 1.2 pc. It could be made of graphite grains, and silicates in its outer parts. The second one emitting in the -band and extending from 1.2 pc up to about 2.7 pc, is well resolved by MIDI and seems to be warmer (about 200 K) and made of amorphous silicates. This picture is consistent with H2O maser emission since masers need a dusty environment in order to survive in the hard UV field radiated by the central engine. The first layer would then act as a protecting shield and would be a favorable environment for water maser emissions. It also provides an explanation for the low temperatures derived from the radiative transfer model applied to the MIDI observations. Indeed, there would be a strong radial temperature gradient inside the inner layer.
6 Conclusions
We present an independent analysis of the first VLTI MIDI observations of the nucleus of NGC 1068 obtained in 2003. The small visibilities measured across the -band show that the core of NGC 1068 is well resolved in the mid-IR.
After a severe selection of the data, different basic models with an increasing number of free parameters have been tried to fit both interferometric and spectral data. As a final scenario, we adopt a simple radiative transfer model with two concentric spherical components. This model accounts well for the MIDI visibilities and SED across the -band. The inner compact component has a radius of about 17 2 mas and a temperature of about 361 12 K, and the outer layer extends up to 41 3 mas from the core of the nucleus and has an average temperature of about 226 8 K. Results are consistent with observations in other spectral bands of the thermal IR and with H2O masers emissions. One specificity of this approach is that it provides the evolution of the layer optical depth across the N band, without requiring assumptions about its nature. Although this parameter is rather model-dependent, its shape seems to be characteristic of amorphous silicate grains. Thus, the conclusion to be drawn from the analysis of the data with this simple model is that MIDI has actually observed the dust distribution around the core of the nucleus of NGC 1068 emitting in the -band.
Besides, this study highlights the degeneracy in the numbers of models being able to describe the current MIDI observations. This should be overcome thanks to various coming near- and mid-IR observations at the VLT. Concerning MIDI, the coverage of the (u,v) plane needs to be increased in order to get visibility points for several new lengths and orientations of the projected baseline. Observations with MIDI should besides put additional constrains on the modeling and lead to a convergent description of the morphology and of the physical properties of the dust distribution. Next, as the slope of the visibility function considered in the model presented by Jaffe et al. (Jaffe (2004)) differs from ours at low spatial frequency, visibility points at low projected baseline should lead to the choice of the most favorable model. As the shortest projected baseline reachable with the VLTI and the UTs is 30 m, one would have to make use of VISIR (the VLT imager and spectrometer for the mid-IR) to get 8.2 m baseline visibility points.
This study is a very first step in the understanding of the dusty environment of the core of an AGN. It will be mandatory to test the approach presented here with observations of other AGNs such as Centaurus A or Circinus.
Acknowledgements.
We thank the MIDI and the Science Demonstration teams for providing the data, Emmanuel Dartois for enlightening information on grain physics, Damien Gratadour and Daniel Rouan for discussions, Tijl Verhoelst for providing synthetic and ISO spectra for Betelgeuse, Arcturus and HD 10380, Walter Jaffe for discussions about the Leiden data reduction.References
- (1) Antonucci, R.R.J., & Miller, J.S. 1985, ApJ, 297, 621
- (2) Barvainis, R. 1987, ApJ, 320, 537
- (3) Beckert, T., & Duschl, W. J. 2004, A&A, 426, 445
- (4) Bevington, P.R., & Robinson D.K. 1992, McGraw-Hill Editions
- (5) Bock, J.J., Neugebauer, G., Matthews, K. et al. 2000, ApJ, 120, 2904
- (6) Bouwman, J., Meeus, G., de Koter, A. 2001, A&A, 375, 950
- (7) Cohen, M., Walker, R.G., Carter, B., et al. 1999, AJ, 117, 1864
- (8) Coudé Du Foresto, V., Ridgway, S. T., Mariotti, J. M. 1997, A&AS, 121, 379
- Danchi et al. (1994) Danchi, W.C., Bester, M., Degiacomi, C.G., Greenhill, L.G., Townes, C.H. 1994, AJ, 107, 1469
- (10) Dartois, E., Marco, O., Munoz-Caro, G. M. et al. 2004, A&A, 423, 549
- (11) Draine, B.T. & Lee, H.M. 1984, ApJ, 285, 89
- (12) Efstathiou, A., Hough, J.H., & Young, S. 1995, MNRAS, 277, 1134
- (13) Elitzur, M. 1992, Astronomical Masers, Kluwer Academic Publishers
- (14) Elvis, M. 2000, ApJ, 545, 63
- (15) Galliano, E., Alloin, D., Granato, G. L. et al. 2003, A&A, 412, 615
- (16) Granato, G.L., & Danese, L. 1993, MNRAS, 268, 235
- (17) Greenhill, L.J., Gwinn, C.R., Antonucci, et al. 1996, ApJ, 472, L21
- (18) Greenhill, L.J., Gwinn, C.R. 1997, Ap&SS, 248, 261G
- (19) Gratadour, D., Clénet, Y., Rouan, D., et al. 2003, A&A, 411, 335
- (20) Gratadour, D., Rouan, D., Mugnier, L. M., et al. 2005, A&A, submitted
- (21) Imanishi, M. 2000, MNRAS, 319, 331
- (22) Imanishi, M. & Ueno, S. 2000, ApJ, 535, 626
- (23) Ivezìc, Z., Nenkova, M. & Elitzur, M., 1999, User Manual for DUSTY, University of Kentucky Internal Report
- (24) Jaffe, W., Meisenheimer, K., Röttgering, H.J.A., et al. 2004, Nature, 429, 47
- (25) Kartje, J.F., Königl, A., & Elitzur, M. 1999, ApJ, 513, 180
- (26) Kemper, F., Vriend, W. J., & Tielens, G. G. M. 2004, ApJ, 609, 826
- (27) Kervella, P., et al. accepted for publication in A&A
- (28) Krolik, J., H., 1999, Active Galactic Nuclei, Princeton Series in Astrophysics
- (29) Krolik, J. H., & Begelman, M. 1988, ApJ, 329, 702
- (30) Maiolino, R., Marconi, A., Salvati, M., et al. 2001, A&A, 365, 28
- (31) Maiolino, R., Marconi, A., & Oliva, E. 2001, A&A, 365, 37
- (32) Maloney, P.R. 2002, PASA, 19, 401M
- (33) Mathis, J. S., Rumpl, W., & Nordsieck, K. H. 1977, ApJ, 217, 425
- (34) Miller, J.S., Goodrich, R.W., Mathews, W.G. 1991, ApJ, 378, 47
- (35) Nenkova, M., Ivezic, Z., & Elitzur, M. 2002, ApJ, 570, L9
- (36) Ossenkopf, V., Henning, Th. & Mathis, J.S. 1992, A&A, 261, 567
- (37) Pendleton, Y. J., Sandford, S. A., Allamandola, L. J., et al. 1994, ApJ, 437, 683
- (38) Pégourié, B. 1988, A&A, 194, 335
- Perrin et al. (1998) Perrin, G., Coudé du Foresto, V., Ridgway, S.T., et al. 1998, A&A, 331, 619
- (40) Perrin, G. 2003, A&A, 398, 385
- (41) Perrin, G., Ridgway, S.T., Mennesson, B. et al. 2004, A&A, 426, 279
- (42) Perrin, G., et al. A&A, in preparation
- (43) Pier, E. A., & Krolik, J. H. 1992, ApJ, 401, 99
- (44) Pier, E. A., & Krolik, J. H. 1993, ApJ, 418, 673
- (45) Pier, E. A., Antonucci, R., Hurt, T. et al. 1994, ApJ, 428, 124
- (46) Roche, P. F., & Aitken, D. K. 1984, MNRAS, 208, 481
- (47) Roche, P. F., & Aitken, D. K. 1985, MNRAS, 215, 425
- (48) Rouan, D., Rigault, F., Alloin, D., et al. 1998, A&A, 339, 687
- (49) Rouan, D., Lacombe, F., Gendron, E., et al. 2004, A&A, 417, L1
- (50) Schartmann, M., Meisenheimer, K., Camenzind, M. et al. 2005, A&A, 437, 861
- (51) Sturm, E., Lutz, D., Tran, D., et al. 2000, A&A, 358, 481
- (52) Thatte, N., Quirrenbach, A., Genzel, R., et al. 1997, ApJ, 490, 238
- (53) Tomono, D., Doi, Y., Usuda, T. et al. 2004, A&A, 417, 1
- Verhoelst et al. (2005) Verhoelst, T., Decin, L., Van Malderen, R., et al. 2005, submitted to A&A
- (55) Weigelt, G., Wittkowski, M., Balega, Y.Y., et al. 2004, A&A, 425, 77
- (56) Weinberger, A. J., Neugebauer, G., and Matthews, K. 1999, ApJ, 117, 2748
- (57) Wittkowski, M., Balega, Y., Beckert, T., et al. 1998, A&A, 329, L45
- (58) Wittkowski, M., Kervella, P., Arsenault, R., et al. 2004, A&A, 418, L39
- (59) Zier, C., & Biermann, P. L. 2002, A&A, 396, 91
| UT time | Projected baseline | Baseline Azimuth | UT time | UT time |
|---|---|---|---|---|
| (m) | () | (Calibrator 1) | (Calibrator 2) | |
| 09:56:54.000 | 78.6670 | 0.036 | 09:34:22.000 | - |
| 09:58:46.811 | 78.6670 | 0.036 | 09:35:38.451 | - |
| 10:02:32.432 | 78.6670 | 0.036 | 09:36:54.901 | - |
| 10:10:12.000 | 78.6670 | 0.036 | ||
| 10:11:44.611 | 78.7050 | 0.036 | ||
| 10:13:17.223 | 78.7050 | 0.036 | ||
| 10:14:49.834 | 78.7050 | 0.036 |
| UT time | Projected baseline | Baseline Azimuth | UT time | UT time | |
|---|---|---|---|---|---|
| (m) | () | (Calibrator 1) | (Calibrator 2) | ||
| 02:50:22.451 | 39.5900 | 35.16 | - | 03:59:13.432 | |
| 02:52:55.352 | 39.5900 | 35.16 | - | 04:00:29.882 | |
| - | 04:01:46.333 | ||||
| 04:48:28.000 | 45.5410 | 44.60 | 03:59:13.432 | 05:17:54.000 | |
| 04:49:44.451 | 45.5410 | 44.60 | 04:00:29.882 | 05:19:10.450 | |
| 04:51:00.901 | 45.5410 | 44.60 | 04:01:46.333 | 05:20:26.901 | |
| 05:58:27.451 | 46.6340 | 45.90 | 05:17:54.000 | 06:33:28.000 | |
| 05:59:43.882 | 46.6340 | 45.90 | 05:19:10.450 | 06:34:44.450 | |
| 05:20:26.901 | 06:36:00.901 | ||||
| 07:01:56.000 | 45.7090 | 44.76 | 06:33:28.000 | - | |
| 07:03:12.450 | 45.7090 | 44.76 | 06:34:44.450 | - | |
| 06:36:00.901 | - |