PMAS: The Potsdam Multi Aperture Spectrophotometer.
II. The Wide Integral Field Unit PPak
Abstract
PPak is a new fiber-based Integral Field Unit (IFU), developed at the Astrophysical Institute Potsdam, implemented as a module into the existing PMAS spectrograph. The purpose of PPak is to provide both an extended field-of-view with a large light collecting power for each spatial element, as well as an adequate spectral resolution. The PPak system consists of a fiber bundle with 331 object, 36 sky and 15 calibration fibers. The object and sky fibers collect the light from the focal plane behind a focal reducer lens. The object fibers of PPak, each 2.7 arcseconds in diameter, provide a contiguous hexagonal field-of-view of 74 64 arcseconds on the sky, with a filling factor of 60%. The operational wavelength range is from 400 to 900 nm. The PPak-IFU, together with the PMAS spectrograph, are intended for the study of extended, low surface brightness objects, offering an optimization of total light-collecting power and spectral resolution. This paper describes the instrument design, the assembly, integration and tests, the commissioning and operational procedures, and presents the measured performance at the telescope.
1 Introduction
3D-spectrographs (3DS), or Integral Field Units (IFU) exist at many observatories, providing spectra for a large number of spatial elements (“spaxel”) within a 2-dimensional field-of-view, rather than only along a traditional 1-dimensional spectrograph slit. Depending on the instrument, up to hundreds or thousands of spectra are recorded simultaneously in any single exposure. While the instrumentation suite is diverse and based on various principles of operation (image slicers, lens-arrays, fiber-bundles or combinations of these), compromises with respect to field-of-view, spatial sampling, wavelength coverage, and spectral resolution have to be made, due to the limited detector space.
Since commissioning in May 2001, the Astrophysical Institute Potsdam (AIP) successfully operates PMAS, the Potsdam Multi-Aperture Spectrophotometer, at the Calar Alto 3.5 m Telescope in southern Spain (Roth et al. 2004, Kelz et al. 2003a). An overall description of the PMAS instrument is given by Roth et al. (2005), hereafter referred to as paper I. While PMAS is a unique spectrophotometer, covering a wide wavelength range from 350 nm to 900 nm, its standard IFU, a fiber-coupled lens-array, provides 256 spectra and is limited to a maximum integral field-of-view of 1616 arcseconds on the sky.
Driven by the “Disk Mass” project (Verheijen et al. 2004), which requires imaging spectroscopy of nearby face-on galaxies (with typical sizes of 1 arcminute) at intermediate spectral resolution (of R8000), a science case was put forward to develop a larger IFU for PMAS. Based on the experience with the SparsePak bundle, which was constructed and commissioned for the 3.5m WIYN telescope at Kitt Peak (Bershady et al. 2004, 2005), the PPak (PMAS fiber Package) fiber bundle was designed and built at the AIP in 2003 as part of the ULTROS project (ultra-deep optical spectroscopy with PMAS). This new IFU was produced on a short timescale of approximately six months and with a budget of less than 20.000 Euro for the hardware components (mainly lenses, filters and fibers). PPak was successfully integrated within PMAS in December 2003 and commissioned in spring 2004. The PPak-mode of PMAS is now fully operational and routinely employed for the Disk Mass project, as well as for a variety of other common user programmes, that require large integral-field spectroscopy.
| Instrument | Telescope | FoV | Spaxel | Spaxel | Filling | Range44footnotemark: | Resol.44footnotemark: | Grasp | |
| diameter | (max.) | size11footnotemark: | number22footnotemark: | factor33footnotemark: | () | () | specific55footnotemark: | total66footnotemark: | |
| [m] | [arcsec] | [arcsec] | [Å] | [arcsec2m2] | [arcmin2m2] | ||||
| PMAS-PPak7 | CA 3.5 | 7464 | 2.68 | 331+36 | 0.60 | 400 | 8000 | 47 | 4.23 |
| SparsePak | WIYN 3.5 | 7271 | 4.69 | 75+7 | 0.25 | 260 | 12000 | 138 | 2.87 |
| DensePak | WIYN 3.5 | 4530 | 2.81 | 91+4 | 0.42 | 260 | 20000 | 49 | 1.25 |
| INTEGRAL | WHT 4.2 | 3429 | 2.70 | 115+20 | 0.67 | 360 | 4200 | 73 | 2.32 |
| VIMOS | VLT 8.2 | 5454 | 0.670.67 | 6400 | 1.00 | 350 | 220 | 23 | 40.50 |
| SAURON | WHT 4.2 | 4133 | 0.940.94 | 1577 | 1.00 | 540 | 1250 | 11 | 4.77 |
| SPIRAL8 | AAT 3.9 | 2211 | 0.7 0.7 | 512 | 1.00 | 330 | 7600 | 5.4 | 0.77 |
| PMAS-LARR9 | CA 3.5 | 1616 | 1.0 1.0 | 256 | 1.00 | 700 | 6000 | 8.2 | 0.58 |
| OASIS | WHT 4.2 | 1712 | 0.42 hex. | 1100 | 1.00 | 370 | 2650 | 2.3 | 0.71 |
| GMOS | Gemini 8.1 | 75 | 0.2 hex. | 1000+500 | 1.00 | 280 | 1700 | 1.8 | 0.49 |
1 corresponding value to the max. FoV, may depend on fore-optics magnification
2 dedicated sky-spaxels are listed separately
3 bare fiber bundles (upper part); lens-array-types (lower part)
4 selected values only; may span wide range depending on configuration and wavelength
5 specific grasp = telescope area [m2] spaxel size [arcsec2]
6 total grasp = telescope area [m2] spaxel size [arcsec2] number of spaxels
7 PPak-IFU and PMAS spectrograph with 2nd order gratings
8 SPIRAL with Littrow spectrograph (de-commissioned)
9 Lens-array IFU and PMAS spectrograph with 1st order gratings
As a bare fiber-bundle IFU, PPak is based on earlier developments, such as DensePak (Barden & Wade 1988), INTEGRAL (Arribas et al. 1998) and SparsePak (Bershady et al. 2004). Similar to the above instruments, PPak opts for rather large fibers, that can not properly sample the (seeing-limited) image, but collect more flux and allow for wide fields. PPak and SparsePak span 7464 and 7271 arcseconds on the sky respectively and provide the largest fields-of-view of any IFU available worldwide (see Table 1). Additionally, a single PPak fiber with 5.7 arcsec2 on the sky, collects twice the amount of light at the 3.5m telescope, than a single spatial element of the VIMOS-IFU (LeFevre et al. 2003) at the 8.2m-VLT (see specific grasp in Table 1). PPak is attached to the efficient PMAS fiber-spectrograph, that provides resolutions R= from 800 to 8000, or corresponding spectral powers (defined as the product of resolution times the number of spectral resolution elements NΔλ ) between 106 to 107. The PPak fibers and optics are optimized for wavelengths between 400–900 nm.
Therefore, PPak is ideally suited for
spectroscopic studies of extended astronomical objects with low
surface brightness, such as the outskirts of spiral galaxies, where
sufficient signal is more important than detailed spatial
resolution.
The PMAS+PPak configuration offers a powerful combination of light-collecting power or grasp, wavelength range, and spectral resolution.
This paper is organized as follows: § 2 presents the instrument and its opto-mechanical design. § 3 summarizes the manufacture, assembly, and integration of the PPak components. § 4 describes the operational procedure during observation, the data reduction, and visualization tools. The instrument performance at the telescope and test results are given in § 5.
2 Instrument Description
The baseline parameters for the PPak development were, to provide a contiguous sampled field-of-view of at least 1 arcminute across with high specific grasp per spaxel and adequate resolution at the spectrograph. PPak needed to be designed as an unforeseen add-on module to the existing, Cassegrain mounted, PMAS instrument. Therefore, certain space constraints dictated the overall design. Likewise, the PMAS spectrograph hardware and performance had to be taken as given. The existing PMAS grating set (see table 2 of paper I) includes gratings with 300, 600 and 1200 l/mm, of which two can be used in the 2nd spectral order. Taking advantage of anamorphic demagnification (see section 5.4), spectral resolutions of R8000 can be achieved with the I1200 and J1200 gratings, if the width of the pseudo-slit of the PMAS spectrograph does not exceed 150 microns, which respectively limited the fiber core diameters. Around 400 of these fibers can be accommodated at the spectrograph slit with acceptable separations and cross-talk. The PMAS spectrograph accepts a F/3 beam, which implies that, allowing for some focal ratio degradation, the fibers can be fed with up to F/3.3 in the focal plane, which sets the plate scale and fiber grasp. The purchase of even higher-line density or holographic reflection gratings was no consideration at the time of the PPak development.
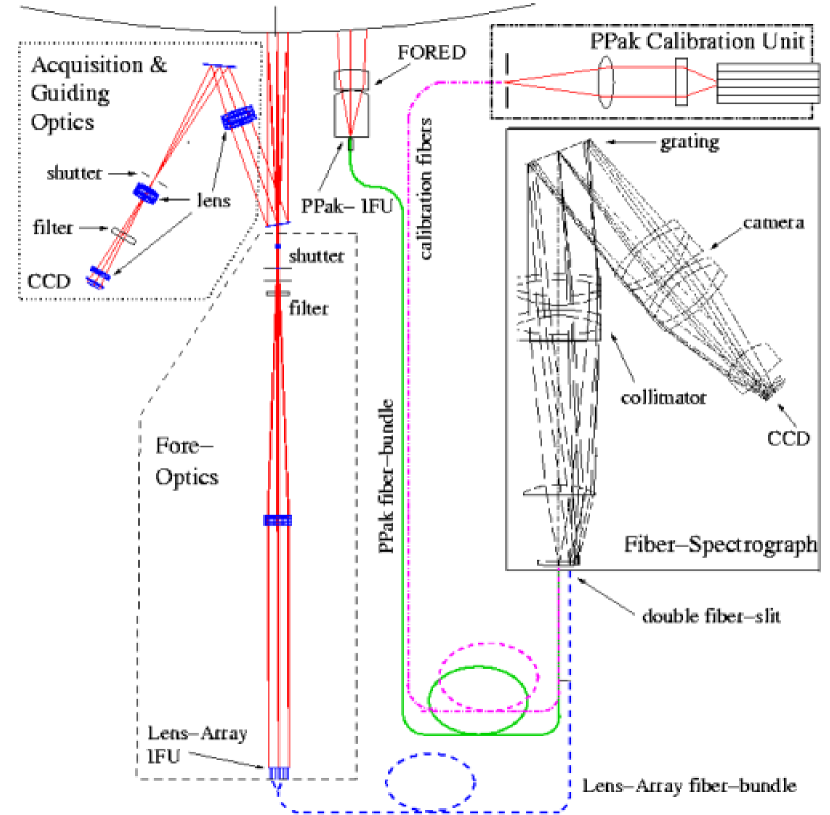
Fig. 1 illustrates the principle of operation for both the pre-existing lens-array IFU and the new PPak IFU: For the lens-array-mode, the telescope focal plane image is magnified by a fore-optics (dashed box) (Roth et al. 2003), then spatially sampled by a lens-array and re-configured by an optical fiber module (Kelz et al. 2003b).
PPak, on the other hand, is equipped with a focal reducer lens (FORED) in front of the telescope’s focal plane, which maximizes the field-of-view, and provides the required plate scale and f-number. The subsequent fiber bundle (solid line) by-passes the fore-optics and lens-array and bridges the distance of around 3 meters to the spectrograph. Additional fibers (dash-dotted) connect the spectrograph to a dedicated calibration unit. At the spectrograph entrance, the fibers from both the lens-array and the PPak-IFU form two parallel slits, of which only one is active during observing. The PPak-IFU is placed 6 arcminutes off-axis, as not to obstruct the existing field for the direct imaging camera. This allows to use the A&G optics (dotted box) for target acquisition and guiding in both the PPak- and lens-array-IFU mode. The various components are described in more detail in the following subsections.
2.1 Focal Reducer Lens
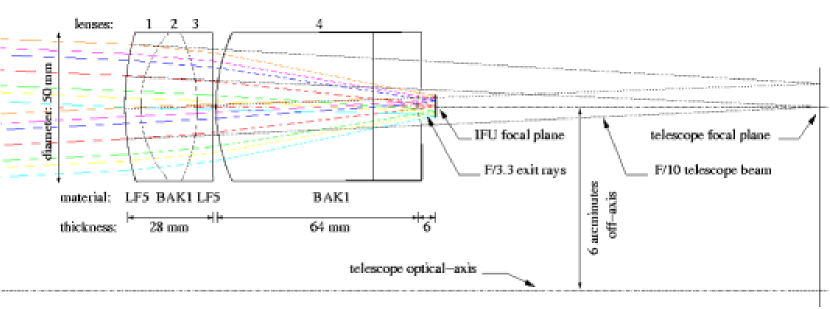
The focal reducer lens (FORED) immediately in front of the fiber bundle reduces the focal length of the Calar Alto 3.5m telescope from 35000 mm to 11550 mm, changes the plate-scale from per mm to per mm, and converts the telescope F-number from F/10 to F/3.3. The focal reducer is a 4-lens system, consisting of a triplet and a thick singlet lens (see Fig. 2), which creates the required telecentric exit rays. The system has four glass-to-air interfaces, which are treated with anti-reflective coatings. The individual lenses of the triplet are made of LF5, BaK1, LF5, respectively, while the fourth lens is made of BaK1. The thickness of the triplet is 28 mm, that of the single lens 64 mm, while their diameters are 50 mm. The lenses are optimized for a wavelength interval between 400 and 850 nm, i.e. neglecting the blue part of the spectrum that otherwise is accessible with the PMAS spectrograph.
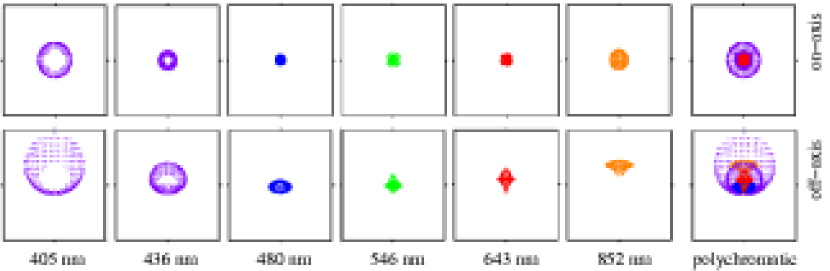
The image quality, that the focal reducer provides, was optimized to match the fiber size of 150 m and does not deteriorate the point-spread-function beyond the typical seeing (see spot diagrams in Fig. 3). As the light is coupled to optical fibers, telecentric exit rays are required. The focal reducer lens creates a telecentric field of 7 mm (=125 arcsec) in diameter. Additionally, the system can be placed up to 65 mm off-axis, which is necessary due to space constraints within the existing PMAS instrument. The off-axis position of the focal reducer causes a small telecentric offset of 0.25 degree. While in principle this offset could be compensated completely with a tilt correction of the entire fiber array, it was considered a small and negligible change in terms of the incoming F-number (see Fig. 12 of Bershady et al. 2004).
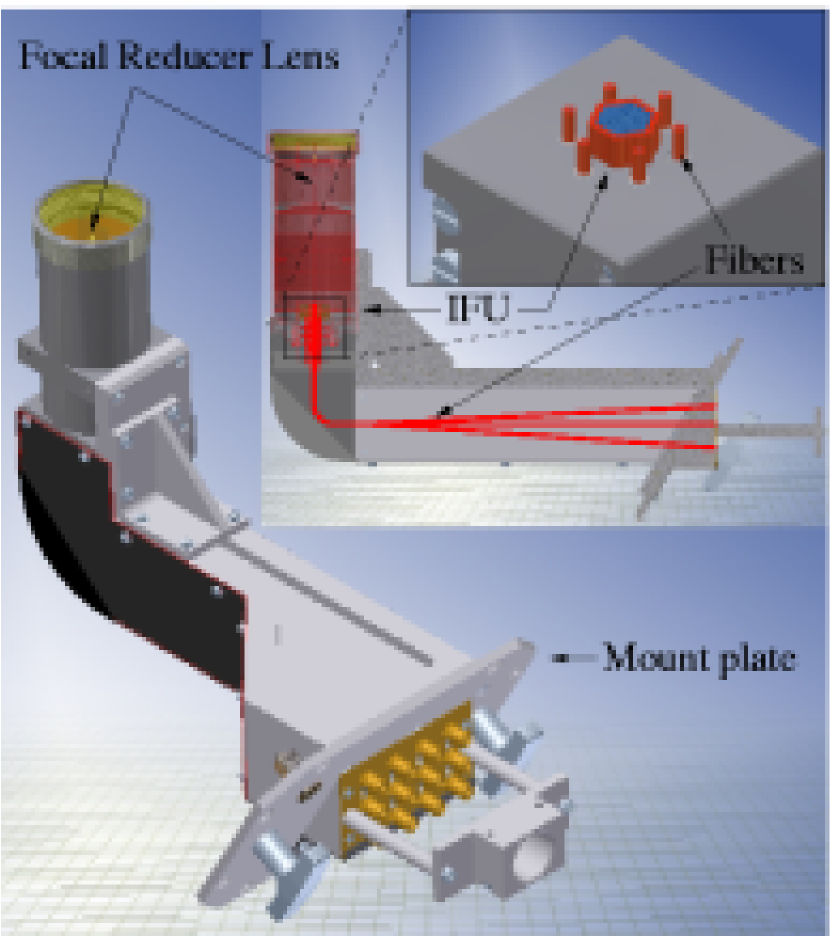
A common, compact and stiff mount for the focal reducer and the PPak-IFU was designed in order to make sure, that the fiber bundle is firmly attached to the focal reducer image plane, which is located 6 mm behind the lens (see Fig. 4). This mount also allows the insertion of bandpass or interference filters (with diameters of 50 mm or 2 inch) in front of the lens. Any mechanical flexure due to a changing gravity vector was calculated to be 4 m ( 0′′.1) in the worst case. In the spatial direction, this is much smaller than the fiber sampling size (of 150 m) or effects caused by seeing (0′′.5 30 m). In terms of focal accuracy, this amount of flexure is negligible. Note, that due to the limited pointing accuracy of the telescope, it is practically impossible to measure flexure effects of this magnitude, if present at all.
2.2 PPak IFU
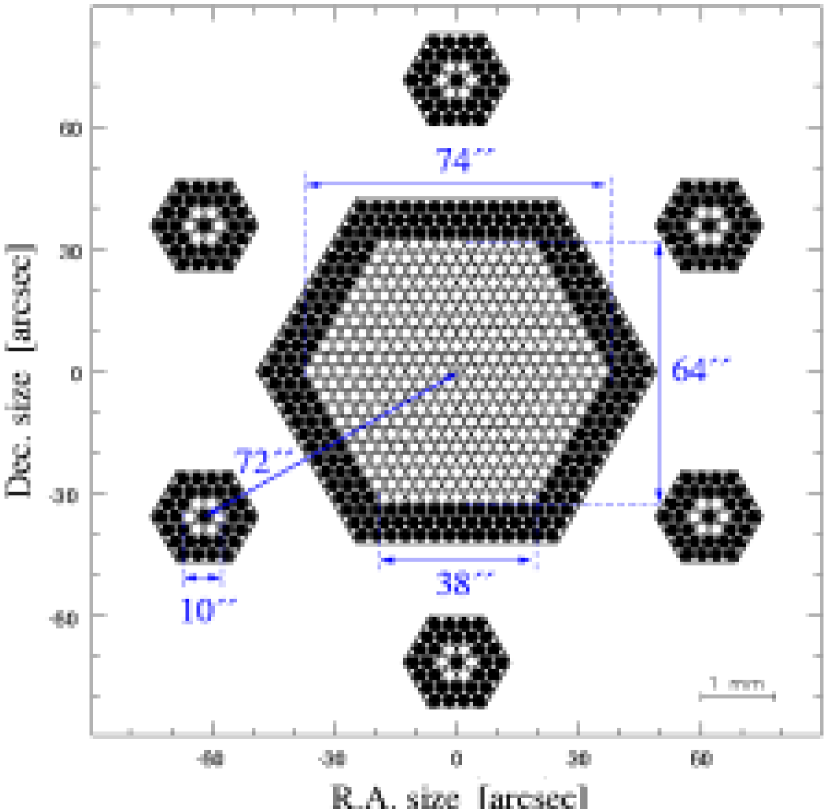
The final PPak design features 331 fibers in a densest packed hexagonal grid with a maximum diameter of 74′′, while each fiber projects to 2′′.68 in diameter on the sky. The fiber-to-fiber pitch is 3.6 arcseconds. The projected fiber area with 5.7 arcsec2 is comparable to DensePak or INTEGRAL, but smaller than for SparsePak. However, the larger number of fibers allows the observer much freedom, to apply adaptive binning of spaxels to increase the signal-to-noise.
Additional 36 fibers are distributed amongst six ‘mini-IFUs’ and placed 72′′ away from the center to sample the surrounding sky (see Fig. 5). Not shown are 15 extra fibers, that are not part of the IFU, but are connected to a calibration unit. These calibration fibers can be illuminated with light from spectral line lamps during the science exposures. This provides a synchronous spectral calibration and keeps track of any image shifts at the spectrograph detector (see section 4.9 of paper I).
A fair amount of additional fibers (shown in black) is placed around the active (white) fibers for protective buffer purposes and to avoid increased FRD edge-effects (see Figs. 8 and 9 in Bershady et al., 2004) of the outer science fibers. These buffer fibers have a length of 70 mm and terminate inside the mount, just below the IFU head. Table 2 gives a summary of the total fiber breakdown.
| # Fibers | Active | Buffer | Total |
|---|---|---|---|
| object | 331 | 216 | 547 |
| sky | 36 | 186 | 222 |
| calibration | 15 | 22 | 37 |
| total | 382 | 424 | 806 |
2.3 Fiber Slit
The output ends of the fibers are placed side-by-side to form a long fiber-slit. For practical reasons and to assist data reduction, the overall fiber-slit is divided into 12 blocks (called slitlets). A slitlet is 7.5 mm wide and features 32 v-grooves with a spacing of 0.234 mm (see Fig. 9, right). Given a spectrograph magnification of 0.6 and 15 m pixel, a fiber core projects to 6 pixel at the detector, with a pitch of 9.4 pixel. The chosen spacing is a trade-off to minimize cross-talk and the overall slit-length, because of edge vignetting.
Contrary to other IFUs, that are add-on units to existing spectrographs, PMAS features a designated fiber-spectrograph (see paper I). The spectrograph collimator is a f=450 mm, F/3 system, and therefore the optics accepts the whole fiber output cone without the need of additional beam-converting micro-lenses. The spectrograph optics require a curved fiber-slit, that directly couples to the first lens of the collimator. The fibers are mounted parallel to each other, but terminate at different lengths, to form a curved focal surface (see Fig. 9, left).
2.4 Slit to Sky Mapping

The focal plane geometry of the PPak IFU is largely determined by the Disk Mass project. The arrangement of the fibers in the focal plane and how they map to the slit follows a quasi-random fashion. The central IFU can be divided in five main segments (see Fig. 7). The central segment, with fibers numbered 148 to 184, maps to the central part of the slit. The fibers in the two intermediate segments of the IFU (1 to 66 for the northern part, and 266 to 331 for the southern part), map to the edges of the slit. The fibers in the two outer IFU segments (67 to 147 for the northern part, and 185 to 265 for the southern part), terminate halfway between the center and the edges of the slit (see Tab. 3). A reason for this arrangement was, that for typical targets, such as galaxies, the surface brightness falls off rapidly away from the center. As the outer fibers carry the weaker signals, any additional vignetting or aberration effects, predominantly at the edge of the slit, shall be avoided. Care was taken, that fibers which are adjacent in the focal plane, are well separated in the slit. The aim was to minimize any systematic effects, that purely depend on the location of fibers within the spectrograph. Note, that this is an opposite philosophy to other instrument layouts, such as SPIRAL (Lee & Taylor 2000), where adjacent fibers at the sky remain adjacent at the slit.
Also note, that the central row at the IFU, starting in the east with fiber number 185 and ending in the west with number 92, contains fibers from all 5 segments. This implies, that drifting a star across the central row produces 21 spectra distributed over the entire CCD, nearly sampling the full range of optical paths through the spectrograph.
Each slitlet carries 3 sky fibers. Those 3 sky fibers are distributed in three non-adjacent sky-IFUs. In this way, each triplet of sky fibers on a slitlet spans a triangular area on the sky, which surrounds the main IFU. In other words, the sky is sampled symmetrically around the object and is well distributed within the slit, again to avoid any instrumental biases. This scheme results in 36 sky-fibers altogther, which is twice the ‘optimum’ number of dedicated sky fibers as calculated by Bershady et al. (2004, Fig.3), but helps to limit systematic errors in the sky subtraction.
| Groove | Slitlet number | |||||||||||
|---|---|---|---|---|---|---|---|---|---|---|---|---|
| number | 1 | 2 | 3 | 4 | 5 | 6 | 7 | 8 | 9 | 10 | 11 | 12 |
| 1 | C1 | C3 | C4 | C5 | C6 | C7 | C9 | C10 | C11 | C12 | C13 | C14 |
| 2 | C2 | 27 | 55 | 83 | 111 | 139 | 166 | 194 | 222 | 250 | 278 | 306 |
| 3 | 28 | 56 | 84 | 112 | 140 | 167 | 195 | 223 | 251 | 279 | 307 | |
| 4 | 1 | 29 | 57 | 85 | 113 | 141 | 168 | 196 | 224 | 252 | 280 | 308 |
| 5 | 2 | 30 | 58 | 86 | 114 | 142 | 169 | 197 | 225 | 253 | 281 | 309 |
| 6 | S1 | S4 | S7 | S10 | S13 | S16 | S19 | S22 | S25 | S28 | S31 | S34 |
| 7 | 3 | 31 | 59 | 87 | 115 | 143 | 170 | 198 | 226 | 254 | 282 | 310 |
| 8 | 4 | 32 | 60 | 88 | 116 | 144 | 171 | 199 | 227 | 255 | 283 | 311 |
| 9 | 5 | 33 | 61 | 89 | 117 | 145 | 172 | 200 | 228 | 256 | 284 | 312 |
| 10 | 6 | 34 | 62 | 90 | 118 | 146 | 173 | 201 | 229 | 257 | 285 | 313 |
| 11 | 7 | 35 | 63 | 91 | 119 | 147 | 174 | 202 | 230 | 258 | 286 | 314 |
| 12 | 8 | 36 | 64 | 92 | 120 | 148 | 175 | 203 | 231 | 259 | 287 | 315 |
| 13 | 9 | 37 | 65 | 93 | 121 | 149 | 176 | 204 | 232 | 260 | 288 | 316 |
| 14 | 10 | 38 | 66 | 94 | 122 | 150 | 177 | 205 | 233 | 261 | 289 | 317 |
| 15 | 11 | 39 | 67 | 95 | 123 | 151 | 178 | 206 | 234 | 262 | 290 | 318 |
| 16 | 12 | 40 | 68 | 96 | 124 | 152 | 179 | 207 | 235 | 263 | 291 | 319 |
| 17 | S2 | S5 | S8 | S11 | S14 | S17 | S20 | S23 | S26 | S29 | S32 | S36 |
| 18 | 13 | 41 | 69 | 97 | 125 | 153 | 180 | 208 | 236 | 264 | 292 | 320 |
| 19 | 14 | 42 | 70 | 98 | 126 | 154 | 181 | 209 | 237 | 265 | 293 | 321 |
| 20 | 15 | 43 | 71 | 99 | 127 | 155 | 182 | 210 | 238 | 266 | 294 | 322 |
| 21 | 16 | 44 | 72 | 100 | 128 | 156 | 183 | 211 | 239 | 267 | 295 | 323 |
| 22 | 17 | 45 | 73 | 101 | 129 | 157 | 184 | 212 | 240 | 268 | 296 | 324 |
| 23 | 18 | 46 | 74 | 102 | 130 | 158 | 185 | 213 | 241 | 269 | 297 | 325 |
| 24 | 19 | 47 | 75 | 103 | 131 | 159 | 186 | 214 | 242 | 270 | 298 | 326 |
| 25 | 20 | 48 | 76 | 104 | 132 | 160 | 187 | 215 | 243 | 271 | 299 | 327 |
| 26 | 21 | 49 | 77 | 105 | 133 | 161 | 188 | 216 | 244 | 272 | 300 | 328 |
| 27 | 22 | 50 | 78 | 106 | 134 | 162 | 189 | 217 | 245 | 273 | 301 | 329 |
| 28 | S3 | S6 | S9 | S12 | S15 | S18 | S21 | S24 | S27 | S30 | S33 | S36 |
| 29 | 23 | 51 | 79 | 107 | 135 | 163 | 190 | 218 | 246 | 274 | 302 | 330 |
| 30 | 24 | 52 | 80 | 108 | 136 | 164 | 191 | 219 | 247 | 275 | 303 | 331 |
| 31 | 25 | 53 | 81 | 109 | 137 | 165 | 192 | 220 | 248 | 276 | 304 | |
| 32 | 26 | 54 | 82 | 110 | 138 | C8 | 193 | 221 | 249 | 277 | 305 | C15 |
2.5 Fiber Loop Box
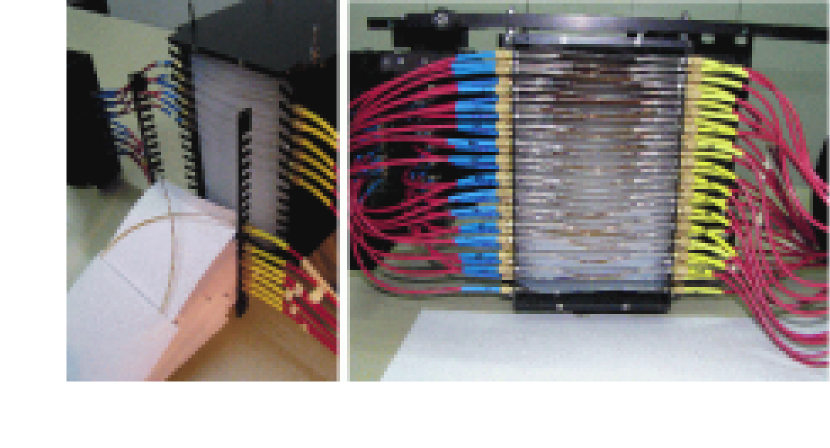
Stress on optical fibers increases the focal ratio degradation (FRD) with consequences for the overall optical system performance (see Barden 1998, Parry & Carrasco 1990, Ramsey 1988, Schmoll et al. 2003, and references therein). To minimize FRD, and therefore the loss of information, the fibers are inserted into protective, friction-free 3-layer furcation tubings, and only bent with tolerable radii. Roughly 2 m behind the IFU and some 40 cm in front of the fiber-slit, the protective tubing is interrupted, to allow the fibers to form a loop. The fiber loops are placed inside an enclosed box of 30 30 cm, where they are being kept in groups of 32 and placed into separate sections, divided by Teflon sheets (see Fig. 12). The loop box serves two functions: Any pull on a fiber results in a change of the individual loop diameter, which avoids the fibers from being torn. Secondly, the loops provide a reservoir of extra fiber length, which is needed during assembly and integration. Note, that both the IFU and the spectrograph are mounted at the Cassegrain station and remain fixed with respect to each other. Therefore, no stress-relief cabling, as for bench-mounted instruments with long (10m) fiber length is required.
2.6 PPak Calibration Unit
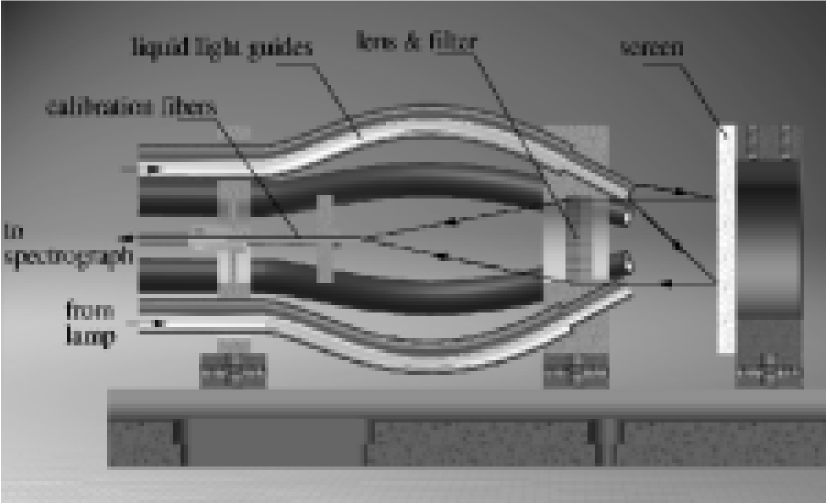
Fifteen fibers that are distributed along the fiber-slit are diverted from the rest of the fiber-bundle, as their input ends are not placed at the telescope focal plane but connected to the PPak Calibration Unit (PPCU). This unit is made from standard OWIS laboratory equipment and consists of five liquid light guides (Lumatec, Germany), a white diffuser screen, a relay lens and the calibration fibers themselves (see Fig. 8). Four liquid light guides illuminate the diffuser screen with light from the various calibration lamps (such as Halogen continuum, Mercury, Neon and Thorium/Argon). A fraction of the light is picked-up by the relay lens and focused onto the calibration fibers, with the same F-number as for the science fibers, and with an object distance at infinity. As the lamps are placed within electronic boxes and feature individual shutters, any combination of calibration light (and respective exposure times) can be fed into the calibration unit. The calibration fibers can be illuminated separately from or simultaneously with the object fibers, allowing the observer flexibility with respect to calibration strategy and needs. Finally, a change of lamps or a swap to a spare lamp is easily done by re-connecting the light guide(s), without any changes to the calibration unit itself.
3 Manufacture, assembly and integration
3.1 Lens Optics
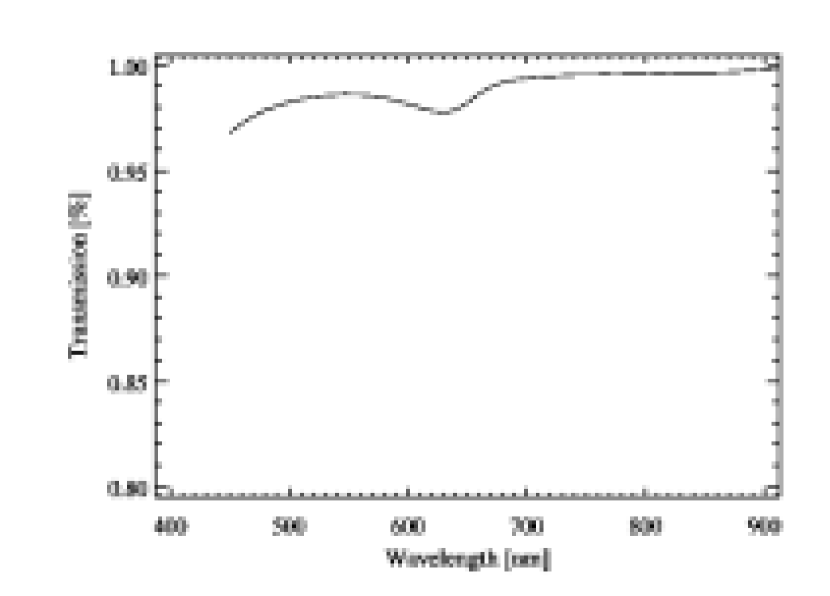
The fabrication of the focal reducer lens was contracted to Präzisionsoptik Gera, (Germany), based on specifications from the optical design calculations by U.L. (see § 2.1). These calculations were repeated as soon as the glasses had been procured from Schott, (Germany), and the index of refraction had been measured at the design wavelengths in order to optimize the design. Note, that due to its thickness, the fourth lens was made from two pieces. The individual lenses were cemented using optical compound K57, produced by Carl Zeiss Jena. All glass–air surfaces were treated with a Balzers broad-band AR coating, yielding a transmission of 98% across the design wavelength range.
The first lens of the spectrograph collimator (diameter D=100 mm, curvature R=218mm), to which the fiber-slit connects, was produced by Carl Zeiss Jena (Germany).
3.2 Fiber Cables
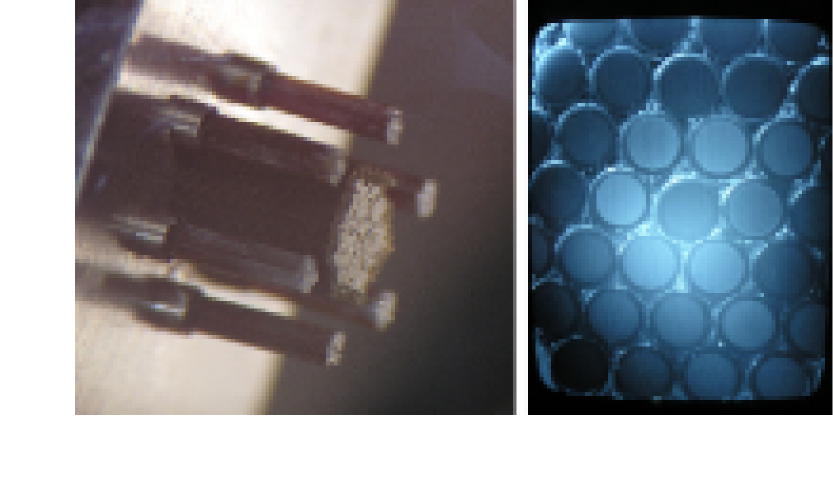
After tests in the AIP laboratories, silica/silica, step-index fibers with core/cladding/buffer diameters of 150/165/195 microns, low OH core and NA=0.22 of the series FIP150165195 from Polymicro Technologies Inc. (USA) were selected (see Fig. 6). The fiber bundle was manufactured as follows: Firstly, the fibers were cut to a length of 3.5 m and one end was polished manually (smallest grain size=0.3 m). The reason for polishing the exit surfaces at this early stage was, that the assembled fiber-slit is curved and therefore difficult to polish. At the input end, the fibers were assembled into the IFU head first and polished afterwards. Copying parts of the SPIRAL-B design (Lee & Taylor 2000), a three-layer polypropylene-KEVLAR-PVC furcation tube from Northern Lights Cable (USA) was cut to lengths and fitted with connector screws on both ends. Altogether 367 fibers were inserted into 12 protective tubings, each tube carrying the object and sky fibers from one slitlet. The 15 calibration fibers were put into an additional tube.
3.3 Fiber-Slit Assembly
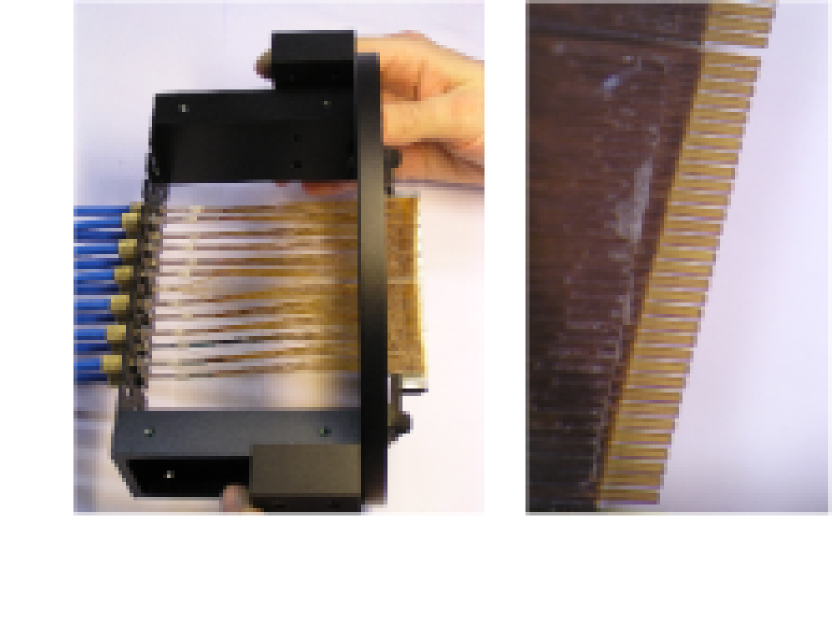
The polished ends of the fibers were glued onto the 12 slitlets, using EPO-TEK 301-2 non-shrinking two-component epoxy from Polytek. Each slitlet typically holds 28 object fibers, 3 sky fibers and 1 calibration fiber (see Tab. 3 for details). The outermost calibration fibers (C1 and C2 at one end, and C15 at the other end of the slit) are separated from the object fibers by one empty groove. Three sky fibers (from 3 different sky-IFUs) are distributed uniformly amongst the 28 object fibers. To ensure a correct and repetitive fiber alignment, an assembly jig was produced, that holds both the fibers and the slitlet in place and allows an accurate end termination of each fiber against a dummy surface with the correct curvature. After the correct alignment was controlled visually, the fibers were clamped temporarily and then glued onto the slitlet block. Given, that the v-grooves are 100 times longer than a fiber diameter, and manufacturing tolerances of 0.01 mm were achieved, the alignment and the end positioning of the fibers was done to within a few microns accuracy. Altogether, twelve slitlets, each carrying 31 or 32 fibers each, were mounted side-by-side on a common stage, creating a fiber-slit of 94 mm length in total. The slitlets can be moved and locked individually. In this way, any length variations between slitlets are irrelevant, as each slitlet can be brought forward, until the fibers touch the collimator lens surface. The overall unit includes mounts for the cables, the fiber-slit and the collimator lens as well as protective covers (Fig. 9, left).
The fibers were repeatedly cleaned with methanol and water in an ultra-sonic bath prior and after the assembly, to remove any contamination from the surfaces. The quality was controlled by inspections of the fiber ends using a video microscope. Illumination of individual fibers yielded their positions within each slitlet, and the fibers were labeled according to a pre-defined position table (see Fig. 7).
3.4 Fiber-Head Assembly
At the input (i.e. the IFU) side, the individually labeled object and buffer fibers were ordered and pre-assembled row-by-row on a piece of sticky tape. No additional glue was applied at this stage. A mount was manufactured at the AIP workshop, that features a central hexagonal opening, with precision steps to aid the correct fiber alignment. The milling precision was on the order of 1/100 mm (=5% of a fiber diameter), which was more than adequate to ensure, that the fibers form a dense-packed arrangement. The main IFU was built up by inserting each row of fibers (27 rows in total), into the hexagonal mount, with the fibers extending 5 mm beyond the mount surface. For practical reasons, this was done separately for the two halves (see Fig. 10), which were put together and locked mechanically thereafter. In fact, not the precision of the mount, but the added tolerance of the sizes of the overall number of fibers limited the correct alignment. The maximum deviation from a regular hexagonal grid occurs for one outermost row and was measured to be of the order of 10% of a fiber diameter, corresponding to a misalignment of approximately 0.3 arcsec.
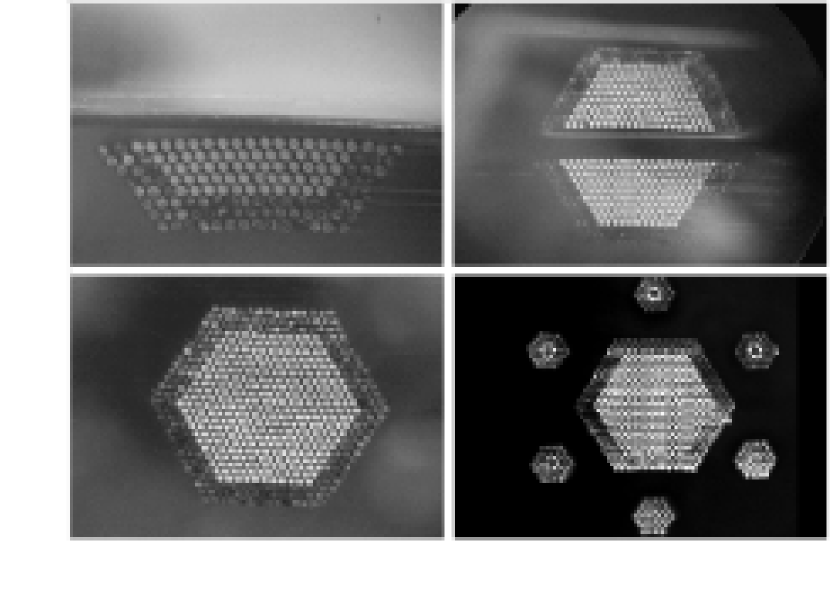
Six additional circular drillings around the central opening accommodate the sky-fiber IFUs. The assembly of the sky-IFUs worked similar with respect to the row-by-row approach. Each sky-IFU consists of 6 sky and 31 short buffer fibers (Fig. 5), which form a densest pack of 7 fibers across. This was inserted into a steel ferule with a matching inner diameter of 1.4 mm. Subsequently, the ferules were glued into the drillings of the mount (Fig. 11, left). After assembly, the IFU-mount was pointed downward and the extending fibers were immersed in a bath of epoxy which worked its way upward in-between the fibers and through the mount by means of capillary force. In this way, the fibers are glued together and to the metal mount without introducing additional stress. After the epoxy had cured, the entire fiber head, including the six sky-IFUs, was polished using a custom-made polishing stage (as described in Kelz et al. 2004). Polishing sheets from Newport and Data Optics, featuring grain sizes from 30 to 0.3 m were used. The surface quality was inspected regularly during the polishing process using a video microscope with 4–16 times magnification (Fig. 11, right). This allowed the projection of highly magnified fiber images onto a monitor. In conjunction with a variety of viewing angles and illuminations, scratches at the order of 1 micron were visible and could be polished out. The end requirements were, to have no obvious surface defects, such as partial breakages of core or cladding material, no scratches larger than 1% of the fiber diameter (1.5 m), and a visually flat and perpendicular endface.
3.5 Integration of PPak into PMAS
Optical gel (code 0406, n=1.46) from Cargille Laboratory was applied between the spectrograph collimator lens and the fiber-slit(s) to match the refractive indices. The loop-box was filled and closed (see Fig. 12), and all 13 PPak-cables inserted into a common flexure tube. Inspections revealed that no fibers were broken or damaged during the process of manufacture, assembly and integration.
During the construction and initial commissioning, the PPak bundle was an entity from end to end. This implied, that the existing lens-array fiber-module needed to be dis-mounted from the PMAS instrument, to make space for the PPak-module. As this is a time-consuming and potentially hazardous undertaking, both fiber modules, i.e. the fiber-slits and loop-boxes, were merged into a single unit (called double-IFU) in October 2004. The double-slit consists of two parallel rows, featuring the 256 lens-array fibers and the 382 PPak fibers (see Fig. 13). The spacing between the slits is approximately 2 mm. The fore-optics and the two IFUs remain physically separate units. While both IFUs can not be used simultaneously, it is easy and safe to change the configuration during daytime. A change of modes between the lens-array-IFU and the PPak-IFU involves a hardware switch to select a different shutter, to reconnect the internal lamps to the respective calibration units, and to cover the IFU that is not in use.
4 Operations
4.1 Calibration
While the entire lens-array-IFU can be illuminated from a deployable internal calibration unit, the position of the PPak-IFU, being off-axis and in front of the telescope focal plane, is outside the opto-mechanical range of the original calibration unit. Instead, PPak calibrations must be performed with dome or sky flatfield exposures. Flatfield exposures with external light sources (continuum, arc lamps) yield the fiber-to-fiber responses, the wavelength calibration, and the position information required for the purpose of accurately tracing and subsequently extracting the spectra from a recorded image. These calibration images should be obtained at least once per night and for each grating setting.
The best spectrograph focus is found by illuminating the calibration fibers only, using the internal spectral line lamps. This will yield well separated emission spots across the entire CCD chip. Preferable, the calibration fibers should always be illuminated by a spectral line lamp while a science exposure is taken. This allows the tracing of any image shifts or spectrograph de-focus during the data reduction for each science frame (see Fig. 14).
4.2 Instrument Control Software
The AG-OPTICS system for acquisition and guiding has been described in paper I. As opposed to the lens-array-IFU, which is positioned at the center of the A&G field-of-view (of 3′.2 3′.2), the PPak-IFU is located off-axis, 295′′ to the South and 206′′ to the West. Since the offset is known to the instrument control software, the basic functionality for field acquisition and guiding remains unchanged. The A&G instrument control software (pics_ag) has an option to over-plot the PPak outline or even the position of the 331 fibers to a freshly obtained acquisition frame and allows for an offset pointing to center the object of interest onto the PPak-IFU. The position of a guiding box around a guide-star on the A&G frame can be stored and recalled. This allows for the accurate re-positioning of a guide-star on subsequent nights to within 0.2 arcseconds. Note, that this procedure has been successfully applied using the finer sampling lens-array IFU, which, due to its distance, is more likely subject to relative flexure, than the closely mounted PPak unit (see Fig. 1).
The IDL-based PMAS Instrument Control Software (PICS) includes some additional features for PPak operations, namely the option to include calibration light within the science frames (e.g. 5 10 seconds of ThAr distributed equally within an overall exposure time of 30 minutes, say) and to center, offset or mosaic-point the PPak-IFU.
Note, that the nod-and-shuffle (or beam switching) mode, that is available for the lens-array-IFU, is possible with PPak too, but at the expense of a higher cross-talk, as the spacing between the PPak spectra on the detector is smaller.
4.3 Data Reduction Software
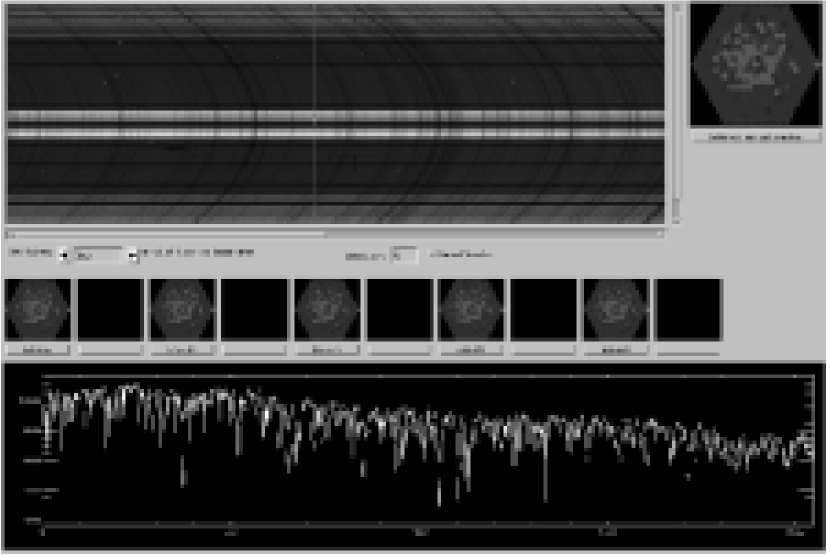
Based on the “P3d” data reduction software package (Becker 2002, see paper I), an adapted version for PPak (PPAK_online) was written by T.B. The program can be used for a quick-look inspection of the data quality and for a reconstruction of maps, while observing at the telescope. The code is written in IDL and allows to process the raw data and to eliminate the specific instrumental signature. The subroutines include: bias and dark subtraction, cosmic cleaning, spectra tracing, flexure compensation, spectra extraction, flat-fielding, and wavelength calibration. The full P3d package also allows a CCD pixel-to-pixel response variation, stray-light modeling, and wavelength-dependent fiber response calibration. There are also various custom-made IDL utilities for the visualization of stacked spectra, maps, and individual (or co-added) spectra (see Fig. 15). These utilities are available within GUIs and from the IDL command line, supporting the use of scripts. It is also possible to call the E3D visualization tool from within PPAK_online, providing further features, such as interpolated maps, line fitting, etc (see Sánchez 2004, Sánchez et al. 2004). Also, PPak data was successfully reduced, using the hydra package within IRAF.
5 Performance
5.1 Throughput
The instrumental throughput was obtained using two methods. Firstly, the observed flux of spectrophotometric standard stars was compared to tabulated values from the literature. Secondly, the relative throughput of domeflat exposures for the lens-array-IFU and the PPak-IFU was determined. The reason for the second approach is, that often the actual atmospheric conditions at Calar Alto are either non-photometric or not known well enough, as to determine the true instrumental response unambiguously. However, the instrumental efficiency using the lens-array-IFU was well established previously (see paper I), and therefore a relative response measurement can yield the PPak-throughput.
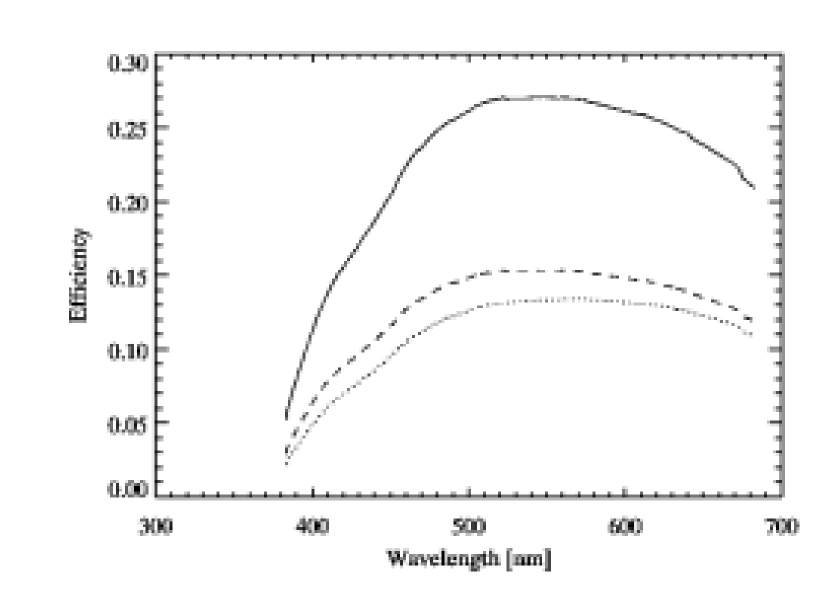
Fig. 16 plots the directly measured PMAS+PPak efficiency. The lower (dotted) curve gives the total throughput, from top of the atmosphere to the detector. It was obtained by comparing the flux of the spectrophotometric standard star BD +75 325, observed on Nov. 20, 2004 at an airmass of 1.3, to the expected flux as given by Oke (1990). This total efficiency includes the instrument , the atmosphere , and the telescope . The middle (dashed) curve represents the efficiency from top of the telescope to the detector, i.e. taking atmospheric extinction and airmass into account. The atmospheric extinction coefficients for each wavelength were calculated by scaling typical extinction tables for Calar Alto (Hopp & Fernandez 2001) to =0.14 mag and =0.85, which was the measured extinction in the V-band during the night. The top (solid) curve is the pure instrumental throughput , from the telescope focal plane to the detector. The instrumental configuration included the PPak-IFU without any filters and the spectrograph with the V300 grating in 1st order (300 l/mm, blaze angle=4.3∘, =16∘, =542 nm). The throughput of the primary mirror was derived from reflectivity measurements obtained routinely at Calar Alto111http://dbserv.caha.es/iris/index.asp. Assuming a similar value of 75% for the secondary reflectivity, the telescope efficiency was estimated to be =0.57 in V at the time of observation.
Note, that the plots in Fig. 16 present lower limits in that the flux lost outside the finite aperture of a single fiber was neglected. Applying an aperture correction (along the lines of CCD aperture photometry techniques, e.g. Howell 1989) based on the measured seeing FWHM of 1′′.1 in V, and assuming a Gaussian approximation to the point-spread-function, we estimate a correction factor of 1.15, i.e. a peak efficiency of 31%.
This value agrees reasonably well with the comparison of domeflat exposures, taken with both the lens-array and the PPak-IFU, while the spectrograph setup, using a V300 grating, remained unchanged. The PPak configuration was found to have a 1.5 times higher throughput, than the lens-array-IFU, resulting in a peak efficiency of 30% rather than 20%, respectively. As the coupling of both fiber-slits towards the spectrograph is similar and the length differences between the lens-array and PPak-fibers is only 1.5 m, we attribute this difference in efficiency to the fore-optics and input coupling in particular. As shown in § 4.3 of paper I, the lens-array IFU throughput suffers from two effects: firstly from light losses caused by the extended parts of the lens-array PSFs (i.e. stray light and diffraction spikes) and secondly from the median mis-alignment between the micro-pupil images and the fiber cores. Both these problems are not present in the PPak-design, so that a bare fiber-bundle fed by a large fore-optics lens is more efficient.
Instrumental throughput estimates for other PMAS gratings were bootstrapped from the lens-array-IFU efficiency data as shown in Fig. 15 of paper I. Using a grating blazed in R (600 l/mm, blaze angle=13.9∘, =530–810 nm), the instrumental efficiency peaks at 36% between 600–700 nm. Note, that the PPak configuration has not been optimized in the blue and that both the image quality of the focal reducer lens, and the transmission of the fibers and the lenses rapidly decrease below 400 nm. The groove density of the gratings (e.g. 300, 600 or 1200 l/mm) only has a minor effect on the efficiency. Those gratings, which are in use in 2nd order (I1200, J1200), show a significantly lower efficiency due to intrinsic grating effects and a geometrical overfill of the grating at large tilt angles (see § 5.4).
5.2 Fiber Response and Cross-talk
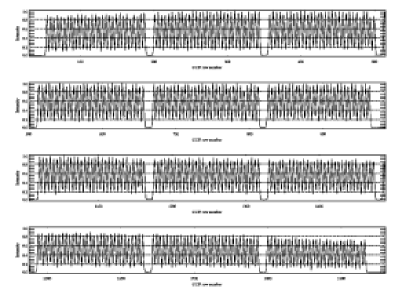
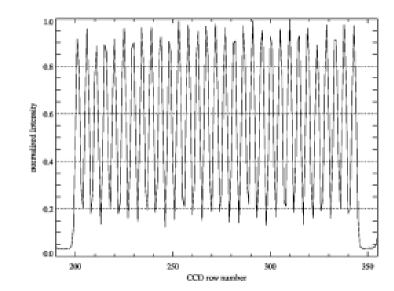
Visual inspection of the either forward or backward illuminated fiber bundle yielded a apparent uniform fiber response across the slit and the IFU, respectively. This was confirmed by sky- and domeflat exposures taken at the telescope. Fig. 17 shows a cross-dispersion cut, roughly at 500 nm, through a raw domeflat exposure with the illuminated 331 ‘object’ and 36 ‘sky’ fibers. The vignetting of the spectrograph optics towards the edges and the degree of flatness of the fiber-to-fiber response can be judged from this plot. Note, that there is an overall slope in the intensity level, which is believed to result from two effects: the slit is not perfectly centered on the optical axis of the spectrograph and the undersized flatfield screen in the dome, does in fact not provide a uniform and flat illumination across the field. Fig. 18 is a zoomed version of the previous, showing a central slitlet only. The maxima of the normalized intensities range between 0.89 and 0.98. In zero-th order, the fiber core projects to 6 pixels on the CCD. The pitch between individual fibers is 9.4 pixels, resulting in moderate cross-talk and a typical inter-order minimum intensity of 20% of the peak level.
The final amount of cross-talk does not only depend on the instrumental performance, but also on the actual data reduction. A profile-fitting extraction method is capable to allocate the overlapping wings of the flux distribution towards the individual spectra. In this way, cross-talk can be dis-entangled better, than using an extraction scheme with fixed pixel numbers (see Becker, 2002). Apart from spectra extraction, other parameters, such as the option to use on-chip binning in the spatial direction, or the (sagittal and tangential) focus setting of the spectrograph, will result in different levels of cross-talk. If these are of concern and what level is acceptable, will depend on the particular science case.
5.3 Scattered Light
Scattered light effects are mainly depending on the selected grating, wavelength range and order, i.e. the grating position. In particular, ghost images were noticed at certain second order wavelength settings, where the grating is overfilled and its mount is highly inclined towards the incoming beam. The exact origin of these ghost images is subject of further investigation.
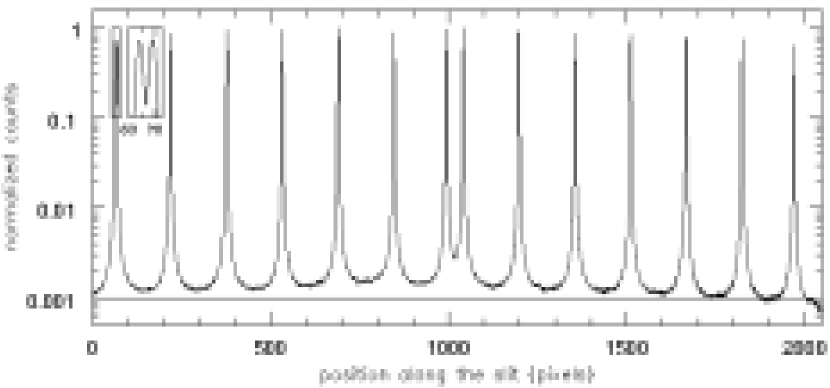
In addition to ghost images, most complex optical systems show extended wings of the point-spread-function at low intensity levels, which are generally attributed to “scattered light”, although the precise physical origin of this “halo” around the PSF core is difficult to assess. The relatively large separation of the PPak calibration fibers presented us with the opportunity to obtain high signal-to-noise cross-dispersion profiles from well-exposed continuum lamp calibration exposures, and map the scattered light level as illustrated in Fig. 19. The overlapping individual scattered light halos from these calibration spectra generate a level of 0.1% of the peak counts in the areas in between these spectra. Despite the fact, that these light levels are low, they can contaminate the neighboring spectra, depending on the exact method of spectra extraction. Using a box-like extraction, with a width of 10 fiber-pitches to both sides, around a single, illuminated spectrum, the contribution from the integrated scattered light, can be on the order of 8–14%. This value highly depends on the assumed width of a spectrum, the position of the spectrum on the chip and the wavelength.
Becker (2002) has implemented in the P3d data reduction package a profile-fitting extraction method, which is based on empirically determined cross-dispersion profiles as a function of wavelength for each spectrum, which is, however, presently only available for data obtained with the PMAS lens-array IFU. The iterative scheme of this code is capable of (1) measuring and eliminating the crosstalk between adjacent spectra (on the order of 0.5% for the lens-array), and (2) simultaneously solving for a model of diffuse scattered light over the face of the detector (less than 1% of the average peak intensity). While this level was considered negligible for normal PMAS data, the application of the scattered light model to data from the MPFS instrument at the Selentchuk 6m Telescope, which does have significant stray-light patterns, proved to be essential to eliminate systematic errors (Becker 2002). Implementing a profile fitting extraction routine for PPak data, as well as a thorough characterization of cross-talk and stray-light properties for the various grating setups at different grating tilts is a goal with a future upgraded version of the P3d software.
5.4 Usage in the Second Spectral Order
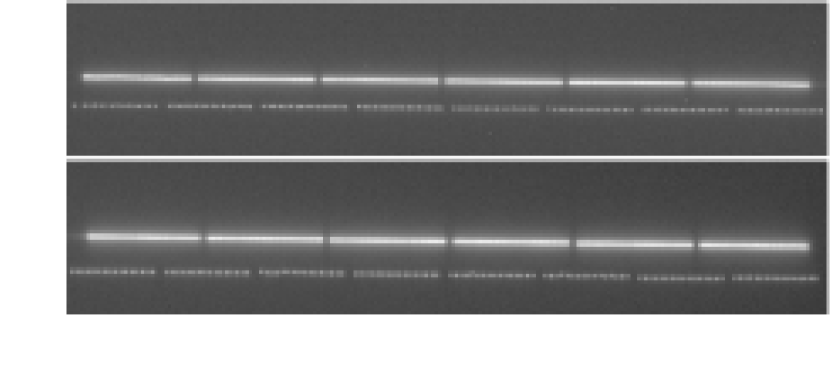
PMAS was initially designed and built as a spectrophotometer for low/medium spectral resolution, with the goal to maximize wavelength coverage rather than spectral resolution. More recently, the main science driver for retrofitting PMAS with the PPak-IFU demanded R8000 (Verheijen et al. 2004), which could not be satisfied with the current fiber size (i.e. pseudo-slit-width) and any of the standard gratings in 1st order. A test with two gratings in 2nd order (I1200: blaze angle=37∘, 1200 l/mm and J1200: blaze angle=46∘, 1200 l/mm), however, yielded satisfactory results in the wavelength region near 520 nm. Fig. 20 illustrates that not only the roughly two-fold increase of linear dispersion, but also the effect of anamorphic demagnification helps to improve the spectral resolution (e.g. Schweizer 1979). Considering the basic grating equation: , where and are the angles between the grating normal and the incident and diffracted beams, respectively, is the spectral order, the groove density in [l/mm], and the wavelength, the anamorphic (de)magnification of the slit width is given by: .
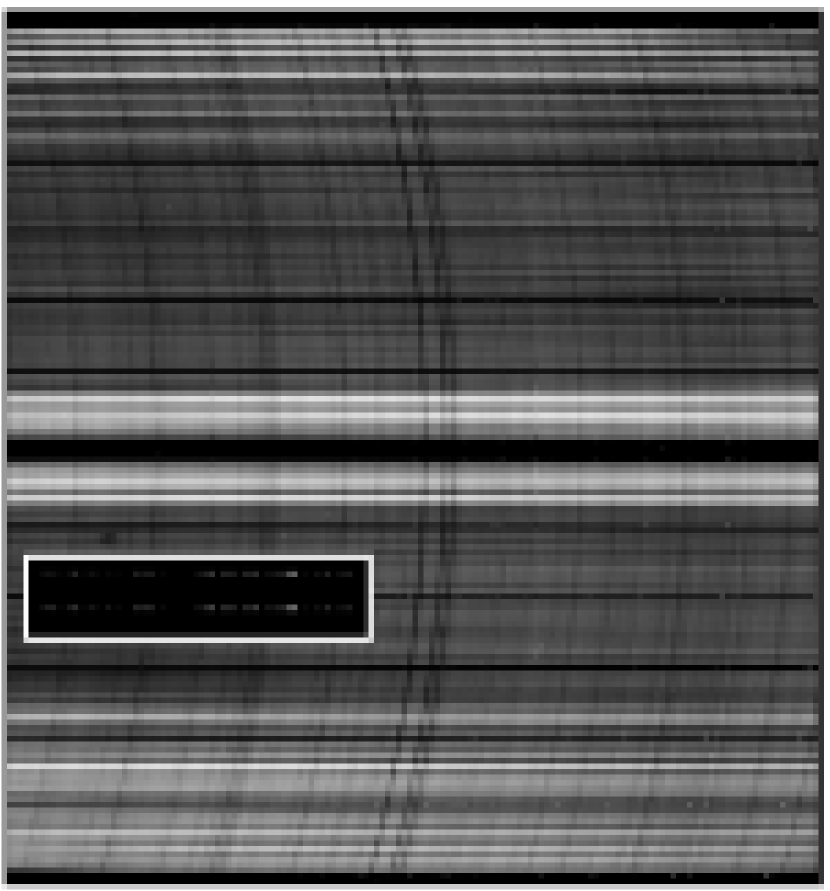
For a typical setup in first order, is close to unity, and the effect is often negligible. In second order, however, the grating tilt is more extreme so that becomes significantly different from 1. The upper panel of Fig. 20 shows a small central region of a raw CCD frame from a sky flatfield exposure which was taken on Nov. 8, 2004, using the V600 grating in 1st order with a grating tilt of =15∘. The anamorphic magnification of this setup is =1.08. Therefore, the two rows of calibration spectra with ThAr emission lines present a close to perfect round spot appearance. The corresponding plot with emission line profiles reveals a FWHM of 3 pixels (from a 2x2 binned CCD frame), matching exactly the expected width of 6 unbinned pixels.
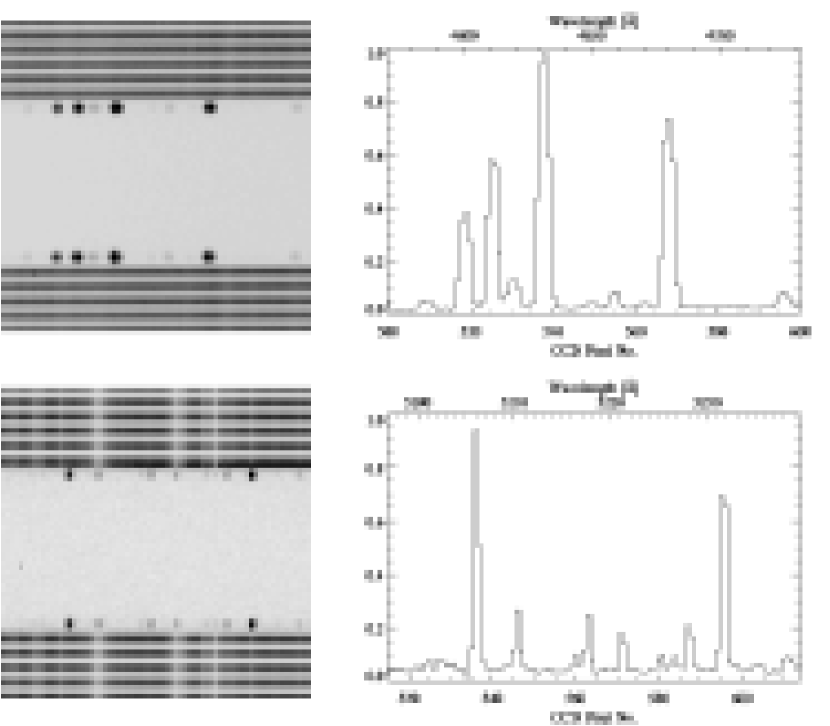
The lower panel shows the same situation for a setup with the J1200 grating in second order, mounted in the “backward” orientation (see paper I), i.e. the grating normal facing the camera, and a grating tilt of =63∘. This sky flatfield exposure was obtained on May 4, 2005. In contrast to the V600 exposure from above, the emission line spots are now significantly compressed in the dispersion direction, and the line profiles are extremely sharp with a FWHM of 1.5 pixels (2x binned). The anamorphic magnification is =0.49. The resolving power obtained in this configuration with the 150 m PPak fibers is R7900. Note, that in order to maintain sharp images and this relatively high spectral resolution, careful focusing, restriction of exposure times, and the avoidance of hour angles with adverse flexure effects (see paper I) are of utmost importance.
The usage of the high-resolution mode comes at the expense of a lower throughput. Table 4 lists the relative efficiencies (in ADU/s/Å) of the I1200 and J1200 gratings in second order, forward (fwd) and backward (bwd) oriented, respectively, with reference to the V1200 grating in first order.
| Grating | Blaze[∘] | [∘] | |||
|---|---|---|---|---|---|
| V600 (fwd) | 8.6 | 1st | 11.5 | 1.14 | 100 |
| V1200 (fwd) | 17.5 | 1st | 1.7 | 1.31 | 100 |
| V1200 (bwd) | 17.5 | 1st | 40.3 | 0.76 | 95 |
| I1200 (fwd) | 36.8 | 2nd | 20.5 | 2.03 | 40 |
| I1200 (bwd) | 36.8 | 2nd | 62.5 | 0.49 | 55 |
| J1200 (fwd) | 46.0 | 2nd | 20.5 | 2.03 | 52 |
| J1200 (bwd) | 46.0 | 2nd | 62.5 | 0.49 | 70 |
6 Summary
A new Integral-Field-Unit, based on the fiber-bundle technique, providing high grasp and a large field was developed and successfully commissioned for the existing PMAS 3D-instrument. The central PPak-IFU features 331 object-fibers, which, projected by the 3.5 m Calar Alto telescope, span a hexagonal field-of-view of 7464 arcseconds with a filling factor of 60%. The individual spaxel (fiber) size is 2′′.7 across, yielding a total grasp of 15200 arcsec2m2 at this telescope. An additional 36 fibers are distributed over six sky-IFUs, which surround the main IFU at a distance of 72′′ from the field center, allowing a good coverage and subtraction of the sky background. For calibration purposes, 15 fibers can be illuminated independently with arc lamps during a science exposure, and can keep track of spectral resolution and image shifts. A summary of the technical parameters is given in Table 5. Further details regarding the PMAS spectrograph, available gratings and filters are given in paper I, or can be found online222http://www.caha.es/pmas.
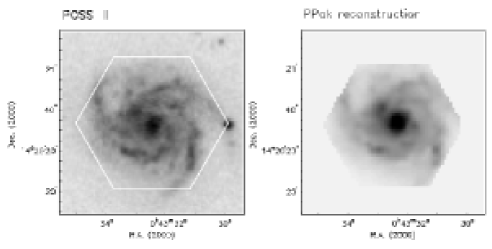
The combination of spaxels with high grasp and the PMAS spectrograph with high efficiency and wide wavelength coverage, makes PPak a powerful tool for the study of extended low-surface brightness objects, which require a high light collecting power and a large field-of-view. Fig. 21, gives an example of the galaxy UGC 463, that was observed for the Disk Mass project. Despite the rather crude sampling of the fibers, the basic morphological structures of the galaxy seen in the POSS-II image (spiral arms, stars clumps…), are clearly visible in the PPAK reconstructed image. Apart from the ability to create mono- and polychromatic images from the resulting data, one exposure with PPak yields 331 spatially resolved spectra of the target. The high number of fibers at the outer and fainter parts of the galaxy, offers the observer the option to adaptively bin spaxels as to increase the signal-to-noise further.
During 2004, PPak was available on a shared-risk basis, as its usage involved a complex change-over between the lens-array and PPak fibers, which needed to be done by AIP staff. With the integration of the two parallel fiber-slits, the PPak-IFU was permanently installed and is offered as common-user instrument from 2005 onwards. Two further upgrades are scheduled: a new mount to ease the exchange of order separating filters, and adjustments to the PPak data reduction software. Since commissioning, PPak attracted considerable interest from several observers, with the result, that 9 observing runs with a total of 26 nights, plus 9 ‘service buffer A’ nights, were granted to PMAS-PPAK within its first year by the Calar Alto TAC. In 2005, approximately 50% of the allocated time for PMAS is used with the PPak-IFU. Throughout these runs, the PPak module worked without failure.
| PPak-IFU: | |
|---|---|
| principle design | focal reducer + fiber-bundle |
| focal reducer lens | F/10 to F/3.3, dia=50 mm |
| plate-scale | /mm |
| fiber configuration | 331 object, 36 sky, 15 calibration |
| PPak - FoV | (hexagonal packed) |
| spatial sampling | per fiber diameter |
| fiber pitch | fiber-to-fiber |
| IFU-filter | 2 inch / 50 mm round filter |
| PPCU-filter | 1 inch / 25 mm round filter |
| wavelength range | 400–900 nm (‘dry’ fibers) |
| PMAS spectrograph: | |
| PPak fiber slit | 0.15 94 mm, 382 fibers |
| slit-filter | 140 35 mm filter |
| collimator | fully refractive 450 mm, F/3 |
| camera | fully refractive 270 mm, F/1.5 |
| reflective gratings | 1200, 600 and 300 l/mm |
| detector | SITe 2k 4k, 15 pixels |
| linear dispersion | 0.53, 1.2, 2.6 Å/pixel (m=1) |
| resolution | 0.3 Å/pixel, R8000 (m=2) |
| wavelength coverage | 600-3400 Å/frame (1st order) |
| 400 Å/frame (2nd order) | |
| PMAS A&G camera: | |
| A&G FoV | 3.4 3.4 arcminutes |
| A&G plate scale | 0.2 arcseconds/pixel |
| A&G-filter | 4 2 inch/50 mm round filters |
ACKNOWLEDGMENTS
The authors would like to thank Ute Tripphahn & the mechanical workshop for the realization of various components of the PPak-IFU, Thomas Hahn and Thomas Fechner (all AIP) for their help during commissioning. MV likes to thank Matthew Bershady for valuable discussions regarding design and construction issues. PPak was developed within the ULTROS project, which is funded by the German ministry of education & research (BMBF) through Verbundforschungs grant 05- AE2BAA/4. AK, MR and MV gratefully acknowledge travel support from the Deutsche Forschungsgemeinschaft (DFG). We are thankful for the excellent support we received from Calar Alto staff, in particular Nicolàs Cardiel, during the commissioning and the subsequent observing runs with PPak. Special thanks to David Lee (former AAO) for insights into aspects of the SPIRAL-B manufacture.
References
- Arribas et al. (1998b) Arribas, S., et al. 1998, ASP Conference Series, 152, 149
- Barden (1998) Barden, S. C. 1998, ASP Conference Series, 152, 14
- Barden & Wade (1988) Barden, S. C. & Wade, R. A. 1988, ASP Conference Series, 3, 113
- Becker (2002) Becker, T. 2002, PhD thesis, University of Potsdam
- Bershady et al. (2005) Bershady, M. A. Andersen, D. R. Verheijen, M. A. W. Westfall, K. B. Crawford, S. M. Swaters, R. A. 2005, ApJS, 156, 311
- Bershady et al. (2004) Bershady, M. A. Andersen, D. R. Harker, J. Ramsey, L. W. Verheijen, M. A. W. 2004, PASP, 116, 565
- Howell (1989) Howell, S. B. 1989, PASP, 101, 616
-
Hopp&Fernandez (2001)
Hopp, U., Fernandez, M. 2002,
Calar Alto Newsletter No.4,
http://www.caha.es/newsletter/news02a/hopp/paper.pdf - Kelz, Roth, & Becker (2003a) Kelz, A., Roth, M. M., Becker, T. 2003a, Proc. SPIE, 4841, 1057
- Kelz, Roth, Becker, Bauer (2003b) Kelz, A., Roth, M. M., Becker, T., Bauer, S. 2003b, Proc. SPIE, 4842, 195
- Kelz (2004) Kelz, A., Verheijen, M., Roth, M.M., Laux, U., Bauer, S. 2004, Proc. SPIE, 5492, 719
- Lee & Taylor (2000) Lee, D., Taylor, K. 2000, Proc. SPIE, 4008, 26
- LeFevre (2003) LeFevre, O., Saisse, M. Mancini, D. et al. 2003, Proc. SPIE, 4841, 1670
- Oke (1990) Oke, J. B. 1990, AJ, 99, 1621
- Parry (1990) Parry, I. R., Carrasco, E. 1990, Proc. SPIE, 1235, 702
- Ramsey (1988) Ramsey, L. W. 1988, ASP Conference Series, 3, 26
- Roth et al (2003) Roth, M. M., Laux, U., Kelz, A., Dionies, F. 2003, Proc. SPIE, 4842, 183
- Roth et al (2004) Roth, M. M., Becker, T., Kelz, A., Böhm, P. 2004, Proc. SPIE, 5492, 731
- Roth, Kelz, et al (2005) Roth, M. M., Kelz, A., Fechner, T., Hahn, T., Bauer, S., Becker, T., Böhm, P., Christensen, L., Dionies, F., Paschke, J., Popow, E., Wolter, D. 2005, PASP, 117, 620-642, and astro-ph/0502581 (paper I)
- Sanchez (2004) Sánchez, S.F. 2004, AN 325 (2), 167
- Sanchezetal (2004) Sánchez, S.F., Becker, T., Kelz, A. 2004, AN 325 (2), 171
- Schmoll et al. (2003) Schmoll, J., Roth, M. M., & Laux, U. 2003, PASP, 115, 854
- Schweizer (1979) Schweizer, F. 1979, PASP, 91, 149
- Verheijen (2004) Verheijen, M.A.W., Bershadey, M.A., Andersen, D.R., Swaters, R.A., Westfall, K., Kelz, A., Roth, M.M. 2004, AN 325 (2), 151