Dynamical Region Evolution in Turbulent Molecular Clouds
Abstract
We present numerical radiation-hydrodynamic simulations of the evolution of regions formed in an inhomogeneous medium resulting from turbulence simulations. We find that the filamentary structure of the underlying density distribution produces a highly irregular shape for the ionized region, in which the ionization front escapes to large distances in some directions within 80,000 years. In other directions, on the other hand, neutral gas in the form of dense globules persists within 1 parsec of the central star for the full duration of our simulation (400,000 years). Divergent photoablation flows from these globules maintain a root-mean-squared velocity in the ionized gas that is close to the ionized sound speed. Simulated images in optical emission lines show morphologies that are in strikingly detailed agreement with those observed in real regions.
Subject headings:
regions — ISM: clouds — ISM: kinematics and dynamics — stars:formation — turbulence1. Introduction
The currently accepted view of the interstellar medium (ISM) is that its density and velocity distributions are shaped by turbulence (see, e.g. Vázquez-Semadeni et al., 2000; Elmegreen & Scalo, 2004). In the molecular clouds that will constitute the sites of star formation, the ISM turbulence is supersonic, with turbulent Mach numbers as large as 10 or more (Larson, 1981). Such high Mach numbers indicate that the medium is highly compressible. The efficiency of the star formation process is known to be small from observations, at most 10%–30% for cluster-forming cores (Lada & Lada, 2003). In numerical simulations of supersonic turbulent media, large-amplitude density fluctuations are generated, which may become locally gravitationally unstable and collapse to form stars.
Once a massive star forms, it will photoionize its surroundings, forming an region. Observed regions display a wide variety of morphologies and sizes and are generally irregular. While still embedded in their natal molecular clouds, regions remain small and are classified as ultracompact (linear size pc) or compact (0.1–1 pc) (Wood & Churchwell, 1989). Extended regions (size pc) are thought to correspond to more evolved states. The formation of regions and the propagation of ionization fronts in uniform media has been well studied (Strömgren, 1939; Kahn, 1954). The expansion of regions in power-law and plane-parallel density distributions, and the breakout of ionized gas from dense clouds into a low density medium has also been investigated (Tenorio-Tagle, 1979; Bedijn & Tenorio-Tagle, 1981; Franco et al., 1989, 1990; Henney et al., 2005a; Arthur & Hoare, 2006). These models all assume a smooth density variation and do not give rise to the irregular complex shapes exhibited by real regions (Henney, 2006).
It has been suggested that the irregular shapes of observed regions, including the “fingers” and “elephant trunks” seen in regions such as M16 (see, e.g., Hester et al., 1996), are due to instabilities in the ionization front. When cooling is included in radiation-hydrodynamical simulations of region expansion, a strong instability, predicted analytically by Giuliani (1979), leads to vigorous fragmentation of the expanding massive shell (García-Segura & Franco, 1996). When small-scale density fluctuations are present in the ambient medium, Williams (1999) shows that a shadowing instability in the R-type ionization front phase can lead to a non-linear hydrodynamic instability and the formation of clumps in the D-type phase. The clumps and filaments formed by such instabilities tend to be radial in nature, and thus do not account for observed structures such as the Orion bar, which has a linear appearance, perpendicular to the direction to the ionizing star.
It is entirely possible that the irregular appearance of observed regions is due not to instabilities in the ionization front but to underlying structure in the ambient medium. Li et al. (2004) calculated the propagation of the R-type ionization front produced by a massive star in a precomputed three-dimensional compressible turbulent density field. Their results show that the initial density structure is important for the resulting structure of the region. However, these calculations do not include hydrodynamics and therefore cannot follow the subsequent dynamical expansion of the ionized gas into the surrounding turbulent medium after the initial yrs. More recently, Dale et al. (2005) have presented smooth-particle-hydrodynamic simulations of the development of an region around a newly-formed star cluster. These simulations do follow the dynamical expansion of the ionized gas in a highly clumped medium and its feedback on the star formation process, but the initial density field is specified in a somewhat ad hoc manner.
In this article we present results from the first fully coupled, radiation-hydrodynamic simulations of the formation and expansion of regions in a turbulent medium. As our starting point, we take a precomputed three-dimensional compressible turbulent density field calculated by Vázquez-Semadeni et al. (2005). In § 2 we describe our numerical method and the initial conditions. Our results are presented in § 3 in a form directly comparable to observations. In § 4 we summarize and conclude our findings.
2. Simulations
2.1. Numerical Method
The hydrodynamics is calculated using the non-relativistic scheme described in Eulderink & Mellema (1995), with the addition of a Local Oscillation Filter (Sutherland et al., 2003) to suppress numerical odd-even decoupling behind radiatively cooling shock waves. For the radiative transfer, we implement the new, efficient C2-Ray method, described by Mellema et al. (2006), which is explicitly photon conserving. The C2-Ray algorithm uses an analytical relaxation solution for the ionization rate equations, which allows for time steps much larger than the characteristic ionization timescales and the timescale for the ionization front to cross a numerical grid cell. This efficiency allowed us, in another current application, to use this code to perform the first large-scale simulations of the reionization of the universe, which required solving for the radiative feedback of up to tens of thousands of sources on 2003–4003 computational grids (Iliev et al., 2006a). The radiative transfer is coupled to the hydrodynamics via operator splitting and tests of the combined numerical method are presented in Iliev et al. (2006b, c).111Details of the test problems can be found at http://www.mpa-garching.mpg.de/tsu3/. These features make the current problem of three-dimensional region expansion in a turbulent medium entirely tractable, and reduce the computational time for the simulations to a few hours for a grid on a single processor. The simulations presented in this paper are for a single, fixed grid since the radiative transfer algorithm is parallelized only for shared-memory machines.
2.2. Initial Conditions
As initial conditions for the density and velocity fields we take the three-dimensional numerical simulations of driven turbulence presented by Vázquez-Semadeni et al. (2005). These turbulence models are isothermal but once included in our simulations the gas is subject to heating due to photoionization, and cooling, calculated as in Raga et al. (1999). We use the simulations with root-mean-squared (rms) sonic Mach number , which give a large dynamic range for the initial density fluctuations. Vázquez-Semadeni et al. (2005) present both ideal-magnetohydrodynamics (MHD) and nonmagnetic cases but we have chosen a nonmagnetic simulation for the present paper because our hydrodynamics scheme does not include MHD. The turbulence simulations are scale free and are characterized by three nondimensional numbers: (the rms sonic Mach number, where is the turbulent velocity dispersion and is the sound speed), (the Jeans number, giving the size of the box in units of the Jeans length ), and (the ratio of thermal to magnetic pressures). In the case we consider, , , and . The turbulence calculation is time dependent and we choose a late time, when several regions are collapsing, as the initial state for the principal run of our radiation-hydrodynamics simulation.
The scaling to physical variables we choose is that used by Vázquez-Semadeni et al. (2005), that is, isothermal sound speed km s-1 and mean nucleon number density222The original simulation used molecular gas with mean molecular mass and number density 500 . Since we do not treat the dissociation of molecular hydrogen in our code, we have substituted atomic hydrogen with the same mass density and sound speed. Another consequence of this change is that our initial temperatures are lower, but this is of no dynamical consequence. cm-3. This gives a spatial size pc for the computational grid. We place the ionizing photon source at the center of the densest clump, which has density , and the periodic boundary conditions used for the turbulence simulation enable us to move this position to the center of the computational grid. We found that the densest clump in the turbulence simulations has a large absolute velocity, since it forms due to velocity fluctuation in the molecular gas. Consequently, it is necessary to shift the velocities of the whole grid by an amount equal to the velocity of the densest cell, in order that the densest material remains at rest in the frame of the star. For the ionizing source, we choose a stellar ionizing photon rate s-1 and effective temperature K, equivalent to an O7.5 main sequence star (Panagia, 1973). In order to account for the material that goes into the formation of the ionizing star, we remove 90% of the mass from the central group of cells, which corresponds to .
Although the initial turbulence simulation has periodic boundary conditions, our hydrodynamics calculation has open boundaries. This is because in cases where the photoionized region expands beyond the grid boundary, periodic boundary conditions would be unphysical. Furthermore, our calculations do not include self-gravity and our treatment of the heating and cooling of the cold neutral/molecular gas is only approximate and does not include chemistry.
3. Results
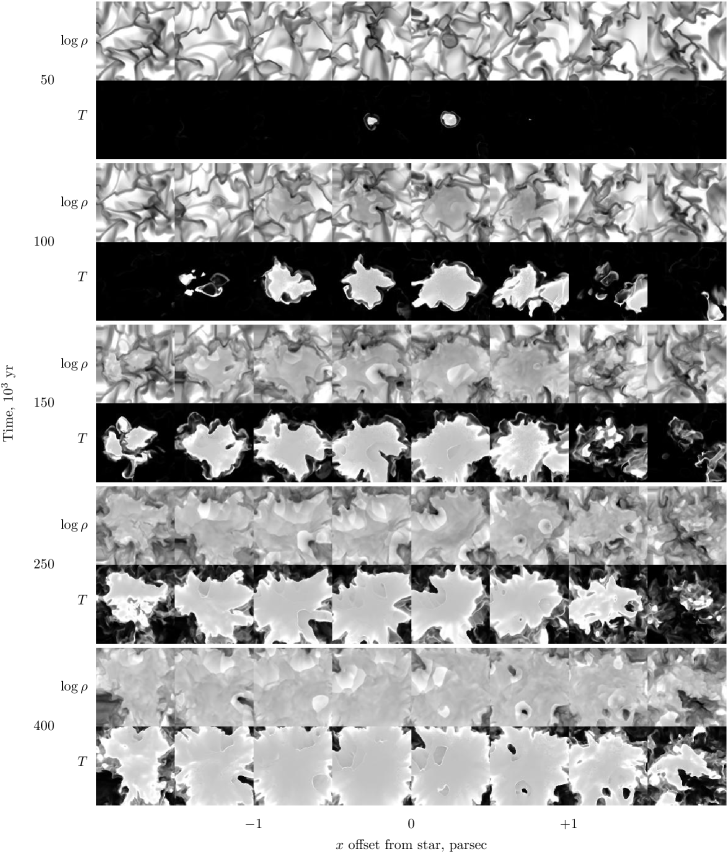
The evolution of the ionized region is illustrated in Figure 1 by means of density and temperature slices in different planes for a sequence of times. At years, the ionized gas is confined to a small volume around the star, as can best be appreciated in the temperature slices. One also sees high temperature gas behind the shock that precedes the ionization front, and which has now detached from the ionization front as it encounters lower density gas. Between the shock and the ionization front is a high density swept-up shell of neutral gas. By years, the ionized region has expanded considerably, reaching a radius of parsec in most directions and even escaping from the grid in one direction. Some dense neutral gas remains close to the ionizing star, however, which forms photoablated globules and filaments. The transonic flows from these can be seen to evacuate cavities in the ionized gas, bounded by shocks. At later times, the photoablation flows become even more prominent as more dense neutral clumps are uncovered, while existing globules are eroded and pushed away from the star by the rocket effect. By years the ionization front has escaped from the grid in most directions but some neutral gas remains as close as 1 parsec to the ionizing star. The temperature is roughly uniform in the ionized region at K, reaching slightly higher values ( K) close to the ionization front and in shocks, and slightly lower values ( K) due to expansion cooling in the photoablation flows.
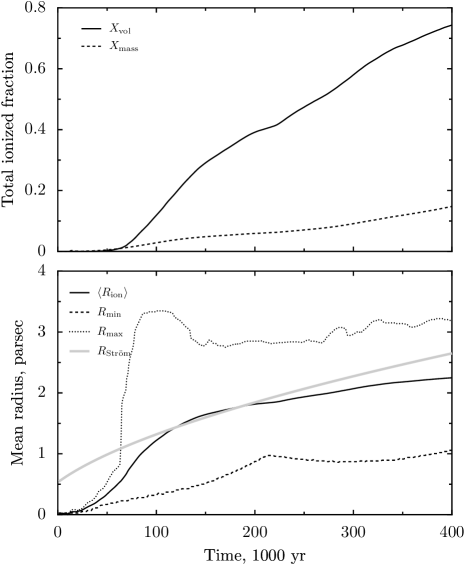
Figure 2 (top panel) shows how the ionized fractions of the total volume, , and mass, , of our simulation varies with time. Both fractions are very small for the first years of evolution, during which the ionization front remains trapped inside the dense clump in which the star formed. By the end of our simulations, over 70% of the volume of our cube has been ionized, but only 15% of the mass. However, this latter figure is only a lower limit, since it only accounts for the ionized gas that remains on the grid (see below).
The lower panel of Figure 2 shows the evolution of the mean radius of the ionization front, averaged over all directions from the ionizing source, , together with the minimum and maximum ionization front radii at each time, and , respectively. The ratio increases with time, indicating an increasingly irregular shape for the ionized region, until at years the ionization front suddenly escapes from our computational box in some directions, at which point becomes limited by the size of the grid. remains small at parsec during the entire simulation due to the survival of dense neutral clumps as discussed above. For comparison, we also show the evolution of a D-type ionization front in a uniform density medium with the same mean density as our simulations, which is given by the expression (e.g., Spitzer, 1968) , where is the ionized sound speed and parsec is the initial Strömgren radius (the initial R-type propagation of the front lasts for only years for our parameters). At early times, our radii are far below this prediction since the 1000 times overdensity at the position of the ionizing star gives an initial Strömgren radius that is 100 times smaller. By 150,000 years, the mean radius has caught up with the uniform case, at which point its expansion appears to slow, although this is probably simply an effect of the finite size of our grid. The minimum radius is always well below the uniform case and this is insensitive to the size of the grid.

Figure 3 shows the evolution of the density in our simulation. The mean density (top panel) in the ionized gas shows a dramatic decline as the region expands, whereas the mean density of the neutral gas shows a slight increase after 100,000 years due to the effects of shocks driven by the expanding ionized region. The slight decline in the mean total density towards the end of the simulation indicates that we are starting to lose mass from our grid. Although we do not track the ionization state of this gas, we expect it to be predominantly ionized, giving an upper limit to the fraction of the initial simulation mass that has been ionized by the end of the run of , as opposed to the lower limit of 15% that was derived above. The density clumping of the neutral gas (bottom panel) is initially very high due to the gravitational collapse of dense regions in the turbulence simulations but quickly falls with time as the densest region becomes photoionized and expands. The clumping of the ionized gas is much less pronounced, with not exceeding 2. However, higher order statistics indicate significant inhomogeneities in the ionized gas too, with a filling factor of during much of the evolution. This is primarily due to photoablation flows from globules, which have ionized density contrasts of 3–10 with respect to the mean, and partly due to weak shocks, which have typical density contrasts of 2–4.
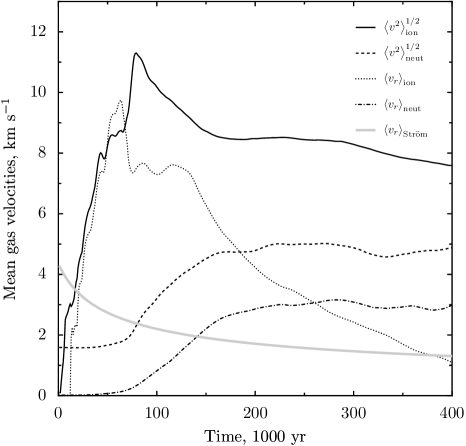
Figure 4 shows the mean gas velocities in the simulations. The one-dimensional rms velocity over the volume, , of our simulation is defined as
and the mean expansion velocity as
where is the vector gas velocity at a point, is the unit vector in the radial direction away from the ionizing star, and is the ionized or neutral fraction, as appropriate. The rms velocity of the ionized gas increases with time for the first 50,000 years until it is close to the ionized sound speed, from which point on it remains roughly constant. The rms velocity of the neutral gas remains at its initial value of for the first 100,000 years, after which it is increased to by the action of shocks driven by the expanding ionized gas. The mean neutral expansion velocity is a significant fraction of the rms velocity, indicating that the neutral gas motions are predominantly away from the ionizing star. The same is true for initial expansion of the ionized gas, but after 100,000 years the ionized expansion velocity gradually declines to only , while the rms velocity remains at . This is due to the effect of the photoablation flows from dense globules, which flow back towards the star at speeds of up to 20 and partially cancel out the general expansion of the ionized gas. The mean expansion velocity of the ionized gas in a uniform medium is equal to and is always less than half of the ionized sound speed, which is much lower than is seen in our simulation.
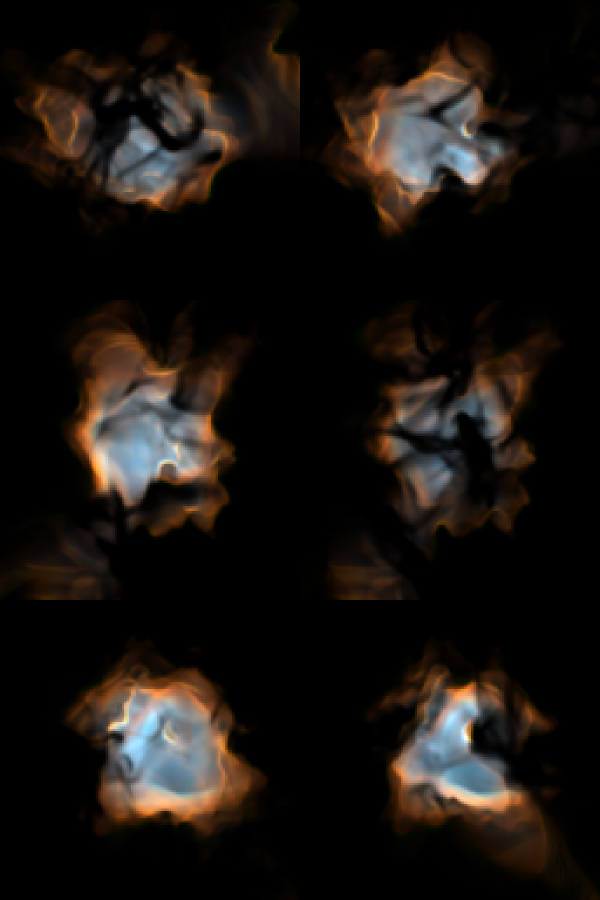
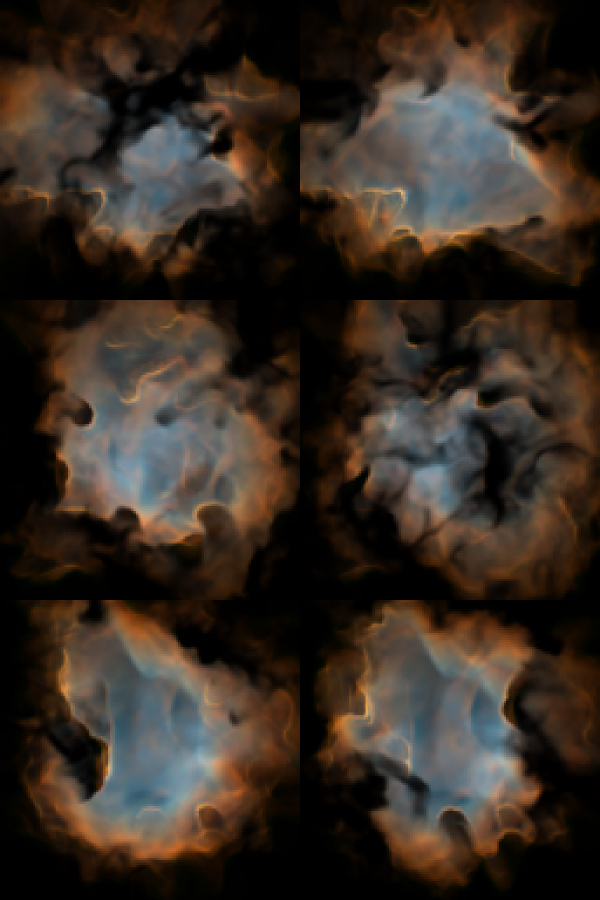
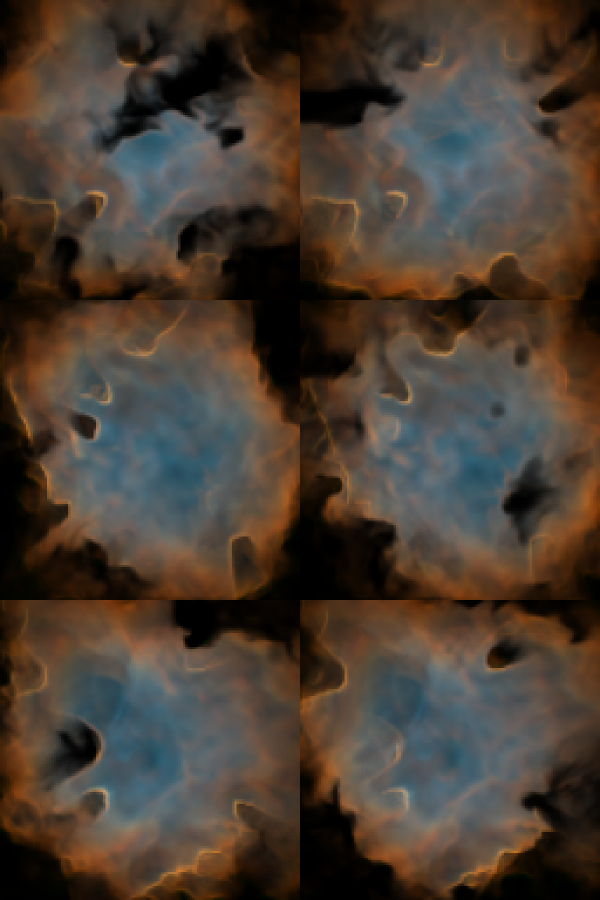
Figure 5 shows 3-color optical emission line images of our simulations at three different evolutionary times, calculated using 2-level atom approximations for the line emissivity as described in Henney et al. (2005a). The ion fractions of N and O were approximated as functions of the H ionization fraction, which were calibrated using Cloudy (Ferland, 2000). This is a reasonable approximation since departures from equilibrium ionization should be similar for all ions (Henney et al., 2005b). The images include the effects of local absorption by dust in the neutral gas, with an assumed cross section of per H nucleon (Baldwin et al., 1991) but do not include scattering. They are designed to be directly comparable with observed narrow-band emission line observations of real nebulae. In panel a, although the ionization front has already broken out in some directions, this is only where the density is very low, resulting in weak emission. Bright cusps indicate the ionization fronts at the heads of photoablated globules that protrude into the interior of the ionized region. On a larger scale, the outer border of the emission seems to consist of several roughly straight segments. This is due to the formation of cylindrical ionization fronts around filaments in the neutral density distribution. Dark lanes are due to dust absorption in dense filaments that lie outside the ionized region. As the simulation progresses (panels b and c), one sees a greater number of photoablated globules and at the same time, the overlying extinction becomes less. Shocks due to the collisions between photoablation flows produce brightness variations in the fully ionized gas.
4. Discussion and conclusions
regions around single stars are found with a variety of sizes, from ultracompact ( parsec) to extended ( parsec) and it is probable that these represent an evolutionary sequence (e.g., García-Segura & Franco, 1996). Our simulation passes through all of these phases during its evolution but, because of the physical scaling we have chosen, the initial compact phases are very poorly resolved. We therefore compare our results with the observed structure and dynamics of more evolved, extended regions. The shapes of such regions tend to be very irregular on a large scale and frequently show bright-rimmed structures on smaller scales (Pottasch, 1956), together with filamentary overlying extinction features. Many Galactic regions show strong similarities in appearance with our simulation (see especially Fig. 5), with perhaps the most striking resemblance occuring in the case of M20, the Trifid Nebula (see Rho et al., 2005). In the case of many other regions, such as the Orion Nebula (M42), and the Eagle Nebula (M16), the details of the observed emission structures are very similar to those seen in our simulations but the large-scale distributions are somewhat different. This is presumably due to density gradients on a scale equal to or larger than that of the region itself, which give rise to champagne flows that are ionization-bounded on one side (Bodenheimer et al., 1979; Tenorio-Tagle, 1979; Henney et al., 2005a; Arthur & Hoare, 2006). These are not present on our simulation, in which the density is roughly homogeneous on scales parsec, although the effects of such large-scale gradients can be clearly seen in the simulations of Dale et al. (2005). On an even larger scale, very similar emission structures are seen in giant regions, of which NGC 3603 in our Galaxy (Moffat et al., 2002) and 30 Doradus in the Large Magellanic Cloud (Scowen et al., 1998) are the best-studied examples. However, such regions are ionized by multiple stars and therefore cannot be directly compared with our simulations, although similar processes are expected to occur (Tenorio-Tagle et al., 2006).
There are hints in our simulation of a qualitative change in the morphology of the region as it evolves. At times soon after the breakout of the ionization front from the dense core, one finds photoablating structures that are predominantly cylindrical in form, oriented side-on to the flux of ionizing photons. These give rise to bar-like features in the emission maps, which are similar in appearance to the Bright Bar and other similar features found in the Orion Nebula (O’Dell & Yusef-Zadeh, 2000). At later times, the photoablating structures become more finger-like, with a spherical ablation flow from the bright tip of the finger, which points towards the ionizing star. An additional feature of the late-time evolution of our simulation is the formation of recombination fronts, which temporarily reverse the expansion of the ionized region in certain directions. These form due to collisions between ionized flows, forming dense shells that in certain circumstances are capable of trapping the ionization front. Although these recombination fronts also show finger-like irregularities, they are easily distinguished from the photoablating fingers because the ionized density does not show a maximum at the ionization front. As a result, they give soft, diffuse edges to the region in the emission maps, as opposed to the sharp edges associated with the photoablation flows.
The rms velocity of the ionized gas is remarkably constant at after the initial breakout of the ionization front from the dense core, which occurs around years. For the first years, this is driven largely by the physical expansion of the ionized core in a mode similar to the fully density-bounded champagne flows studied by Shu et al. (2002). At later times, it is the divergent photoablation flows from numerous neutral globules that maintain the rms velocity. The rms velocity of the neutral gas is also strongly affected by the ionized region, increasing to after 150,000 years, which is 2–3 times the initial turbulent value. Optical spectroscopy of regions frequently shows non-thermal linewidths of , which are roughly constant between partially ionized and fully-ionized species O’Dell (2001); O’Dell et al. (2003). This is difficult to explain in the context of regions in smooth density gradients (Henney et al., 2005a) but would be a natural consequence of our simulation.
Our simulations are only a first step towards fully self-consistent models of region evolution in realistic density distributions. Important physical processes that we have neglected include the stellar wind from the ionizing star and the radiative acceleration of dust grains, which are coupled to the gas via Coulomb collisions. Both these would tend to evacuate a central cavity in the photoionized gas. Even in smooth density distributions the effect of stellar winds on the dynamics of the ionized gas is found to be rather complex (Arthur & Hoare, 2006). The effects of magnetic fields on the ionization fronts and on the dynamics of the neutral gas (Redman et al., 1998; Williams et al., 2000; Williams & Dyson, 2001) is another area that needs to be explored, since it is possible that MHD effects partially dictate the shape of the photoablated structures (Carlqvist et al., 2003; Ryutov et al., 2005; Williams, 2006). A more realistic treatment of the diffuse ionizing field may also affect the details of the shapes of the photoablated globules but should not significantly change the dynamics. The evolution of the region on timescales longer than the 400,000 year duration of our simulation is also of interest, but would require the consideration of a larger computational domain.
In summary, we have carried out the first investigation of the hydrodynamic evolution of an region in a realistic turbulent medium. We have shown that the clumpy and filamentary structure of the underlying density distribution leads to an extremely irregular shape for the ionization front. The density structure in the ionized region is less clumped than that of the neutral gas, but nevertheless shows complex dynamical structures due to the mutual interactions between photoablation flows from neutral globules and filaments, some of which survive at close distances to the ionizing star ( parsec) throughout the evolution. The rms velocity of the ionized gas is approximately equal to the ionized sound speed () during almost the entire evolution, even at late times when the net radial expansion is very low (). The calculated emission-line morphologies of our simulation show striking similarities to the appearance of real regions.
References
- Arthur & Hoare (2006) Arthur, S. J., & Hoare, M. G. 2006, ApJ, in press (astro-ph/0511035)
- Baldwin et al. (1991) Baldwin, J. A., Ferland, G. J., Martin, P. G., Corbin, M. R., Cota, S. A., Peterson, B. M., & Slettebak, A. 1991, ApJ, 374, 580
- Bedijn & Tenorio-Tagle (1981) Bedijn, P. J., & Tenorio-Tagle, G. 1981, A&A, 98, 85
- Bodenheimer et al. (1979) Bodenheimer, P., Tenorio-Tagle, G., & Yorke, H. W. 1979, ApJ, 233, 85
- Carlqvist et al. (2003) Carlqvist, P., Gahm, G. F., & Kristen, H. 2003, A&A, 403, 399
- Dale et al. (2005) Dale, J. E., Bonnell, I. A., Clarke, C. J., & Bate, M. R. 2005, MNRAS, 358, 291
- Elmegreen & Scalo (2004) Elmegreen, B. G., & Scalo, J. 2004, ARA&A, 42, 211
- Eulderink & Mellema (1995) Eulderink, F., & Mellema, G. 1995, A&AS, 110, 587
- Ferland (2000) Ferland, G. J. 2000, Revista Mexicana de Astronomía y Astrofísica Conference Series, 9, 153
- Franco et al. (1989) Franco, J., Tenorio-Tagle, G., & Bodenheimer, P. 1989, Revista Mexicana de Astronomía y Astrofísica, 18, 65
- Franco et al. (1990) Franco, J., Tenorio-Tagle, G., & Bodenheimer, P. 1990, ApJ, 349, 126
- García-Segura & Franco (1996) García-Segura, G., & Franco, J. 1996, ApJ, 469, 171
- Giuliani (1979) Giuliani, J. L. 1979, ApJ, 233, 280
- Henney (2006) Henney, W. J. 2006, In: Diffuse Matter from Star Forming Regions to Active Galaxies: A Volume Honouring John Dyson. Eds. T. W. Harquist, J. M. Pittard, & S. A. E. G. Falle. (Dordrecht: Springer), in press (astro-ph/0602626)
- Henney et al. (2005a) Henney, W. J., Arthur, S. J., & García-Díaz, M. T. 2005, ApJ, 627, 813
- Henney et al. (2005b) Henney, W. J., Arthur, S. J., Williams, R. J. R., & Ferland, G. J. 2005, ApJ, 621, 328
- Hester et al. (1996) Hester, J. J., et al. 1996, AJ, 111, 2349
- Iliev et al. (2006a) Iliev, I. T., Mellema, G., Pen, U.-L., Merz, H., Shapiro, P. R., & Alvarez, M. A. 2006a, MNRAS, submitted (astro-ph/0512187)
- Iliev et al. (2006b) Iliev, I. T., et al. 2006b, MNRAS, submitted (astro-ph/0603199)
- Iliev et al. (2006c) Iliev, I. T., et al. 2006c, in preparation (Cosmological Radiative Transfer Code Comparison http://www.mpa-garching.mpg.de/tsu3/)
- Kahn (1954) Kahn, F. D. 1954, Bull. Astron. Inst. Netherlands, 12, 187
- Klessen et al. (2000) Klessen, R. S., Heitsch, F., & Mac Low, M.-M. 2000, ApJ, 535, 887
- Lada & Lada (2003) Lada, C. J., & Lada, E. A. 2003, ARA&A, 41, 57
- Larson (1981) Larson, R. B. 1981, MNRAS, 194, 809
- Li et al. (2004) Li, Y., Mac Low, M.-M., & Abel, T. 2004, ApJ, 610, 339
- Mellema et al. (2006) Mellema, G., Iliev, I. T., Alvarez, M. A., & Shapiro, P. R. 2006, New Astronomy, 11, 374 (astro-ph/0508416)
- Moffat et al. (2002) Moffat, A. F. J., et al. 2002, ApJ, 573, 191
- O’Dell (2001) O’Dell, C. R. 2001, ARA&A, 39, 99
- O’Dell et al. (2003) O’Dell, C. R., Peimbert, M., & Peimbert, A. 2003, AJ, 125, 2590
- O’Dell & Yusef-Zadeh (2000) O’Dell, C. R., & Yusef-Zadeh, F. 2000, AJ, 120, 382
- Panagia (1973) Panagia, N. 1973, AJ, 78, 929
- Pottasch (1956) Pottasch, S. R. 1956, Bull. Astron. Inst. Netherlands, 13, 77
- Raga et al. (1999) Raga, A. C., Mellema, G., Arthur, S. J., Binette, L., Ferruit, P., & Steffen, W. 1999, Revista Mexicana de Astronomía y Astrofísica, 35, 123
- Redman et al. (1998) Redman, M. P., Williams, R. J. R., Dyson, J. E., Hartquist, T. W., & Fernandez, B. R. 1998, A&A, 331, 1099
- Rho et al. (2005) Rho, J., Reach, W. T., Lefloch, B., & Fazio, G. 2005, In: Star Formation in the Era of Three Great Observatories, see http://www.spitzer.caltech.edu/Media/releases/ssc2005-02/ssc2005-02a.shtml
- Ryutov et al. (2005) Ryutov, D. D., Kane, J. O., Mizuta, A., Pound, M. W., & Remington, B. A. 2005, Ap&SS, 298, 183
- Scowen et al. (1998) Scowen, P. A., et al. 1998, AJ, 116, 163
- Shu et al. (2002) Shu, F. H., Lizano, S., Galli, D., Cantó, J., & Laughlin, G. 2002, ApJ, 580, 969
- Spitzer (1968) Spitzer, L. 1968, Diffuse Matter in Space, New York: Interscience
- Strömgren (1939) Strömgren, B. 1939, ApJ, 89, 526
- Sutherland et al. (2003) Sutherland, R. S., Bisset, D. K., & Bicknell, G. V. 2003, ApJS, 147, 187
- Tenorio-Tagle (1979) Tenorio-Tagle, G. 1979, A&A, 71, 59
- Tenorio-Tagle et al. (2006) Tenorio-Tagle, G., Muñoz-Tuñón, C., Pérez, E., Silich, S., & Telles, E. 2006, ApJ, in press (astro-ph/0601631)
- Vázquez-Semadeni et al. (2000) Vázquez-Semadeni, E., Ostriker, E. C., Passot, T., Gammie, C. F., & Stone, J. M. 2000, Protostars and Planets IV, 3
- Vázquez-Semadeni et al. (2003) Vázquez-Semadeni, E., Ballesteros-Paredes, J., & Klessen, R. S. 2003, ApJ, 585, L131
- Vázquez-Semadeni et al. (2005) Vázquez-Semadeni, E., Kim, J., & Ballesteros-Paredes, J. 2005, ApJ, 630, L49
- Vázquez-Semadeni et al. (2005) Vázquez-Semadeni, E., Kim, J., Shadmehri, M., & Ballesteros-Paredes, J. 2005, ApJ, 618, 344
- Williams (1999) Williams, R. J. R. 1999, MNRAS, 310, 789
- Williams (2006) Williams, R. J. R. 2006, In: Diffuse Matter from Star Forming Regions to Active Galaxies: A Volume Honouring John Dyson. Eds. T. W. Harquist, J. M. Pittard, & S. A. E. G. Falle. (Dordrecht: Springer), in press
- Williams & Dyson (2001) Williams, R. J. R., & Dyson, J. E. 2001, MNRAS, 325, 293
- Williams et al. (2000) Williams, R. J. R., Dyson, J. E., & Hartquist, T. W. 2000, MNRAS, 314, 315
- Wood & Churchwell (1989) Wood, D. O. S., & Churchwell, E. 1989, ApJS, 69, 831