X-ray Observations of Galaxies in an Off-Center Region of the Coma Cluster
Abstract
We have performed a pilot survey of an off-center region of the Coma cluster to explore the X-ray properties and Luminosity Function of normal galaxies. We present results on 13 -detected galaxies with optical photometric matches, including four spectroscopically-confirmed Coma-member galaxies. All seven spectroscopically confirmed giant Coma galaxies in this field have detections or limits consistent with low X-ray to optical flux ratios (). We do not have sufficient numbers of X-ray detected galaxies to directly measure the galaxy X-ray Luminosity Function (XLF). However, since we have a well-measured optical LF, we take this low X-ray to optical flux ratio for the 7 spectroscopically confirmed galaxies to translate the optical LF to an XLF. We find good agreement with Finoguenov et al. (2004), indicating that the X-ray emission per unit optical flux per galaxy is suppressed in clusters of galaxies, but extends this work to a specific off-center environment in the Coma cluster. Finally, we report the discovery of a region of diffuse X-ray flux which might correspond to a small group interacting with the Coma Intra-Cluster Medium (ICM).
1 Introduction
The launch of new X-ray observatories over the last few years has extended the study of X-ray emission from galaxies due to accreting binaries and hot interstellar medium (ISM) to cosmologically interesting distances. (e.g., Hornschemeier et al., 2001). Recently, the first X-ray Luminosity Function (XLF) for normal galaxies (non-AGNs) was constructed at and (Norman et al., 2004; Ptak et al., 2006) using data from the two deepest extragalactic X-ray surveys (e.g., Alexander et al., 2003). Moreover, a number of major studies from observationally complete samples (i.e., observed to some fixed luminosity sensitivity) of X-ray detected/selected normal/star-forming galaxies have revealed that X-ray emission closely traces star formation rate in galaxies (e.g., Bauer et al., 2002; Ranalli et al., 2003; Grimm et al., 2003; Georgakakis et al., 2004).
We have yet to explore galaxies in their most typical environments in the X-ray band – this is the cluster and group environment, where most of the galaxies in the current universe are found (Mulchaey et al., 2003). Also, in order to understand the X-ray properties of galaxies at relatively high redshifts, one needs a nearby control sample, with a well-known selection function. Until very recently, this was not possible as there have been relatively few complete samples of X-ray selected galaxies assembled at . Recent work using wide-field optical surveys combined with and - archival data (Georgakakis et al., 2004; Hornschemeier et al., 2005) have reached while the All-Sky Survey data are expected to provide an estimate of statistical properties of X-ray sources and their Luminosity Function (LF) in the local Universe( Mpc; Tajer et al., 2005). These surveys necessarily cover very large solid angles on the sky (several square degrees and larger) which require many pointings by the relevant X-ray missions (whose fields of view are typically 0.1-0.2 square degrees).
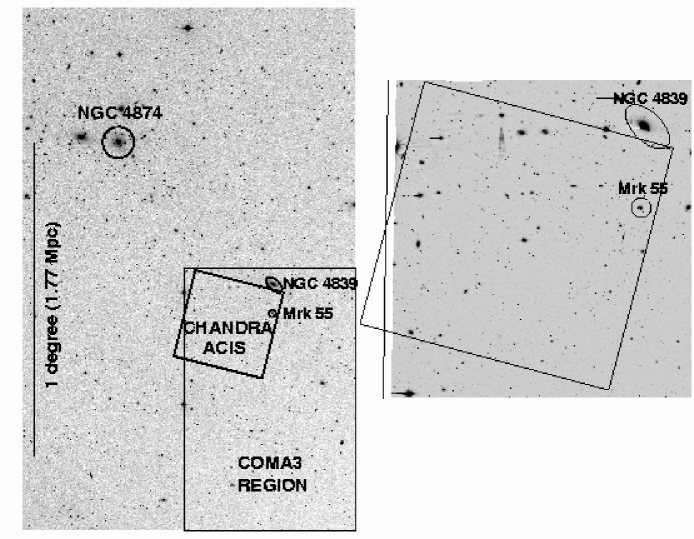
To understand X-ray properties of local galaxies, we employ a different strategy than the wider-field X-ray galaxy studies (Georgakakis et al., 2004; Hornschemeier et al., 2005; Tajer et al., 2005) by performing a pilot survey in the outskirts of the nearest rich cluster of galaxies, the Coma cluster (; Colless & Dunn, 1996). The field is located arcmin ( Mpc, virial radii) from the cluster center (see Figure 1; the virial radius is 2.9 Mpc, assuming km s-1 Mpc-1 Łokas & Mamon, 2003). We target a cluster due to the large number of galaxies, making the X-ray observations more efficient. The reason for targeting a region away from the center of Coma is the lower X-ray intracluster medium (ICM) surface brightness there. One of our main goals is to assemble the XLF for normal galaxies down to the faintest X-ray limits possible. Thus far, X-ray luminosity functions have been assembled in the field at high redshift (e.g, Norman et al., 2004; Ptak et al., 2006), for elliptical galaxies in the nearby Coma cluster of galaxies (Finoguenov et al., 2004) and in an XMM-Newton survey of 2dF/SDSS fields at (Georgantopoulos et al., 2005). is ideal for this purpose, as it allows us to unambiguously resolve the galaxies from any residual ICM background.
The observations cover approximately 20% of the full area in this part of Coma that has been under intense study. This region, and a corresponding region at the center of Coma, has extensive optical photometric and medium resolution (6–9Å) spectroscopic data for a well-defined sample of giant and dwarf galaxies (Mobasher et al., 2001; Poggianti et al., 2001). As a result, the optical LFs for galaxies at both the core and outskirts of the Coma cluster was constructed. This allows for a direct comparison between the optical and X-ray LFs established for the same field.
Recently, using the XLF for bright ellipticals (over a large area) in the Coma cluster it was shown that the X-ray emission from Coma galaxies has undergone adiabatic compression by the surrounding ICM (Finoguenov & Miniati, 2004). Furthermore, it was demonstrated that the X-ray activity of Coma-member galaxies is suppressed with respect to the field by a factor of 5.6 (Finoguenov et al., 2004). However, detailed analyses of these elliptical galaxies, which were mainly located interior to our field (within 1 Mpc of the center of Coma), showed that their X-ray emission, although showing evidence of some compression by the surrounding ICM, was not largely different from field galaxies (Finoguenov & Miniati, 2004). Finoguenov et al. (2004) suggested that it was not so much that the X-ray luminosity was suppressed but that the X-ray/optical flux ratio was suppressed. The reasons for this might include past gas stripping and/or past suppression of star formation in these Coma galaxies.
2 observation of the Coma cluster of galaxies
The ACIS-I observations were centered at (, ,), 41.4 arcminutes from the center of the cluster, which is defined as the center of cD galaxy NGC 4874 [located at (, ,)]. The arcmin2 ACIS-I field of view corresponds to Mpc2 at the distance of Coma. The X-ray observation, 65 ks in length (of which 60 ks was usable), was obtained during 2004 March and cover roughly 20% of the area covered optically by Mobasher et al. (2001). The field was chosen as a compromise between galaxy density and ICM brightness while remaining within the optical survey boundaries (see Figure 1 for the observation location).
Our basic data reduction includes removal of pixel randomization and correction for the charge transfer inefficiency created by radiation damage to the detector (Townsley et al., 2002). We used the routine provided by the X-ray Center (CXC), wavdetect, to search for X-ray sources down to a relatively low threshold of (this is the probability that the source is false) in the 0.5–8 keV (full), 0.5–2 keV (soft) and 2–8 keV (hard) X-ray bands. We then used the acisextract (v3.2) tool (developed at Penn State; Broos et al., 2003), to perform additional reductions including constructing PSFs and calculating weighted RMFs/ARFs. A total of 74 X-ray point sources were detected in this field. We also ran source-searching at a much lower X-ray detection threshold to aid in placing X-ray upper limits on undetected sources ( threshold).
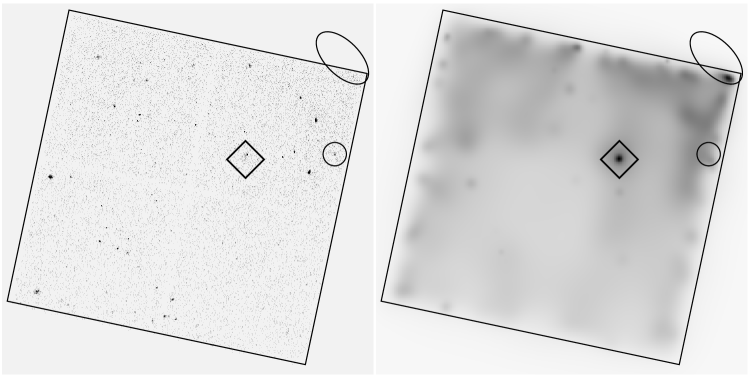
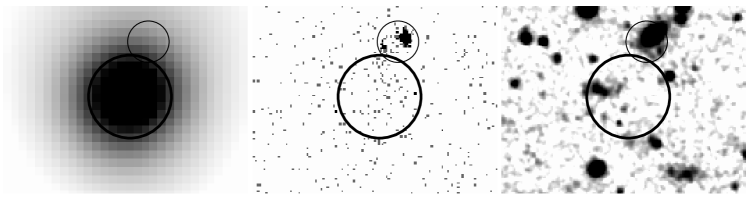
We also search for diffuse structure in order to characterize the ICM in the field (although a detailed analysis of the cluster ICM emission is beyond the scope of the present study). We removed regions corresponding to the 90% encircled-energy radius of the PSF at each source’s location and ran the routine over the resulting image (see Figure 2). There is clearly a background gradient in the field with brighter ICM emission to the North (this is the direction of the NGC 4839 group, which is thought to be falling into Coma and where the secondary peak of the cluster emission is located; Neumann et al., 2001). There was one particularly bright region in the northwest corner of our field, which is clearly visible both in the smoothed and the raw data (this is circled in Figure 2). There are two X-ray point sources to the north of this region. Due to the sub-arcsecond imaging of , we may safely reject any contamination from either of these X-ray point sources to this region of diffuse X-ray emission. We discuss this diffuse region in more detail in Section 8.
We used the resulting background map to determine the X-ray sensitivity, following the algorithm of Alexander et al. (2003). A background map was constructed by removing regions with radii containing 90% encircled-energy for the 74 point sources. The 3 sensitivity was then determined by measuring the remaining background at each position in the ACIS field using Equation 2 of Muno et al. (2003) and then calculating the sensitivity based upon a limiting signal-to-noise ratio (we chose 4 ). We also measured the background directly in larger regions and found a general increasing gradient from the southeastern corner (where the background is counts/pixel in the 0.5–8 keV band) to the northwestern corner, near NGC 4389, where the background is counts/pixel.
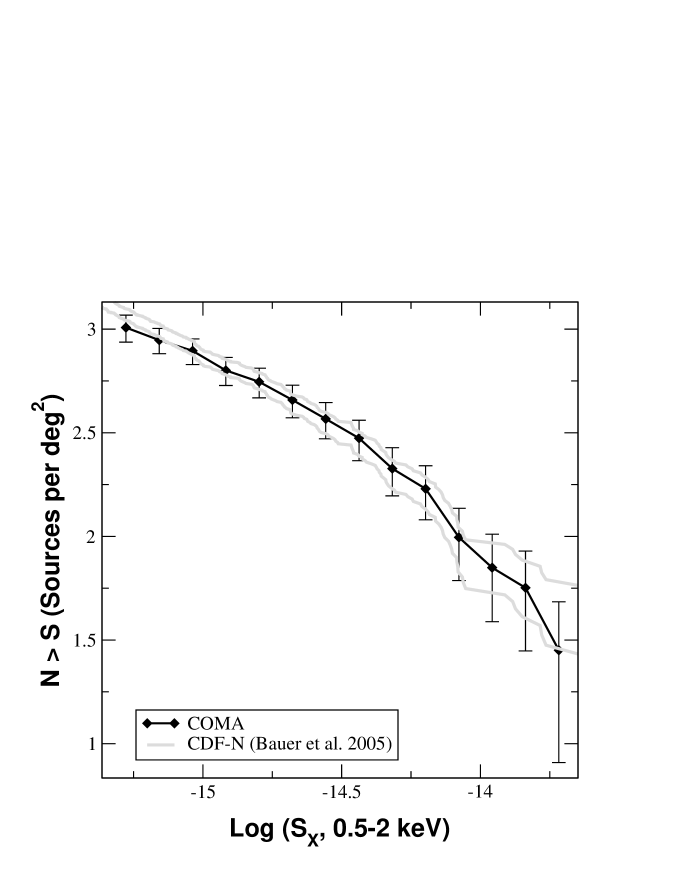
We concentrate the analysis in this paper on the 0.5–2 keV band due to the greater effective area and overall sensitivity to point sources in the soft band. Using the X-ray sensitivity map and limiting our analysis to the 62 sources detected with at least 10 0.5–2 keV counts, we constructed the - plot for the survey to determine how many of the X-ray sources are likely to be background AGNs. The number counts here were compared with those in Bauer et al. (2004) for the 2 Ms CDF-N (see Figure 3).
Clear statistical excesses of X-ray sources have been found in many different surveys of galaxy clusters (Cappi et al., 2001; Sun & Murray, 2002; Cappelluti et al., 2005; Ruderman & Ebeling, 2005). Generally, these other Chandra-observed clusters are much farther away than Coma so the coverage is wider-field and the typical detected sources are more luminous (they are largely AGN). In contrast our field is small and the coverage is deep. The Coma number counts demonstrate that, statistically, the X-ray sources in this field are consistent with the expected background AGN population. Based on cosmic variance alone (% among the deepest surveys; Bauer et al., 2004), it is still possible that up to 20 of the X-ray sources in the field could be Coma-member galaxies. Our results are consistent with the Finoguenov et al. (2004) Coma number counts analysis over a wider field (that most of the X-ray sources are background AGN). Although we are not able to directly measure the Coma member number counts in this field, we can constrain their numbers using spectroscopic identification (see § 6 for more details).
3 Optical Photometric and Spectroscopic Data
The Coma cluster has been the target of a number of redshift surveys. An extensive study was recently completed with the William Herschel Telescope (WHT), comprising wide-area imaging in the and bands (Komiyama et al., 2002) over multiple fields and medium resolution spectroscopy (Mobasher et al 2001) in two fields: one at the center of Coma and one at an off-center location. Each imaging field covers an area of arcmin2 and is photometrically complete to mag. The X-ray observations presented here cover a subset of the off-center spectroscopic field, which is located at a distance of from the center (, ; see Figure 1).
In this study we use the redshifts from Mobasher et al. (2001) together with the photometric data from the wide-area Coma survey. The redshift survey of Mobasher et al. (2001) was not spectroscopically complete due to the high number density of background galaxies. A color cut-off of , shown to be effective in rejecting background galaxies was imposed. There are two galaxy samples, a bright sample (corresponding to giant galaxies) and a faint sample (corresponding to dwarf galaxies). Both were selected as a random subset (checking to make sure the color-magnitude distribution matched the parent galaxy sample) for spectroscopic follow-up for () and (). Thus, while there is a robust measurement of the optical luminosity function in this region, not every galaxy has a spectroscopic identification. For the purposes of this paper, we define a split between giant and dwarf galaxies at .
Note that while the optical photometry and spectroscopy in this field is sufficiently deep to detect relatively faint dwarf galaxies at the distance of Coma (), the limits are not faint enough to obtain redshifts for all of the background AGN. However, wider-field work by P. Martini et al. 2006, in preparation on a sample of 8 clusters at (all are more distant than Coma) shows that the spectroscopically identified sources do account for the statistical excess. Thus, we can be fairly sure that we are not missing Coma-member galaxies in the X-ray source population lacking optical counterparts.
4 Sources with Optical Counterparts
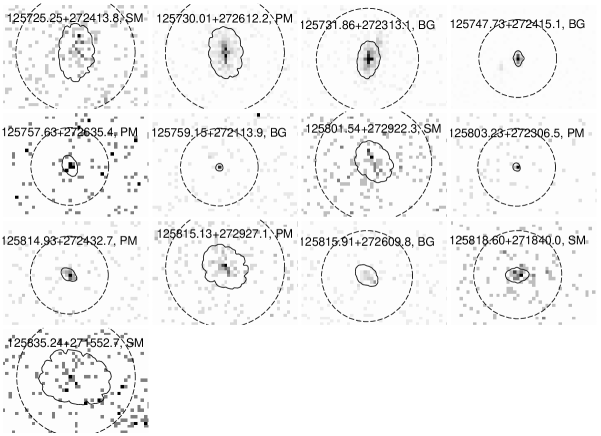
Table 1 presents the 13 X-ray sources with optical counterparts above the limit of the WHT imaging survey. Figure 4 shows the raw 0.5–8 keV X-ray images for these 13 sources. Clearly the vast majority of the sources with bright optical counterparts are consistent with point-like X-ray emission. The spectroscopically-confirmed Coma-members (whose angular extent is also the largest) are less obviously point-like and may be moderately extended.
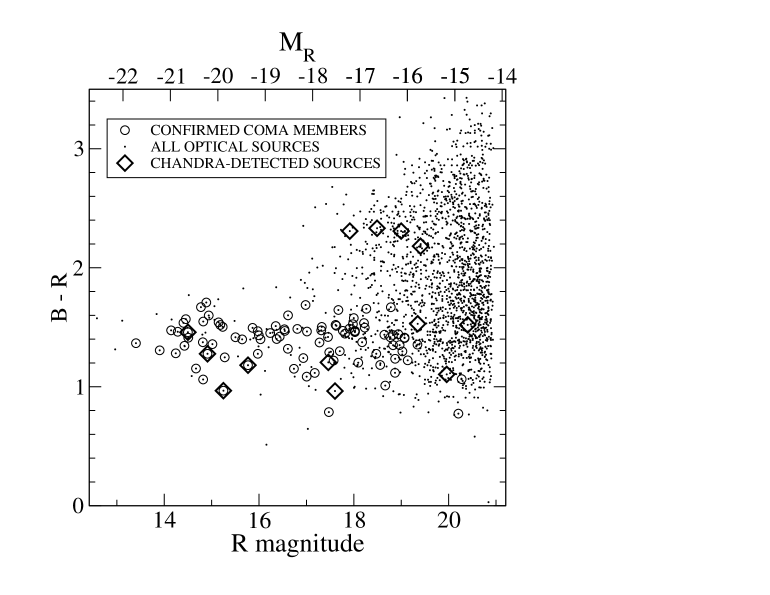
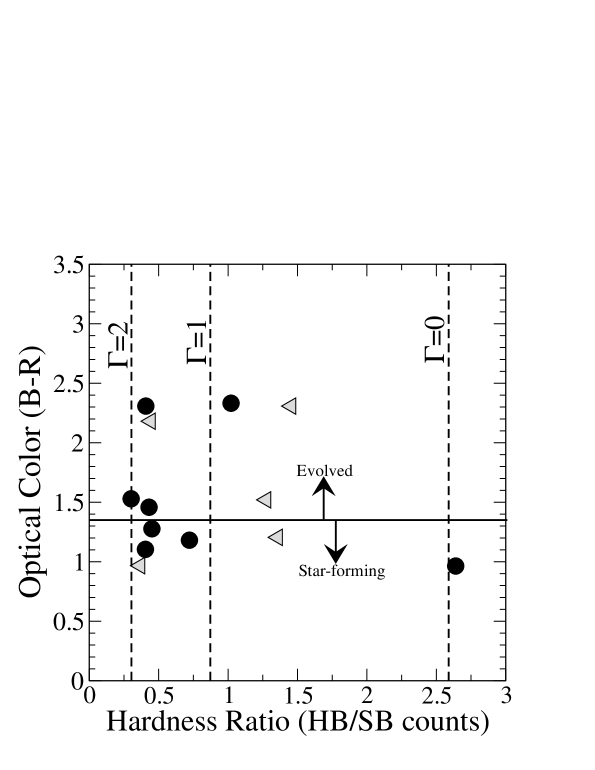
Figure 5 shows the locations of the Chandra sources with photometric matches on a color-magnitude plot ( vs ). The spectroscopically confirmed Coma members are also indicated (all have due to the target selection; see § 3). Four of the X-ray sources have colors that are redder than typical Coma-member galaxy colors, indicating they are likely background AGN. In Figure 6, we plot the color versus X-ray hardness ratio (plotted as a ratio of 2–8 keV/0.5–2 keV counts). Note that only 8 of the 13 sources had confident detections in the 2–8 keV band. Among the sources with optical colors indicative of cluster membership (), there is some preference for lower hardness ratios, indicating that these sources are likely not obscured AGN (note that none of these sources contain unobscured AGN; see § 5). We have also overlaid the color cut suggested by Mobasher et al. (2001) and verified using ultraviolet observations by D. Hammer et al. 2005, in preparation, for a division between evolved and star-forming galaxies. There is little difference in X-ray hardness across this line. However, the hardest X-ray source is in the star-forming region of the plot (CXOCOMA J123815.1+272927). Its 2–8 keV luminosity is erg s-1if it is indeed a Coma member. It is quite possible that an individual ULX might be dominating the X-ray emission from this galaxy, indeed they can be quite X-ray hard (e.g., see Hornschemeier et al., 2004). The angular offset is marginal, even with Chandra, however. Since there is no spectroscopic redshift, we don’t comment on this source any further.
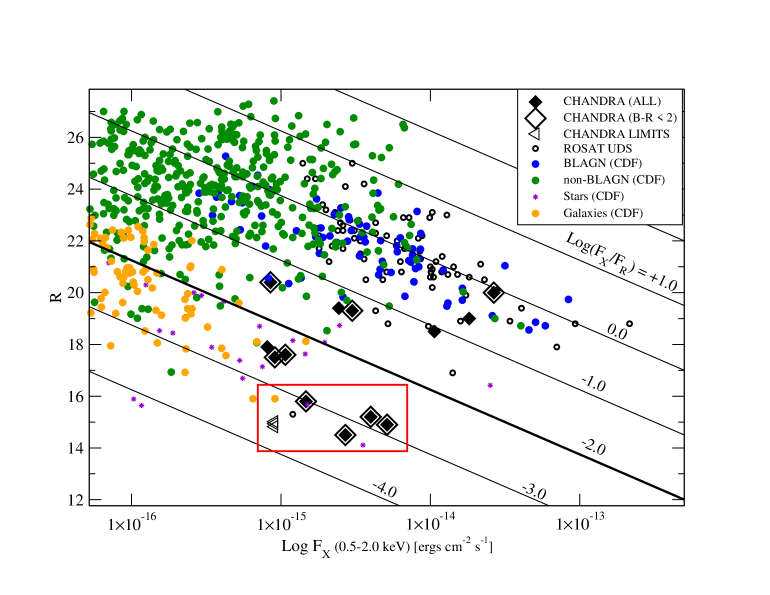
In Figure 7, we show the -band vs X-ray flux plot for these same 13 sources, with the sources having marked. This figure demonstrates the success in reaching low X-ray-to-optical flux ratios in a moderate-depth observation of Coma. In total, there are six sources that have both colors indicating Coma membership and the lower X-ray-to-optical flux ratios indicating that they are likely to be normal galaxies (i.e. are not AGNs). All six sources are brighter than , corresponding to the optical survey’s giant galaxy optical cutoff. We also show upper limits for the three undetected Coma-member giant, spectroscopically-confirmed, Coma-member galaxies in the field.
5 X-ray Constraints on Spectroscopically-Confirmed Coma Members
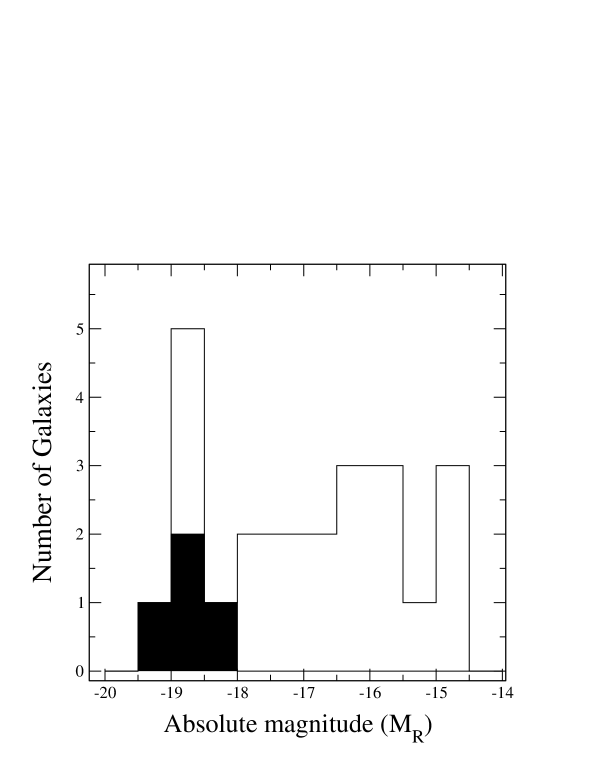
There are a total of 23 spectroscopically-confirmed -member galaxies from the Mobasher et al. (2001) survey within the field. Of these, 7 are giant galaxies and 16 are dwarf galaxies. Four of the seven giant galaxies are detected by and none of the dwarf galaxies are detected (see Table 1). We have plotted the 7 undetected giant galaxies as X-ray upper limits in Figure 7.
To place the detections and non-detections into better physical context, we have plotted the absolute -band magnitudes of all 23 galaxies in Figure 8. We checked our lower-significance X-ray catalog to determine if we can detect any X-ray emission from the three optically bright X-ray-undetected galaxies. We also tried running wavdetect with different wavelet scales (for instance, neglecting the small scales and adding larger scales to try to detect spatial extent). Our sensitivity calculations indicate that our worst sensitivity even for a moderately extended source (over several arcseconds) is erg cm-2 s-1(0.5–2 keV) for all three sources, corresponding to X-ray/optical flux ratios of –.
Figures 9 and 10 show the optical spectra of the 4 X-ray-detected and 3 X-ray-undetected giant galaxies. Three of the four X-ray-detected sources are emission-line galaxies indicative of AGN and/or starburst activity whereas the undetected galaxies are mostly absorption-dominated, “passive” systems. The one X-ray detected galaxy with an absorption-dominated optical spectrum has the lowest X-ray/optical flux ratio (10-3.3). This clearly indicates that the three X-ray undetected optical giant galaxies may just be narrowly below the sensitivity of this survey.
We have measured the emission lines to further characterize their nature, comparing with the diagnostic lines of Veilleux & Osterbrock (1987). We considered the emission line ratios OIII/H vs OI/H and OIII/H vs NII/H. Of the three emission-line galaxies (see Table 2), one is clearly in the HII galaxy (star forming galaxy) region of these diagnostic plots. For the other two, we do not have good H coverage or it is ambiguous: it could be either a LINER or an HII galaxy. Neither are consistent with Seyfert galaxies, however. All of the absorption line (k-type galaxy) spectra are “normal” (passively evolving, nothing special) except for the 125754.3+272926 which is a k+a (possible post-starburst) galaxy. This source was not detected.
6 Efficiency of Detecting Galaxies in the X-rays in Coma
Once we have identified the sources that are likely Coma members, we may estimate the “efficiency” of detecting galaxies in the X-ray band in this field versus a blank field survey. If we pessimistically assume that we have detected only four Coma-member galaxies in the X-ray band that are Coma members, this corresponds to sources deg-2 (statistical errors, 90% confidence) at our flux limit of erg cm-2 s-1(0.5–2 keV). Note that all four of these galaxies have low X-ray/optical flux ratios (see Figure 7 ) and have optical spectra that support that they do not have significant contributions due to hidden obscured AGN (see § 5). We consider three studies of field galaxy number counts in the X-ray band. The deepest survey, the 2 Ms CDF-N has the highest galaxy number density detected thus far, down to X-ray fluxes of erg cm-2 s-1(0.5–2 keV; Bauer et al., 2004). Note that the Bauer et al. (2004) study does include low-luminosity AGN, as do all such field galaxy surveys. Indeed, since most galaxies exhibit lower-level AGN activity (Ho et al., 2001; Ho et al., 2003), it is not really possible to completely separate the X-ray sources into two populations (galaxies and AGN). Bauer et al. (2004) obtained source counts of and galaxies per square degree at a 0.5–2 keV flux erg cm-2 s-1 depending on how aggressively one excludes possible moderate-luminosity AGN. We also compare with the Georgakakis et al. (2004) XMM-Newton Needles in the Haystack survey at which covers intermediate X-ray fluxes more appropriate to those here. The Georgakakis et al. (2004) estimate also includes some AGN contamination, at (0.5–2 keV) their number counts are galaxies deg-2. It is difficult to compare with a truly local () estimate of the number counts; the best such estimate appears to be the the ROSAT study of Tajer et al. (2005) which reaches erg cm-2 s-1(0.5–2 keV) but includes a higher AGN fraction than the other studies (many sources have higher values of X-ray/optical flux ratio and clear indications of AGN activity, although at relatively low levels). Tajer et al. (2005) finds galaxies deg-2 at (0.5–2 keV). Due to the high AGN fraction we do not use the Tajer et al. (2005) number in our comparison. We may thus conclude that this Coma survey is 7–26 times more efficient at detecting galaxies if we have just four Coma members in our field.
7 Constraints on the Normal Galaxy X-ray Luminosity Function in Coma
Comparison of the cluster XLF with the field XLF is tricky business, as outlined in Finoguenov et al. (2004). One must carefully de-project the distribution of galaxies over the volume of the cluster to determine the number of galaxies per unit volume. Within a cluster of galaxies, the LF is generally calculated per unit area so such deprojections are not required. The optical LF with which we compare is measured per unit area whereas typical field LFs are per unit volume. We do not do a field/cluster comparison as we do not directly measure the LF.
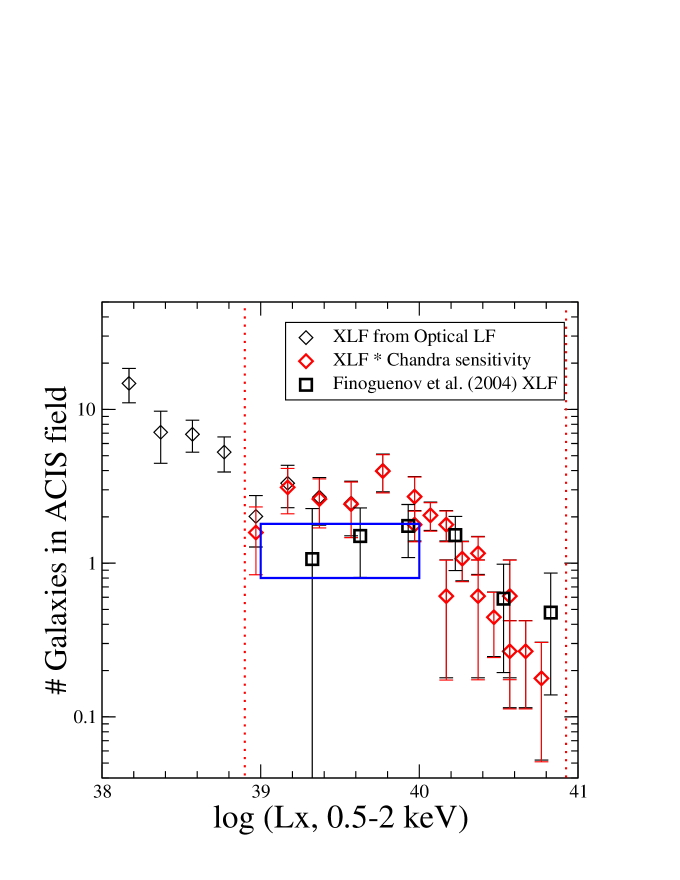
We have taken the well-measured optical luminosity functions of Mobasher et al. (2003; from their Table 3) and converted them to X-ray luminosity functions for comparison with this survey. We are encouraged by the apparent success of translating non-X-ray (generally infrared) LFs to XLFs from other studies (Norman et al., 2004; Ranalli et al., 2005). We converted from optical magnitudes to X-ray fluxes assuming , the value favored by all the spectroscopically identified sources, and which also appears typical of e.g., the Milky Way. It appears from the non-detections that even lower values of the X-ray-to-optical flux ratio may be plausible, but we choose a conservative scenario for the current comparison. We also plot this translated XLF with corrections for the sensitivity derived in § 2 to determine the range of the XLF probed by our Chandra observations. The red data points in Figure 11 shows the expected XLF corrected for the area of the field where we are able to detect a galaxy of the given luminosity. We find that our sensitivity drops sharply below erg s-1(0.5–2 keV). To check to see how reasonable this assumption of a constant might be, we compare with the Finoguenov et al. (2004) X-ray luminosity function (which was determined over a much larger area in Coma). Since the Finoguenov et al. (2004) XLF is primarily for the center of the cluster, we scale it down by a factor of 0.61 to account for the reduced galaxy density in our chosen field.
We find that our XLF, which is just the optical LF for this field translated assuming , agrees well with the Finoguenov XLF, which is a directly measured XLF. We can look at the number of X-ray detected galaxies in our sample and compare it with the predictions of this XLF. If we integrate the converted XLF from – erg s-1, which corresponds to our approximate detection limit on the faint end, we find that galaxies are predicted in this field. We use the total number of X-ray detected galaxies (the upper bound corresponds to 9 members whereas the lower bound is the spectroscopically-confirmed subset) as a constraint on the Chandra XLF (shown as a blue box in Figure 11). We find good agreement between our constraint (which is admittedly broad) and the Finoguenov XLF. Both XLFs thus support a very low value of X-ray-to-optical flux ratio (less than ).
However, our results are obtained in an off-center field (largely outside of the region studied by Finoguenov). This might indicate that all of the impact of the cluster ICM on X-ray/optical flux ratios occurs at relatively low ram pressures at 1.1 Mpc from the cluster core. This might be expected based on the cluster ICM interactions observed by Neumann et al. (2001), which showed that the Coma ICM at this radius exerts enough pressure to displace the intragroup medium of the NGC 4839 group. The potential well of a group is of course deeper than that of galaxies, so ICM effects are likely still expected. This points to galaxy infall as a major contributor to the properties of galaxies in clusters. Indeed, recent optical surveys are finding that star-forming galaxies are found to be more prominent in infalling structures in clusters at higher-redshift (; e.g., Tran et al., 2005). The galaxies that we are studying in Coma, particularly in an area relatively nearby the NGC 4839 group, are the most likely descendants of these star-forming galaxies.
8 Diffuse X-ray Emission in the COMA3 field
As described in Section 2, we identified a region of diffuse X-ray flux in the field. We constructed a 20 region centered on the peak of the X-ray flux in the adaptively smoothed image, and a background frame, starting 5 arcseconds outside this box, and ending 15 arcseconds outside the box. There were 57 0.5–8 keV X-ray counts within this box-shaped region, 39.9 above background corresponding to flux of erg cm-2s-1 (0.5–8 keV), or erg s-1at the distance of Coma. Comparison with the X-ray luminosities of known galaxy groups in the nearby Universe (Figure 7 of Mulchaey et al., 2003) shows that this X-ray luminosity is typical of lower-luminosity groups. At this time, we are not able to rule out the possibility that this is either a foreground or background region of diffuse X-ray flux.
We show the raw X-ray image (with the point sources included) in the second panel of Figure 2. The brighter X-ray source is clearly coincident with an optically bright galaxy (,, ; ) which we show in the WHT optical image in the third panel. This source unfortunately did not have a redshift in the Mobasher et al. (2003) catalog and its optical colors indicate that it is likely a background source unrelated to the diffuse emission. Spectroscopic observations of this galaxy were carried out at the Lick Observatory during May 2005 but due to poor weather were not successful. The X-ray flux of erg cm-2 s-1 (0.5–2 keV) implies an X-ray luminosity of erg s-1(0.5–2 keV) at the distance of Coma, but it is more likely a background object.
9 Conclusion and Future Work
Through a 60 ks observation in the outskirts of the Coma cluster, we have identified nine X-ray-detected galaxies whose optical colors indicate likely Coma membership (four with spectroscopic confirmation). All seven spectroscopically-confirmed Coma members in this field have detections or limits consistent with very low X-ray/optical flux ratios. We have thus confirmed the suppression of X-ray emission from galaxies in clusters (with respect to their optical emission) found previously in an XMM-Newton study. The notable aspect of our result is that it is for an off-center region in the cluster. This may indicate that all of the impact of the cluster ICM on X-ray/optical flux ratios occurs at relatively low ram pressures at 1.1 Mpc from the cluster core.
This particular field would benefit from complete optical spectroscopic coverage to establish whether any of the sources with higher X-ray/optical flux ratios might be members (and thus would run counter to the apparently lower X-ray/optical flux ratios for the current spectroscopic sample). These sources could be moderate luminosity AGN, which would be interesting due to the relatively high AGN fraction.
Our results indicate that an X-ray survey sensitive to erg cm-2 s-1(0.5–2 keV) can begin to probe normal galaxies at the distance of Coma. However, to obtain sufficient numbers of galaxies to directly constrain the XLF one would need to observe a larger area (3–4 times the area) or observe to fainter X-ray fluxes. Such a wider-field survey would also build upon the existing and planned excellent multi-wavelength data in the field, including the recent Spitzer IRAC (P.I. Hornschemeier) observations which cover the entire field, as well as the upcoming approved GALEX observations (P.I. Hornschemeier). Additionally, the Sloan Digital Sky Survey has recently surveyed parts of Coma; the first portions of these data will be available as part of SDSS DR5.
References
- Alexander et al. (2003) Alexander, D. M., et al. 2003, AJ, 126, 539
- Bauer et al. (2002) Bauer, F. E., Alexander, D. M., Brandt, W. N., Hornschemeier, A. E., Vignali, C., Garmire, G. P., & Schneider, D. P. 2002, AJ, 124, 2351
- Bauer et al. (2004) Bauer, F. E., Alexander, D. M., Brandt, W. N., Schneider, D. P., Treister, E., Hornschemeier, A. E., & Garmire, G. P. 2004, AJ, 128, 2048
- Broos et al. (2003) Broos, P., Townsley, L., Getman, K., & Bauer, F. 2003, ACIS Extract, An ACIS Point Source Extraction Package, Pennsylvania State University, http://www.astro.psu.edu/xray/docs/TARA/ae_users_guide.html
- Cappelluti et al. (2005) Cappelluti, N., Cappi, M., Dadina, M., Malaguti, G., Branchesi, M., D’Elia, V., & Palumbo, G. G. C. 2005, A&A, 430, 39
- Cappi et al. (2001) Cappi, M., et al. 2001, ApJ, 548, 624
- Colless & Dunn (1996) Colless, M., & Dunn, A. M. 1996, ApJ, 458, 435
- Finoguenov et al. (2004) Finoguenov, A., Briel, U. G., Henry, J. P., Gavazzi, G., Iglesias-Paramo, J., & Boselli, A. 2004, A&A, 419, 47
- Finoguenov & Miniati (2004) Finoguenov, A., & Miniati, F. 2004, A&A, 418, L21
- Georgakakis et al. (2004) Georgakakis, A., et al. 2004, MNRAS, 349, 135
- Georgantopoulos et al. (2005) Georgantopoulos, I., Georgakakis, A., & Koulouridis, E. 2005, MNRAS, 360, 782
- Grimm et al. (2003) Grimm, H.-J., Gilfanov, M., & Sunyaev, R. 2003, MNRAS, 339, 793
- Ho et al. (2001) Ho, L. C., et al. 2001, ApJ, 549, L51
- Ho et al. (2003) Ho, L. C., Filippenko, A. V., & Sargent, W. L. W. 2003, ApJ, 583, 159
- Hornschemeier et al. (2004) Hornschemeier, A. E., et al. 2004, ApJ, 600, L147
- Hornschemeier et al. (2001) Hornschemeier, A. E., et al. 2001, ApJ, 554, 742
- Hornschemeier et al. (2005) Hornschemeier, A. E., Heckman, T. M., Ptak, A. F., Tremonti, C. A., & Colbert, E. J. M. 2005, AJ, 129, 86
- Komiyama et al. (2002) Komiyama, Y., et al. 2002, ApJS, 138, 265
- Lehmann et al. (2001) Lehmann, I., et al. 2001, A&A, 371, 833
- Łokas & Mamon (2003) Łokas, E. L., & Mamon, G. A. 2003, MNRAS, 343, 401
- Mobasher et al. (2001) Mobasher, B., et al. 2001, ApJS, 137, 279
- Mobasher et al. (2003) Mobasher, B., et al. 2003, ApJ, 587, 605
- Mulchaey et al. (2003) Mulchaey, J. S., Davis, D. S., Mushotzky, R. F., & Burstein, D. 2003, ApJS, 145, 39
- Muno et al. (2003) Muno, M. P., et al. 2003, ApJ, 589, 225
- Neumann et al. (2001) Neumann, D. M., et al. 2001, A&A, 365, L74
- Norman et al. (2004) Norman, C., et al. 2004, ApJ, 607, 721
- Poggianti et al. (2001) Poggianti, B. M., et al. 2001, ApJ, 562, 689
- Ptak et al. (2006) Ptak, A., Hornschemeier, A., Norman, C., Mobasher, B., & Bauer, F. 2006, ApJsubmitted
- Ranalli et al. (2003) Ranalli, P., Comastri, A., & Setti, G. 2003, A&A, 399, 39
- Ranalli et al. (2005) Ranalli, P., Comastri, A., & Setti, G. 2005, A&A, 440, 23
- Ruderman & Ebeling (2005) Ruderman, J. T., & Ebeling, H. 2005, ApJ, 623, L81
- Shapley et al. (2001) Shapley, A., Fabbiano, G., & Eskridge, P. B. 2001, ApJS, 137, 139
- Stark et al. (1992) Stark, A. A., Gammie, C. F., Wilson, R. W., Bally, J., Linke, R. A., Heiles, C., & Hurwitz, M. 1992, ApJS, 79, 77
- Sun et al. (2005) Sun, M., Jerius, D., & Jones, C. 2005, ApJ, 633, 165
- Sun & Murray (2002) Sun, M., & Murray, S. S. 2002, ApJ, 577, 139
- Tajer et al. (2005) Tajer, M., Trinchieri, G., Wolter, A., Campana, S., Moretti, A., & Tagliaferri, G. 2005, A&A, 435, 799
- Townsley et al. (2002) Townsley, L. K., Broos, P. S., Nousek, J. A., & Garmire, G. P. 2002, Nuclear Instruments and Methods in Physics Research, in press
- Tran et al. (2005) Tran, K.-V. H., van Dokkum, P., Illingworth, G. D., Kelson, D., Gonzalez, A., & Franx, M. 2005, ApJ, 619, 134
- Veilleux & Osterbrock (1987) Veilleux, S., & Osterbrock, D. E. 1987, ApJS, 63, 295
| IAU Name | coordinates | Photo | Optical coordinates | Reff | XR-Opt | SB flux | HB flux | NOTES | |||||
|---|---|---|---|---|---|---|---|---|---|---|---|---|---|
| IDa | (′′) | (′′) | erg cm-2 s-1 | AB mag | |||||||||
| 125725.25272413.8 | 194.355225 | 27.403835 | 19592 | 194.355211 | 27.404658 | 3.0 | 3.0 | 5.13 | 10.8 | 14.9 | 1.3 | -2.8 | SM |
| 125730.01272612.2 | 194.375061 | 27.436747 | 20416 | 194.375144 | 27.436869 | 0.9 | 0.5 | 26.60 | 48.6 | 20.0 | 1.1 | -0.1 | PM |
| 125731.86272313.1 | 194.382782 | 27.386995 | 18997 | 194.382811 | 27.387107 | 1.2 | 0.4 | 18.19 | 37.1 | 19.0 | 2.3 | -0.6 | BG |
| 125801.54272922.3 | 194.506424 | 27.489534 | 22196 | 194.506534 | 27.489696 | 5.6 | 0.7 | 2.70 | 4.18 | 14.5 | 1.5 | -3.3 | SM |
| 125815.13272927.1 | 194.563080 | 27.490862 | 22057 | 194.563418 | 27.490874 | 1.6 | 1.1 | 1.07 | 19.9 | 17.6 | 1.0 | -2.4 | PM, hardd |
| 125815.91272609.8 | 194.566315 | 27.436064 | 20385 | 194.567152 | 27.436340 | 1.1 | 2.9 | 2.44 | 19.4 | 2.2 | -1.4 | BGe | |
| 125818.60271840.0 | 194.577515 | 27.311132 | 16898 | 194.577738 | 27.310656 | 3.3 | 1.9 | 1.47 | 3.21 | 15.8 | 1.2 | -3.0 | SM |
| 125835.24271552.7 | 194.646866 | 27.264656 | 15769 | 194.647339 | 27.264648 | 3.9 | 1.5 | 3.99 | 15.2 | 1.0 | -2.8 | SM | |
| 125747.73272415.1 | 194.448883 | 27.404198 | 19518c | 194.448952 | 27.404253 | 1.1 | 0.3 | 10.63 | 64.2 | 18.5 | 2.3 | -1.1 | BG |
| 125757.63272635.4 | 194.490143 | 27.443174 | 20668 | 194.490344 | 27.443344 | 1.9 | 0.9 | 0.91 | 17.5 | 1.2 | -2.6 | PM | |
| 125759.15272113.9 | 194.496460 | 27.353876 | 17981 | 194.496596 | 27.353884 | 1.5 | 0.4 | 0.81 | 17.9 | 2.3 | -2.4 | BG | |
| 125803.23272306.5 | 194.513489 | 27.385160 | 18934 | 194.513409 | 27.386001 | 1.5 | 3.0 | 0.85b | 20.4 | 1.5 | -1.5 | PM | |
| 125814.93272432.7 | 194.562241 | 27.409094 | 19583 | 194.560907 | 27.408269 | 2.9 | 5.2 | 3.00 | 3.02 | 19.3 | 1.5 | -1.3 | PM |
| Source Name | L | Spectral | NAME | |
|---|---|---|---|---|
| (1039 erg s-1) | IDc | |||
| X-RAY-DETECTED SOURCES: | ||||
| 125725.25272413.8 | 0.0162 | 5.3 | e(b) | D15, GMP4918, Mkn 55 |
| 125801.54272922.3 | 0.0253 | 6.6 | k | D21, GMP4568 |
| 125818.60271840.0 | 0.0249 | 4.5 | e(b?) | D9, GMP4351 |
| 125835.24271552.7 | 0.0247 | 7.9 | e(a:??) | D5, GMP4159 |
| UNDETECTED SOURCES: | ||||
| 125736.14+272905.59 | 0.0242 | k | D23 | |
| 125754.38+272926.47 | 0.0165 | k+a:(e:) | ||
| 125833.14+272151.54 | 0.0233 | k | ||