Optical Photometry of Type II-P Supernova 2004dj in NGC 2403
Abstract
We present photometric data of the type II-P supernova (SN) 2004dj in NGC 2403. The multicolor light curves cover the SN from 60 to 200 days after explosion, and are measured with a set of intermediate-band filters that have the advantage of tracing the strength variations of some spectral features. The light curves show a flat evolution in the middle of the plateau phase, then decline exponentially at the late times, with a rate of 0.100.03 mag (10 days)-1 in most of the filters. In the nebular phase, the spectral energy distribution (SED) of SN 2004dj shows a steady increase in the flux near 6600 Å and 8500 Å, which may correspond to the emission lines of H and Ca II near-IR triplet, respectively. The photometric behavior suggests that SN 2004dj is a normal SN II-P. Compared with the light curves of another typical SN II-P 1999em, we estimate the explosion date to be June 1021 UT, 2004 (JD 245316721) for SN 2004dj. We also estimate the ejected nickel mass during the explosion to be = 0.023 0.005 from two different methods, which is typical for a SN II-P. We derive the explosion energy erg, the ejecta mass , and the initial radius for the presupernova star of SN 2004dj, which are consistent with other typical SNe II-P.
1 Introduction
Supernova (SN) 2004dj was discovered by K. Itagaki (Nakano et al., 2004) on 2004 July 31.76 (UT dates are used throughout this paper) in the nearby SBcd galaxy NGC 2403 at a distance of 3.30.1 Mpc (Karachentsev et al., 2004). With a peak magnitude of 11.2 mag in the band, SN 2004dj was the brightest supernova in the past decade. Spectroscopic observations of SN 2004dj show that it is a typical Type II Plateau SN (SN II-P), with prominent P-Cygni profiles in hydrogen Balmer lines (Patat et al., 2004). The main photometric characteristic of a SN II-P is that its light curve, unlike other SNe, does not decay rapidly after maximum, but shows a plateau phase for 60-100 days before decaying exponentially. The plateau phase originates from a balance between the receding photosphere in the expanding ejecta when the supernova is powered by the recombination of hydrogen previously ionized by the supernova shock. SNe II-P have long been thought to be produced by core-collapse of massive (8 ) red supergiants that do not experience significant mass loss and retain most of their hydrogen-rich envelopes.
The optical position of SN 2004dj is measured to be R. A. = 07h37m17s.04, Dec = +65∘35′57′′.84 (J2000.0; Nakano et al. (2004)). This is in good agreement with the Chandra X-ray position (Pooley & Lewin, 2004) and the MERLIN radio position (Beswick et al., 2005). Using the astrometry of SN 2004dj, and also from geometrical registration between images of NGC 2403 before and after SN 2004dj occurred, both Maíz-Apellániz et al. (2004) and Wang et al. (2005) have convincingly shown that SN 2004dj occurred at a position coincident with Sandage Star 96 (hereafter S96) in the list of luminous stars and clusters in NGC 2403 published by Sandage (1984). Maíz-Apellániz et al. (2004) suggest that S96 is a young compact cluster with an age of 13.6 Myr and a total stellar mass of 24,000 , and estimate that the progenitor of SN 2004dj had a main-sequence mass of about 15 . Wang et al. (2005), on the other hand, suggest that S96 is an older ( 20.0 Myr) and more massive ( 96,000 ) cluster, and that the progenitor of SN 2004dj may have a mass of 12 .
Studies of SN 2004dj itself may shed light on the nature of its progenitor, thus providing additional constraints on the properties of S96. In this paper, we present the results from our campaign of photometric followup of SN 2004dj from Aug 2004 to Jan 2005. The observations and data reduction are described in 2, and the multicolor light curves and spectral energy distribution (SED) are presented in 3. We estimate the explosion date, the reddening, the synthesized 56Ni mass, and some explosion parameters for SN 2004dj in 4. The conclusions are summarized in 5.
2 Observations and Data Reduction
The observations of SN 2004dj were conducted with the 60/90 cm Schmidt telescope located at the Xinglong station of the National Astronomical Observatory of China (NAOC). A Ford Aerospace 20482048 CCD camera with a 15 micron pixel size is mounted at the Schmidt focus of the telescope. The field of view of the CCD is with a pixel scale of 1.7.
This telescope has a photometric system with 15 intermediate-band (FWHM 200-400 Å) filters covering a wavelength range from 3000 Å to 10000 Å. Figure 1 shows the filters transmissions. These filters, also dubbed as the BATC system, were used to conduct a survey project among astronomers in Beijing, Arizona, Taipei, and Connecticut (Fan et al., 1996), and are designed to avoid contamination from the strongest and most variable night sky emission lines. The BATC magnitudes use the monochromatic AB magnitudes as defined by Oke & Gunn (1983). The standard stars HD 19445, HD 84937, BD+262606, and BD+174708 (Oke & Gunn, 1983) are observed for flux calibration in the BATC observations. A full description of the BATC photometric system can be found elsewhere (Fan et al., 1996; Yan et al., 1999; Zhou et al., 2003).
We began to monitor SN 2004dj shortly after its discovery. The observations were obtained with 12 out of the 15 intermediate-band filters, and covered a period from 11 Aug 2004 to 10 Jan 2005. Typical exposure times are 300 s for each of the filters (longer for filters with the shortest wavelengths).
2.1 Photometry
As demonstrated by Maíz-Apellániz et al. (2004) and Wang et al. (2005), SN 2004dj occurred in a compact star cluster (S96) with mag. The background of SN 2004dj is also contaminated by the spiral arms and nearby H II regions in NGC 2403. To perform proper photometry for SN 2004dj, subtraction of a template image of NGC 2403 without the SN is necessary. Usually observers have to wait for a long time until a SN fades enough to take the template image of its host galaxy, but fortunately for us, the host galaxy of SN 2004dj has been imaged as part of the Multicolor Sky Survey of BATC since 1995. The enormous archival images of NGC 2403 (Wang et al., 2005) provide us with the necessary template images for all the filters.
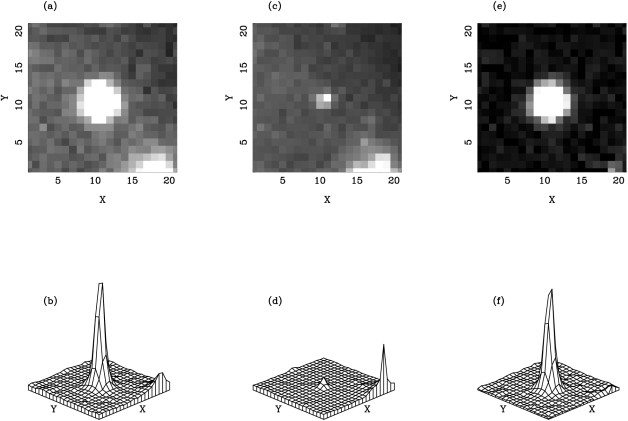
The goal of the image subtraction is to remove the contamination of the SN 2004dj flux by the compact cluster itself, and by the underlying emission from the spiral arms and nearby H II regions. To perform the subtraction, the observation with SN 2004dj is first geometrically registered to the corresponding template image. The intensity of the two images are then matched by comparing the total fluxes of the stars in the images, and the point-spread-function (PSF) of the two images are convolved to the same level. Finally, the template is subtracted from the SN image, leaving a clean background for the SN. Figure 2 demonstrates this process.
The final step is to perform standard aperture photometry on the subtracted images. We used Pipeline II (a program developed to measure the magnitudes of point sources in BATC images) that is based on Stetson’s DAOPHOT package (Stetson, 1987).
2.2 Calibration
A total of 45 photometric nights were used to calibrate 20 local standard stars in the field of SN 2004dj. For each photometric night, the afore-mentioned four standard stars were observed in a range of airmasses, and we derive iteratively the extinction curves and the slight variation of the extinction coefficients with time () (Zhou et al., 2001). The instrumental magnitudes () are transformed to the BATC AB magnitude () (Zhou et al., 2001) by
| (1) |
where is the airmass, and is the zero point of magnitude.
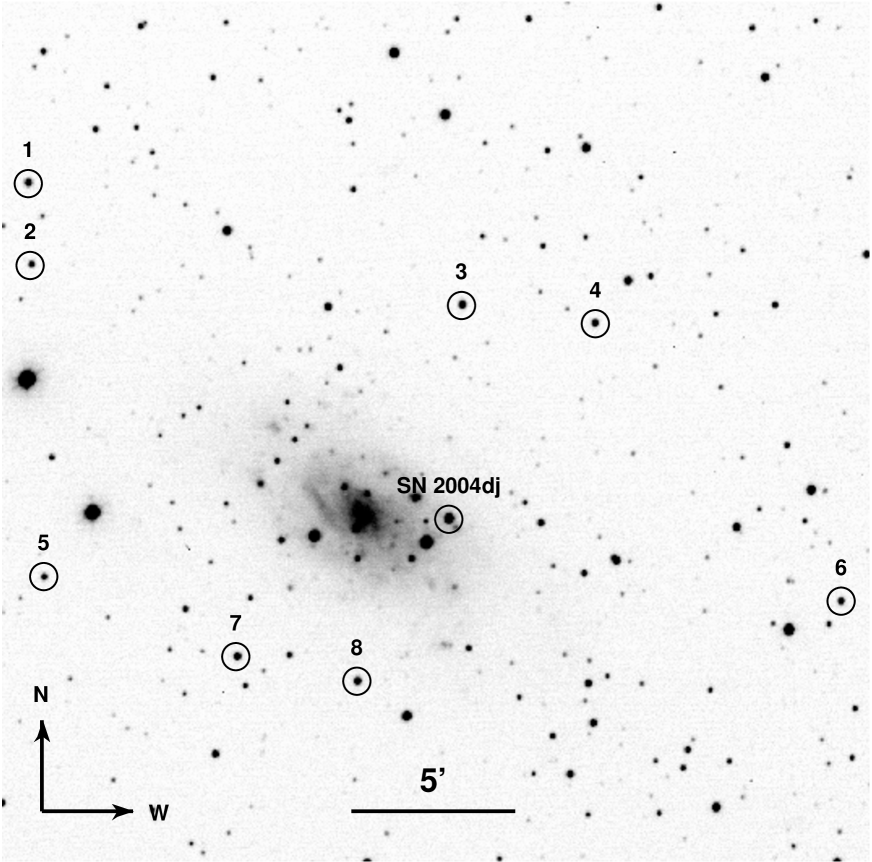
Table 1 lists the final calibrated BATC magnitudes and their uncertainties of the 20 local standard stars. Figure 3 shows a image of the SN 2004dj field, together with the local standard stars within this frame.
These local standard stars are then used to transform the instrumental magnitudes of SN 2004dj to the BATC system, and the results are listed in Table 2. The estimated error shown in the parenthesis is a quadrature sum of the uncertainties in the bias and flat-field correction, the aperture photometry, and the calibrations. The main source of the error comes from the photometry, which is mainly caused by photon noises and the uncertainties in the image subtraction.
The last three columns of Table 2 list the broad-band Johnson-Cousins magnitudes transformed from the BATC magnitudes. This transformation is done using the formula established by Zhou et al. (2003) which is given here as,
| (2) | |||||
We need to point out, however, these transformation equations are derived from observations of Landolt standard stars, and may have relatively large uncertainties when applied to objects with broad lines, such as SNe.
3 Multicolor Light Curves
3.1 Light Curves of the first 200 days
The light curves of SN 2004dj in twelve intermediate-band filters (from to ) are shown in Figure 4. Our photometry started at JD 2453230 and ended at JD 2453377, which corresponds to 60 to 200 days after explosion if we adopt 2004 June 10 (JD 2453167) as the day of explosion for SN 2004dj (see the analysis in §4.1). Our observations show that SN 2004dj has a prominent plateau phase in all the passbands, suggesting that SN 2004dj is a SN II-P.
The light curves in all bands were characterized by a phase of 45 days of slowly decreasing luminosity (until JD 2453275). During this phase, the magnitude of SN 2004dj decreased by slightly different amount for different bands: 0.20 mag in , 0.65 mag in and , and 0.5 mag in the other bands.
After the plateau phase, the light curves show a rapid drop of 2 mag in about 30 days, followed by a linear decay in magnitude that signals the onset of the nebular phase. The slow luminosity decline at the nebular phase, as listed in Table 3, is evident for SN 2004dj. The decline rates in most bands are mag (10 days)-1 during the epochs from 130 days to about 200 days after explosion. These late-time decay rates are in good agreement with the radioactive decay of 56Co.
The evolution of the nebular-phase light curves in the and bands do not follow the other bands. Instead, the -band flux remains almost constant, while the -band flux increases slowly during the nebular phase. The peculiar behavior of the SN in these two bands may be due to the effect of strong emission lines, as discussed in the next section.
For comparison the light curves of SN 2004dj in the band, transformed from our intermediate-band light curves using Eq.(2), are plotted along with the typical type II-P SN 1999em (Leonard et al., 2002; Hamuy et al., 2001) in Figure 5. Also plotted in the figure is the -band light curve of SN 2004dj as reported by Chugai et al. (2005). It can be seen that our transformed -band magnitudes are consistent with those reported by Chugai et al. (2005) to within 0.1 mag, suggesting that our transformation to the broad-band is reliable. This is consistent with expectations, since there are no strong emission or absorption lines at the -band wavelength range for a typical SN II-P as demonstrated by Leonard et al. (2002). Compared to SN 1999em, SN 2004dj shows a similar evolution at the plateau phase, but a somewhat different evolution in the nebular phase, particularly in the and bands. While SN 1999em declines linearly in the and bands during the nebular phase, SN 2004dj is flat in the band, and even brightens slightly in the band. We emphasize, however, our transformed and magnitudes for SN 2004dj may bear large uncertainties due to the strong emission lines of H and the Ca II IR triplet in our intermediate-band and , respectively. The different and evolution during the nebular phase for SN 1999em and SN 2004dj thus does not necessarily indicate a true difference between these two SNe.
3.2 The Spectral Energy Distribution (SED) Evolution
The spectral energy distribution (SED) of SN 2004dj can be best studied by spectroscopy such as these done by Korcakova et al. (2005). Alternatively, a rough SED can be constructed from the observed fluxes in various passbands at the same epoch. Because we have 12 intermediate-width passbands that cover 4000 Å to 10000 Å, we can study the SED evolution of SN 2004dj from our observations.
Because of the number of filters involved to observe SN 2004dj, it is not always possible to observe all bands in a single night, and our definition of the same epoch refers to a reference date 1 day. This is reasonable, considering the relatively slow evolution of SN 2004dj (except during the transition from the plateau to the nebular phase).
Figure 6 shows the SEDs of SN 2004dj at 61, 79, 112, 125, and 146 days after explosion. The SEDs are mostly a smooth function of the wavelength, except in the and bands, which are centered at 6700 Å and 8500 Å respectively. The deviation of these two bands from the smooth distribution of the other bands is likely to be caused by the strong lines in the spectrum of SN 2004dj. Because of the small heliocentric recession velocity (131 km s-1) of NGC 2403, our filter is centered at the H emission, while the filter covers the strong Ca II triplet 8498, 8542, 8662 line. From the well-studied SN II-P 1999em, Leonard et al. (2002) have shown that during the late part of the plateau phase, a SN II-P is dominated by strong lines with P-Cygni profiles. The emission component of H is generally much stronger than the absorption, as a result, a net emission from H when compared to the neighboring continuum is expected. In Figure 6, this is verified by the brighter magnitudes in the band than the and bands at 61 and 79 days after explosion. The absorption trough of the Ca II IR triplets, on the other hand, dominates the emission component at the same phase. This is verified by the relatively fainter magnitudes in the band when compared to the and bands.
Leonard et al. (2002) also show that during the nebular phase (later than 120 days after explosion), the spectrum of SN 1999em is dominated by broad emissions. This is also true for the Ca II IR triplet, which shows multiple strong emission components but with little absorption. Our SEDs for SN 2004dj closely follow this trend: the band flux changes from a relative absorption at 61 and 79 days after explosion, to a relative emission at 125 and 146 days after explosion. The smooth SED around band at 112 days after explosion suggests that the absorption and emission components of the Ca II near-IR triplet is roughly balanced.
3.3 Color evolution
The (open circles) and (solid circles) color curves of SN 2004dj are shown in Figure 7, together with comparisons to those of SN 1999em (Leonard et al., 2002; Hamuy et al., 2001). Before 120 day after explosion, the two SNe show similar color evolution [SN 2004dj has a slight bluer color]. In the nebular phase, however, there is a relatively big difference between the colors of the two SNe. SN 1999em remains nearly the same color, while SN 2004dj becomes progressively redder. Several factors may have contributed to this difference: there may be large uncertainties in our transformed - and -band magnitudes for SN 2004dj due to prominent emission lines of H and Ca II near-IR triplet; the colors of SN 1999em may have large uncertainties as well, since the photometry was not performed after galaxy subtraction and background contamination may be significant due to the faintness of SN 1999em in the nebular phase.
Figure 7 also shows the evolution of SN 2004dj in two other colors: (solid squares) and (solid stars). The and bands, which are centered at 4540 Å and 5795 Å, respectively, do not include strong lines of SNe II-P. The color thus roughly equals the color in the broad band. The color of SN 1999em and the color of SN 2004dj both evolve from blue to red after explosion, reach their reddest colors at 130-140 days, then become progressively bluer [at a rate of 0.50 mag (100 days)-1] as the SNe enter the nebular phase. The color of SN 2004dj is bluer than the color of SN 1999em by 0.600.10 mag. This discrepancy may be caused by the systematic difference between the intermediate- and broad-band photometry. We were unable to convert our -band photometry to due to the lack of -band (centered at 4220 Å) observations (cf. Eq. (2)).
The color of SN 2004dj shows a rapid and progressively redder evolution. The band is centered at 7000 Å and roughly equals the broad band. It does not include strong lines of a SN II-P. The band is centered at 8500 Å and roughly equals the broad band. This band, however, includes the strong Ca II IR triplet lines. Compared to the evolution of SN 1999em, the color of SN 2004dj evolves toward red at a much faster pace [ 1.60 mag (100 days)-1]. This is most likely caused by the brightening of the strong Ca II IR triplet emission in the band of SN 2004dj.
4 Estimates of the explosion and the reddening
4.1 The explosion time
The spectra taken immediately after the discovery indicated that SN 2004dj was found long after the outburst (e.g., Patat et al. (2004), Korcakova et al. (2005)). This is also supported by the photometric observations. Our light curves of SN 2004dj (see Figure 4), obtained 11 day after discovery, show that it was discovered in the middle of the plateau phase. Following the method of Hendry et al. (2005), we attempt to estimate the explosion time of SN 2004dj by comparing its light curve to those of other well-observed SNe II-P. This method adjusts the time and magnitude to find the best match using a -minimizing technique. Assuming SN 2004dj evolves like SN 1999em, the comparison of the -band data of the two SNe suggests an explosion date of JD 24531681 (June 111, 2004) for SN 2004dj, with a reduced of 1.39. This estimate is consistent with that derived by Chugai et al. (2005) (JD 2453170) from a comparison between SN 2004dj and SN 1999gi. The uncertainty of our explosion date ( 1 day) comes from the statistical error of the fitting only.
The explosion date derived above assume SN 2004dj has the same duration of the plateau phase as SN 1999em. It was found from a sample of 13 SNe II-P, however, the average plateau duration varies by 21 days (Hamuy, 2003; Hendry et al., 2005). As the error of the plateau phase duration is propagated directly to the error of the explosion date, we increase the uncertainty of our explosion date to 21 days. The final explosion date, JD 245316821, suggests that SN 2004dj was discovered at 5021 days after explosion.
4.2 The interstellar extinction
The Galactic extinction towards NGC 2403/SN 2004dj is known to be mag (Schlegel, Finkbeiner & Davis, 1998), corresponding to a color excess of = 0.04 mag (adopting the standard reddening laws of Cardelli, Clayton & Mathis (1989)). However, it is rather difficult to accurately measure the extinction towards SN 2004dj within its host galaxy (NGC 2403).
With the assumption that all SNe II-P have the same intrinsic color at the end of the plateau phase (Eastman et al., 1996; Hamuy, 2004), the color evolution of SN 2004dj may provide clues to its reddening. Since the early spectra of SN 2004dj are very similar to those of SN 1999em (Patat et al., 2004), it is reasonable to use SN 1999em as a comparison SN. We adopt a reddening of 0.10 mag for SN 1999em following the analysis by Barbon et al. (2000) and Hamuy et al. (2001). A -fitting algorithm was then used to compare the colors of SN 2004dj with those of SN 1999em from 60 days to 130 days after explosion. The fit yields a reddening of mag for SN 2004dj, which is less than the Galactic reddening of = 0.04 mag. The fit yields a negative reddening of = 0.190.05 mag for SN 2004dj (cf. Figure 6), which is physically unrealistic. Our failure to derive a reasonable reddening for SN 2004dj using the intrinsic color method suggests that the uncertainty of the method may be large, as also noted by Hamuy (2004). We also note that since our transformed and magnitudes for SN 2004dj are not reliable, the reddening estimates from the and color evolution are questionable as well.
An alternative way to determine the reddening towards SN 2004dj is to use the equivalent width (EW) of the Na I D interstellar absorption lines. The presence of narrow Na I D absorption lines in the early spectrum of SN 2004dj, with EW 1.1 Å, was reported by Patat et al. (2004). Based on this EW, Patat et al. (2004) estimated the reddening towards SN 2004dj within NGC 2403 is = 0.18 mag. The correlation between the EW of the Na I D interstellar absorption and the reddening, unfortunately, is quite uncertain. Using EW = 1.1 Å and the prescription by Barbon et al. (1990), we derived a reddening of = 0.28 mag for SN 2004dj within NGC 2403. The prescription by Munari & Zwitter (1997), on the other hand, suggests a host galaxy reddening of = 0.40 mag. The average of the three measurements is = 0.290.11 mag. When combined with the Galactic component, the total reddening towards SN 2004dj is = 0.330.11 mag, which is consistent with the estimate = 0.350.05 mag from the spectral fit to the SED of S96 (Wang et al., 2005).
We adopt = 0.330.11 mag ( = 1.020.34 mag) as our final reddening estimate for SN 2004dj. When this correction for reddening is applied, we obtain the intrinsic peak brightness for SN 2004dj as mag (the major error is contributed from the uncertainty of the reddening correction), which is typical for a SN II-P.
5 The bolometric light curve and the mass of 56Ni
5.1 The bolometric light curve
SNe II-P produce a large range of 56Ni masses from to . Hamuy (2003) showed that a correlation exists between the amount of 56Ni produced in the explosion and the absolute magnitude in the -band during the plateau phase. Our observations suggest that SN 2004dj has a plateau luminosity of mag. We therefore estimate that amount of 56Ni produced during the SN 2004dj explosion to be intermediate between 0.01 and 0.1 if it follows the correlation shown in Figure 3 of Hamuy (2003). To better estimate the mass of 56Ni produced during the explosion, we construct the “bolometric” light curve for SN 2004dj by integrating the flux in the 12 intermediate bands. The decline rate of the “bolometric” light curve for SN 2004dj is smaller than that of SN 1987A [0.730.30 mag (100 days)-1 vs. 1.060.06 mag (100 days)-1]. This pseudo-bolometric light curve may not be accurate due to our lack of the ultraviolent and infrared photometry for SN 2004dj. The resulting light curve, together with that of SN 1987A (Suntzeff & Bouchet, 1990), are shown in Figure 8.
5.2 The ejected 56Ni mass
5.2.1 The 56Ni mass from the bolometric light curve
The luminosity of a SN II-P during the nebular exponential decay is controlled by the radioactive decay of the newly synthesized materials during the SN explosion (Weaver & Woosley, 1980). If all the gamma rays generated by the 56Co 56Fe decay are fully thermalized, the decline rate of the light curve at the nebular phase should equal the 56Co decay slope, and the mass of 56Ni can be determined from the bolometric luminosity on the exponential tail in Figure 8 using the equation below (Hamuy, 2003),
| (3) |
where is the explosion epoch, days is the half-life of 56Ni and days is -folding time of 56Co. is the tail luminosity which is calculated by Eq.(1) of Hamuy (2003).
Using Eq.(3) we estimated from each point on the late-time tail for SN 2004dj. The average of these mass estimates is = 0.0250. 010, which is similar to that produced in SN 1999em ( = 0.0210.002 ; Elmhamdi et al. (2003b)). The error in the 56Ni mass is caused by the uncertainties in the explosion date, extinction, and the distance to NGC 2403.
5.2.2 The 56Ni Mass from the “Steepness of Decline” Correlation
A correlation between the maximum gradient at the transition phase in the band and the photometric estimate of has been reported by Elmhamdi et al. (2003a). A characteristic steepness parameter has been defined as S = /d, which corresponds to the maximum gradient rate of the light curve between plateau and nebular phase. Based on a sample of ten SNe II-P, they derived a linear relation between (in unit of solar mass ) and S,
| (4) |
Using the template flux from Eq.(1) of Elmhamdi et al. (2003a), we fit the light curves of SN 2004dj in several intermediate bands (, , , and ) that do not include strong emission or absorption lines, as well as in the transformed band. The results are shown in Figure 9. For each band, the upper panel shows the best fit for the light curve, while the lower panel shows the profiles of S and the derived inflection time . The average value of the “steepness” parameter S from fitting the light curves is , which suggests a 56Ni mass of . This value is consistent with that determined from the bolometric light curve study, providing support for the validity of the steepness parameter method. However, one should note that in the case of SN 2003gd, Hendry et al. (2005) find the mass of 56Ni estimated from this method is significantly lower than that from tail luminosity method.
The above two determinations allow us to estimate the amount of 56Ni mass in SN 2004dj is 0.023 . This value is typical for a normal SN II-P, and is consistent with the independent estimates from the H luminosity or comparison with SN 1987A (Chugai et al., 2005).
6 The progenitor star of SN 2004dj
The detailed photometric observations may provide valuable constraints on the explosion parameters of the supernova and hence on the progenitor star (Hendry et al., 2005). The hydrodynamical models of SNe II-P light curves originally proposed by (Litvinova & Nadyozhin, 1985) predicted a correlation between the phenomenological parameters (the plateau duration, the absolute magnitudes and photosphere velocity at the middle of the plateau) and the physical parameters such as the explosion energy , the ejecta mass , and the initial radius of the pre-supernova star .
Although the early observations immediately after the explosion were unavailable for SN 2004dj, the fact that it resembles SN 1999em allows us to make an assumption about the length of its plateau phase (t days). Adopting the reddening estimate in 4.2 and standard reddening law of RV = 3.1, we derived the absolute magnitude during the plateau phase as mag. From the spectrum observed at 52 days after explosion (Patat et al., 2004), we estimate a photosphere velocity ( km s-1) from weak Fe II absorption lines near 5000 Å. With these observed parameters, we can estimate the explosion parameters by using the simple approximation formulae from (Litvinova & Nadyozhin, 1985), which are here give as
| (5) |
| (6) |
| (7) |
Combing the observed parameters and the above relations yields an explosion energy erg, an ejecta mass , and an initial radius for the pre-supernova star of SN 2004dj. Taking into account approximately 2–3 for the remnant neutron star and the mass loss lost by stellar wind prior to the SN explosion, we obtain a possible range of 8–20 for the main sequence mass of the progenitor, which is consistent with the estimates determined by the turnoff mass of the star cluster hosting SN 2004dj (Wang et al., 2005; Maíz-Apellániz et al., 2004). The derived parameters for the progenitor of SN 2004dj suggest it was a K0–M0 supergiant (Cox, 2000).
7 Conclusions
This paper presents the photometry of SN 2004dj taken with 12 intermediate-band filters, and obtained from 60 to 200 days after the explosion. Our observations show that SN 2004dj was discovered in the middle of the plateau phase. The multicolor light curves show a plateau phase of about 45 days, a transition period of about 30 days during which the SN declines dramatically, and a nebular phase during which the SN declines at a rate of 0.100.03 mag (10 days)-1 (consists with the decay rate of 56Co).
The SEDs for SN 2004dj are constructed from the measured flux in the 12 passbands. These SEDs show an evolution that is similar to the spectral evolution of a normal SN II-P. A flux peak near 6600 Å is observed, which is consistent with the strong H emission seen in these objects. The flux around 8500 Å evolves from a flux deficit to a flux peak, consisting with the evolution of the strong Ca II near-IR triplet line.
By comparing the light curve of SN 2004dj to the well observed SN II-P 1999em, we estimate the explosion date for SN 2004dj to be JD 245316821 (June 11, 2004), approximately 50 day before the actual discovery of SN 2004dj.
Finally, we estimate the 56Ni mass synthesized during the SN 2004dj explosion using two methods: the bolometric tail luminosity and the “steepness” parameter. These methods yield a value of = 0.023 for SN 2004dj, which is typical for a normal SN II-P. Comparing our observed parameters of SN 2004dj with the analytical models of SN II-P light curves (Litvinova & Nadyozhin, 1985), We derive for SN 2004dj an explosion energy of erg, an ejecta mass of , and an initial radius of . These parameters suggest that the progenitor of SN 2004dj is likely to be a K0–M0 type supergiant.
References
- Barbon et al. (1990) Barbon, R., Benetti S., Rosino L., Cappellaro E., Turatto, M. 1990, A&A, 237, 79
- Barbon et al. (2000) Barbon, R., Carraro, G., Munari, U., Zwitter, T., & Tomasella, L. 2000, A&AS, 144, 451
- Beswick et al. (2005) Beswick, R. J., Muxlow, T. W. B., Argo, M. K., Pedlar, A., Marcaide, J. M., & Wills, K. A. 2005, ApJ, 623, L21
- Cardelli, Clayton & Mathis (1989) Cardelli, J. A., Clayton, G. C., & Mathis, J. S. 1989, ApJ, 345, 245
- Chugai et al. (2005) Chugai, N. N., et al. 2005(astro-ph/0507689)
- Cox (2000) Cox A. N. 2000, in Allen’s Astrophysical Quantities. Fourth edition
- Eastman et al. (1996) Eastman, R. G., Schmidt, B. P., & Kirshner, R. P. 1996, ApJ, 466, 911
- Elmhamdi et al. (2003a) Elmhamdi, A., et al. 2003, MNRAS, 338, 939
- Elmhamdi et al. (2003b) Elmhamdi, A., Chugai, N. N., & Danziger, I. J. 2003, A&A, 404, 1077
- Fan et al. (1996) Fan, X., et al. 1996, AJ, 112, 628
- Hamuy et al. (2001) Hamuy, M., et al. 2001, ApJ, 558, 615
- Hamuy (2003) Hamuy, M. 2003, ApJ, 582, 905
- Hamuy (2004) Hamuy, M. 2004, in Measuring and Modeling the Universe,from the Carnegie Observatories Centennial Symposia. Carnegie Observatories Astrophysics Series. Edited by W. L. Freedman, 2004. Pasadena: Carnegie Observtories, The Latest Version of the Standardized Candle Method for Type II Supernovae, astro-ph/0301281
- Hendry et al. (2005) Hendry, M. A., et al. 2005, MNRAS, 359, 906
- Karachentsev et al. (2004) Karachentsev, I. D., Karachentseva, V. E., Huchtmeier, W. K., & Makarov, D. I. 2004, AJ, 127, 2031
- Korcakova et al. (2005) Korcakova, D., et al. 2005, Information Bulletin on Variable Stars, 5605, 1
- Leonard et al. (2002) Leonard, D. C., Filippenko, A. V., Li, W., et al., 2002, AJ, 124, 2490
- Litvinova & Nadyozhin (1985) Litvinova, I. Yu.,& Nadyozhin D. K. 1985, Sov. Astron. Lett., 11, 145
- Maíz-Apellániz et al. (2004) Maíz-Apellániz, J. et al. 2004, ApJ, 615, L113
- Munari & Zwitter (1997) Munari, U., & Zwitter, T. 1997, A&A, 318, 269
- Nakano et al. (2004) Nakano, S., Itagaki, K., Bouma, R. J., Lehky, M. & Hornoch, K. 2004, IAUC, 8377
- Oke & Gunn (1983) Oke, J. B., & Gunn, J. E. 1983, ApJ, 266, 713
- Patat et al. (2004) Patat, F., Benetti, S., Pastorello, A., Filippenko, A. V. & Aceituno, J. 2004, IAUC, 8378
- Pooley & Lewin (2004) Pooley, D., & Lewin, W. H. G. 2004, IAUC, 8390
- Sandage (1984) Sandage, A. 1984, AJ, 89, 630
- Schlegel, Finkbeiner & Davis (1998) Schlegel D. J., Finkbeiner D. P., & Davis M. 1998, ApJ, 500, 525
- Stetson (1987) Stetson, P. B. 1987, PASP, 99, 191
- Suntzeff & Bouchet (1990) Suntzeff, N. B., & Bouchet, P. 1990, AJ, 99, 650S
- Wang et al. (2005) Wang, X. F., et al. 2005, ApJ, 626, L89
- Weaver & Woosley (1980) Weaver, T. A., & Woosley, S. E., 1980, Ann. N. Y. Acad. Sci, 336, 335
- Weis et al. (2004) Weis, K., Bomans, D. J., Klose, S., & Spiller, F, 2004, IAUC, 8384
- Yan et al. (1999) Yan, H. et al. 2000, PASP, 112, 691
- Zhou et al. (2001) Zhou, X. et al. 2001, ChJAA, 1, 372
- Zhou et al. (2003) Zhou, X. et al. 2003, A&A, 397, 361


| ID. | (2000.0) | (2000.0) | d | e | f | g | h | i | j | k | m | n | o | p |
|---|---|---|---|---|---|---|---|---|---|---|---|---|---|---|
| 1 | 07:35:09.74 | 65:46:36.5 | 13.30(01) | 13.12(01) | 12.94(01) | 12.85(01) | 12.78(01) | 12.68(01) | 12.57(01) | 12.58(01) | 12.55(01) | 12.56(01) | 12.52(01) | 12.52(02) |
| 2 | 07:35:10.62 | 65:44:02.4 | 14.22(01) | 14.06(01) | 13.90(01) | 13.79(01) | 13.73(01) | 13.58(01) | 13.50(01) | 13.51(01) | 13.45(01) | 13.46(01) | 13.39(03) | 13.42(03) |
| 3 | 07:37:21.71 | 65:42:41.4 | 13.06(01) | 12.94(01) | 12.81(01) | 12.77(01) | 12.74(01) | 12.79(01) | 12.55(01) | 12.62(01) | 12.58(01) | 12.57(01) | 12.58(02) | 12.62(02) |
| 4 | 07:38:02.01 | 65:42:03.3 | 14.06(01) | 13.77(01) | 13.57(01) | 13.35(01) | 13.25(01) | 13.06(01) | 12.92(01) | 12.89(01) | 12.84(01) | 12.81(01) | 12.75(02) | 12.76(02) |
| 5 | 07:35:14.21 | 65:34:13.1 | 14.12(01) | 13.88(01) | 13.72(01) | 13.57(01) | 13.52(01) | 13.36(01) | 13.22(01) | 13.27(01) | 13.23(01) | 13.18(01) | 13.20(02) | 13.22(03) |
| 6 | 07:39:15.32 | 65:33:11.9 | 13.91(01) | 13.71(01) | 13.54(01) | 13.44(01) | 13.39(01) | 13.26(01) | 13.16(01) | 13.18(01) | 13.14(01) | 13.13(01) | 13.11(02) | 13.14(03) |
| 7 | 07:36:12.57 | 65:31:41.2 | 13.72(01) | 13.42(01) | 13.22(01) | 13.04(01) | 12.95(01) | 12.84(01) | 12.66(01) | 12.67(01) | 12.60(01) | 12.58(01) | 12.52(01) | 12.51(02) |
| 8 | 07:36:48.80 | 65:30:53.3 | 13.23(01) | 13.05(01) | 12.93(01) | 12.83(01) | 12.79(01) | 12.67(01) | 12.56(01) | 12.58(01) | 12.53(01) | 12.53(01) | 12.50(01) | 12.50(02) |
| 9 | 07:36:50.58 | 65:24:06.2 | 13.96(01) | 13.82(01) | 13.69(01) | 13.63(01) | 13.61(01) | 13.48(01) | 13.37(01) | 13.42(01) | 13.37(01) | 13.33(01) | 13.34(02) | 13.38(03) |
| 10 | 07:37:13.64 | 65:53:08.3 | 13.59(01) | 13.41(01) | 13.25(01) | 13.11(01) | 13.05(01) | 12.93(01) | 12.79(01) | 12.83(01) | 12.79(01) | 12.78(01) | 12.73(02) | 12.79(02) |
| 11 | 07:34:36.72 | 65:57:59.6 | 13.36(01) | 13.18(01) | 13.00(01) | 12.89(01) | 12.81(01) | 12.71(01) | 12.58(01) | 12.61(01) | 12.56(01) | 12.59(01) | 12.55(01) | 12.58(02) |
| 12 | 07:39:37.89 | 65:49:20.6 | 14.21(01) | 14.02(01) | 13.90(01) | 13.82(01) | 13.75(01) | 13.64(01) | 13.49(02) | 13.55(01) | 13.52(01) | 13.50(02) | 13.51(03) | 13.43(03) |
| 13 | 07:39:25.03 | 65:44:04.4 | 13.57(01) | 13.39(01) | 13.21(01) | 13.09(01) | 13.03(01) | 12.92(01) | 12.77(01) | 12.82(01) | 12.78(01) | 12.80(01) | 12.72(02) | 12.85(02) |
| 14 | 07:40:58.95 | 65:32:20.1 | 12.66(01) | 12.56(01) | 12.41(01) | 12.33(01) | 12.31(01) | 12.28(01) | 12.10(01) | 12.16(01) | 12.10(01) | 12.11(01) | 12.11(01) | 12.12(01) |
| 15 | 07:34:13.90 | 65:44:54.6 | 13.07(01) | 12.93(01) | 12.82(01) | 12.76(01) | 12.72(01) | 12.64(01) | 12.54(01) | 12.59(01) | 12.56(01) | 12.58(01) | 12.57(01) | 12.58(02) |
| 16 | 07:33:52.97 | 65:31:28.5 | 13.76(01) | 13.49(01) | 13.28(01) | 13.11(01) | 13.05(01) | 12.88(01) | 12.74(01) | 12.74(01) | 12.67(01) | 12.65(01) | 12.60(01) | 12.55(03) |
| 17 | 07:34:37.01 | 65:31:55.4 | 12.32(01) | 12.18(01) | 12.04(01) | 11.94(01) | 11.91(01) | 12.07(01) | 11.68(01) | 11.73(01) | 11.70(01) | 11.69(01) | 11.68(01) | 11.69(01) |
| 18 | 07:38:30.15 | 65:15:59.4 | 13.36(01) | 13.19(01) | 13.04(01) | 12.90(01) | 12.85(01) | 12.71(01) | 12.60(01) | 12.63(01) | 12.55(01) | 12.56(01) | 12.57(02) | 12.54(02) |
| 19 | 07:41:13.26 | 65:24:06.0 | 12.63(01) | 12.56(01) | 12.44(01) | 12.40(01) | 12.38(01) | 12.33(01) | 12.20(01) | 12.25(01) | 12.22(01) | 12.24(01) | 12.26(01) | 12.24(01) |
| 20 | 07:39:12.62 | 65:25:01.3 | 13.98(01) | 13.73(01) | 13.57(01) | 13.33(01) | 13.24(01) | 13.06(01) | 12.92(01) | 12.94(01) | 12.85(01) | 12.84(01) | 12.83(02) | 12.79(02) |
Note. — All quantities are magnitudes. Uncertainties in the last two digits are indicated in parentheses. Uncertainties which are less than 0.01 indicate as 0.01 in the table.
| Date(UT) | JDaa2450000+ | |||||||||||||||
|---|---|---|---|---|---|---|---|---|---|---|---|---|---|---|---|---|
| 12/08/04 | 3230 | 12.35(01) | 11.89(01) | 11.82(01) | 11.48(01) | 11.68(01) | 11.74(01) | 11.71(01) | 12.09(02) | 11.69(02) | 11.69(04) | 12.00(05) | 11.58(06) | 11.67(06) | ||
| 14/08/04 | 3232 | 12.12(02) | 12.06(08) | 11.42(04) | 11.83(07) | 11.68(03) | 11.52(04) | |||||||||
| 17/08/04 | 3235 | 12.40(03) | 12.08(01) | 11.92(01) | 11.67(01) | 12.06(02) | 11.60(04) | |||||||||
| 18/08/04 | 3236 | 11.98(01) | 11.81(01) | 11.48(01) | 11.70(01) | 11.70(01) | 11.66(02) | 12.04(06) | 11.58(06) | 11.66(07) | ||||||
| 19/08/04 | 3237 | 12.42(02) | 12.13(01) | 11.93(01) | 11.66(01) | 12.07(02) | 11.69(04) | |||||||||
| 30/08/04 | 3248 | 12.54(05) | 12.20(03) | 12.09(02) | 12.03(02) | 11.90(01) | 11.60(01) | 11.75(01) | 11.77(01) | 11.75(01) | 12.11(02) | 11.77(06) | 11.77(05) | 12.16(06) | 11.71(05) | 11.72(06) |
| 01/09/04 | 3250 | 11.91(01) | 11.58(01) | 11.76(01) | 11.77(01) | 11.78(01) | 12.09(02) | 11.74(02) | 12.17(06) | 11.69(06) | 11.70(07) | |||||
| 05/09/04 | 3254 | 12.24(01) | 11.94(01) | 11.65(01) | 11.81(01) | 11.82(01) | 11.81(01) | 12.12(01) | 11.83(02) | 11.75(06) | ||||||
| 07/09/04 | 3256 | 12.66(01) | 12.16(01) | 12.08(01) | 11.67(03) | |||||||||||
| 09/09/04 | 3258 | 12.79(07) | 12.30(03) | 12.15(02) | 12.11(02) | 11.96(01) | 11.70(01) | 11.75(05) | 12.23(05) | 11.80(06) | ||||||
| 10/09/04 | 3259 | 11.87(01) | 11.87(01) | 11.90(01) | 12.16(02) | 11.84(03) | 11.80(07) | |||||||||
| 11/09/04 | 3260 | 12.29(01) | 12.21(01) | 11.90(01) | ||||||||||||
| 12/09/04 | 3261 | 12.01(01) | 11.90(01) | 11.93(01) | 12.13(01) | 11.88(02) | 11.72(07) | |||||||||
| 18/09/04 | 3267 | 12.25(01) | 11.96(03) | |||||||||||||
| 20/09/04 | 3269 | 12.87(02) | 11.85(01) | 11.96(06) | ||||||||||||
| 21/09/04 | 3270 | 12.33(01) | 12.09(01) | 12.04(02) | 12.18(01) | 12.04(02) | 12.46(08) | 11.84(07) | ||||||||
| 22/09/04 | 3271 | 12.95(02) | 12.16(01) | 12.08(04) | ||||||||||||
| 26/09/04 | 3275 | 12.60(08) | 12.58(13) | 12.06(03) | 12.16(06) | |||||||||||
| 01/10/04 | 3280 | 12.78(02) | 12.64(01) | 12.49(01) | 12.46(01) | 12.40(02) | ||||||||||
| 02/10/04 | 3281 | 13.33(03) | 12.67(01) | 12.53(01) | 12.25(01) | 12.51(01) | 12.35(05) | 12.78(06) | 12.35(06) | 11.96(08) | ||||||
| 04/10/04 | 3283 | 12.61(02) | 12.44(02) | 12.49(05) | ||||||||||||
| 05/10/04 | 3284 | 12.90(01) | 12.80(01) | 12.33(01) | 12.63(01) | 12.92(06) | 12.43(06) | 12.21(10) | ||||||||
| 07/10/04 | 3286 | 13.50(03) | 12.71(01) | 12.73(02) | ||||||||||||
| 08/10/04 | 3287 | 13.04(02) | 12.88(01) | 12.78(01) | 12.57(01) | 12.73(02) | 12.65(05) | 12.37(06) | ||||||||
| 09/10/04 | 3288 | 13.03(03) | 12.86(02) | 12.55(01) | 13.00(02) | 12.75(03) | 13.15(06) | 12.65(05) | 12.32(10) | |||||||
| 11/10/04 | 3290 | 13.35(02) | 13.24(10) | 12.61(07) | 13.04(20) | |||||||||||
| 12/10/04 | 3291 | 13.31(01) | 13.28(01) | 13.15(01) | 12.86(01) | 13.36(01) | 13.08(03) | 13.39(06) | 12.96(05) | 12.49(20) | ||||||
| 13/10/04 | 3292 | 13.39(01) | 13.31(01) | 13.50(01) | 12.93(02) | |||||||||||
| 14/10/04 | 3293 | 13.60(01) | 13.46(01) | 13.66(02) | ||||||||||||
| 15/10/04 | 3294 | 14.43(04) | 14.01(02) | 13.31(01) | 13.86(02) | 13.12(02) | 13.53(08) | 13.41(05) | ||||||||
| 18/10/04 | 3297 | 14.36(03) | 14.23(02) | 14.18(03) | 14.09(08) | 14.47(06) | 13.45(12) | |||||||||
| 21/10/04 | 3300 | 14.60(03) | 14.55(04) | 14.57(04) | ||||||||||||
| 22/10/04 | 3301 | 14.91(04) | 14.66(04) | 14.43(03) | 14.45(04) | 14.74(07) | ||||||||||
| 25/10/04 | 3304 | 15.53(06) | 14.04(03) | 13.66(02) | 14.30(07) | 14.45(11) | 14.86(10) | 14.14(05) | 13.43(07) | |||||||
| 27/10/04 | 3306 | 15.46(14) | 14.10(02) | 14.58(10) | 14.57(09) | 14.20(07) | 14.29(14) | 14.21(02) | 13.43(07) | |||||||
| 02/11/04 | 3312 | 15.36(14) | 14.68(05) | 14.52(06) | ||||||||||||
| 03/11/04 | 3313 | 14.84(07) | 14.53(10) | 13.62(02) | 14.95(13) | |||||||||||
| 04/11/04 | 3314 | 15.43(04) | 14.15(02) | 14.45(06) | ||||||||||||
| 05/11/04 | 3315 | 15.69(10) | 15.10(04) | 14.59(04) | 14.30(03) | 14.10(02) | 14.66(04) | 14.71(04) | 14.55(03) | 13.63(02) | 14.27(05) | 14.19(12) | 14.72(06) | 14.20(05) | 13.47(06) | |
| 07/11/04 | 3317 | 15.57(07) | 15.13(03) | 14.08(02) | 14.67(04) | 14.18(05) | ||||||||||
| 10/11/04 | 3320 | 14.86(04) | 14.87(03) | 14.64(02) | 14.99(07) | |||||||||||
| 13/11/04 | 3223 | 14.11(01) | 13.62(01) | 14.29(07) | 14.48(09) | 15.00(06) | 14.21(01) | 13.37(12) | ||||||||
| 16/11/04 | 3326 | 15.81(09) | 15.23(04) | 14.72(04) | 14.75(04) | 13.58(02) | 14.74(18) | |||||||||
| 17/11/04 | 3327 | 14.87(03) | 14.88(04) | 14.73(03) | 14.57(03) | 14.20(05) | 14.98(06) | 13.07(16) | ||||||||
| 19/11/04 | 3329 | 15.77(08) | 15.13(04) | 13.55(02) | 14.56(15) | |||||||||||
| 30/11/04 | 3340 | 15.07(03) | 14.12(01) | 14.85(03) | 14.22(05) | |||||||||||
| 01/12/04 | 3341 | 15.92(10) | 15.27(07) | 14.13(02) | 14.41(09) | 14.23(06) | ||||||||||
| 07/12/04 | 3347 | 16.21(14) | 15.12(03) | 14.20(02) | 14.78(04) | 14.77(08) | 14.58(10) | 14.30(05) | ||||||||
| 11/12/04 | 3351 | 15.85(06) | 15.13(03) | 14.90(05) | 14.80(04) | 14.85(09) | 13.57(02) | 15.02(18) | ||||||||
| 14/12/04 | 3354 | 15.52(07) | 15.11(05) | 14.99(03) | 14.78(04) | 14.52(10) | 15.22(06) | 13.21(20) | ||||||||
| 20/12/04 | 3360 | 15.23(05) | 14.11(01) | 13.54(02) | 14.90(18) | 15.32(06) | 14.21(06) | |||||||||
| 29/12/04 | 3369 | 15.50(08) | 15.36(14) | 15.11(12) | 15.47(06) | |||||||||||
| 30/12/04 | 3370 | 15.57(05) | 15.36(03) | 14.14(01) | 14.71(07) | 14.25(06) | ||||||||||
| 06/01/05 | 3377 | 16.08(07) |
| Filter name | (Å) | Decline rate |
|---|---|---|
| [mag (10 days)-1] | ||
| d | 4540 | |
| e | 4925 | |
| f | 5270 | |
| g | 5795 | |
| h | 6075 | |
| i | 6656 | |
| j | 7057 | |
| k | 7546 | |
| m | 8023 | |
| n | 8480 | |
| o | 9182 | |
| p | 9739 |