Harmonic analysis of the H velocity field of NGC 4254
The ionized gas kinematics of the Virgo Cluster galaxy NGC 4254 (Messier 99) is analyzed by an harmonic decomposition of the velocity field into Fourier coefficients. The aims of this study are to measure the kinematical asymmetries of Virgo cluster galaxies and to connect them to the environment. The analysis reveals significant terms which origins are discussed.
1 Introduction
Galaxies in clusters are sensitive to environmental effects like the cluster tidal field, gravitational encounters with other galaxies, galaxy mergers, ram pressure stripping and accretion of gas (see e.g. Moore et al. 1998, Vollmer et al. 2001). Such external events dramatically affect their structure, triggering internal perturbations like bars or oval distorsions (e.g. Bournaud & Combes 2002), spirals, warps (Huang & Carlberg 1997) or lopsidedness (Bournaud et al. 2005). Their kinematics is also disturbed, as revealed by long-slit spectroscopy 1-D rotation curves (Rubin et al. 1999).
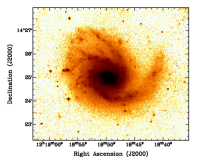
High-resolution H velocity fields were obtained for 30 Virgo cluster galaxies (Chemin et al. 2005) in order to study the degree of perturbation of their 2-D kinematics and the influence of the environment on the kinematics. The harmonic analysis is a powerful tool to detect kinematical anomalies, as already shown on Hi velocity fields (Schoenmakers, Franx & de Zeeuw 1997). This technique is applied to the H velocity field of NGC 4254 (Figure 1).
2 The Virgo Atlas : observations
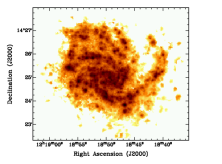
The data acquisition and reduction are described in details in Chemin et al. (2005). Data cubes of 30 galaxies were obtained in the H emission-line at the Observatoire du mont Mégantic (Canada), the Observatoire de Haute-Provence, the ESO 3.6-m telescope and the Canada-France-Hawaii-Telescope between 2000 and 2005. The instrument is composed of a focal reducer and a Fabry-Perot interferometer coupled with a photon-counting system. The spectral sampling of the observations varies between 7 and 16 km s-1, the spatial sampling between 0.42” and 1.61”, and the field-of-view between 3.6’ and 13.7’. The typical total exposure time per spectral channel is 4 minutes.
3 Results of the harmonic decomposition and analysis
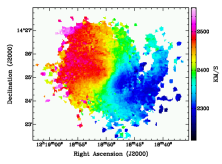
A tilted-ring model is first fitted to the velocity field to derive the inclination, position angle, systemic velocity and kinematical centre. The velocity field is then expanded into Fourier coefficients by fitting (Schoenmakers et al. 1997). corresponds to the angle in the plane of a ring, the coefficient to the systemic velocity of a ring, the first order term to the rotation curve and all other terms to non-circular motions. Since no warping of the optical disk is clearly detected in this galaxy, the inclination () and kinematic position angle () can be kept constant as a function of radius during the fitting. The Fourier coefficients are computed up to the 4-th order. Figure 2 shows the results of the decomposition inside a radius of . The results are :
-
a large variation of the c0 term at small radius which is accompanied by significant non-zero c2 and s2 terms. This likely indicates the effect of a lopsided potential ( perturbation).
-
a nearly constant value of 7 2 km s-1 inside 100” for the s1 term. This feature does not disappear when and/or are allowed to vary. It could be due to elliptical streamings in a perturbing potential and/or to a radial inflow (considering trailing spiral arms).
-
large variations of the c4 and s4 terms at large radius (). At these radii, the emission is dominated by many Hii regions in the northern and western arms and no evident or modes are detected. The origin of these asymmetries still remains to be explained.

This work is in progress and we plan to investigate which event has created the perturbations of the potential of NGC 4254. It could be due to the accretion of gas into the disk plane (Phookun, Vogel & Mundy 1993).
References
- (1) Bournaud F., & Combes F. 2002, A&A, 392, 83
- (2) Bournaud F., et al., 2005, A&A, 438, 507
- (3) Chemin L., et al., 2005, MNRAS, in press, astro-ph/0511417
- (4) Gavazzi G., et al., 2003, A&A, 400, 451
- (5) Huang S., & Carlberg R. G., 1997, ApJ, 480, 503
- (6) Moore B., Lake G., Katz N., 1998, ApJ, 499, L5
- (7) Phookun B., Vogel S. N., & Mundy L. G., 1993, ApJ, 418, 113
- (8) Rubin V. C., Waterman A. H., & Kenney J. D. P., 1999, AJ, 118, 236
- (9) Schoenmakers R. H. M., Franx M., & de Zeeuw P. T., 1997, MNRAS, 292, 349
- (10) Vollmer B., et al., 2001, ApJ, 1561, 708